Autor Cointelegraph By Yashu Gola

DOGE price analysis hints at 30% drop despite Elon Musk's Twitter bid

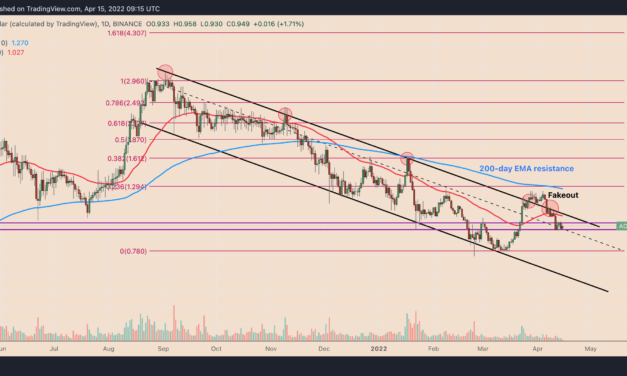
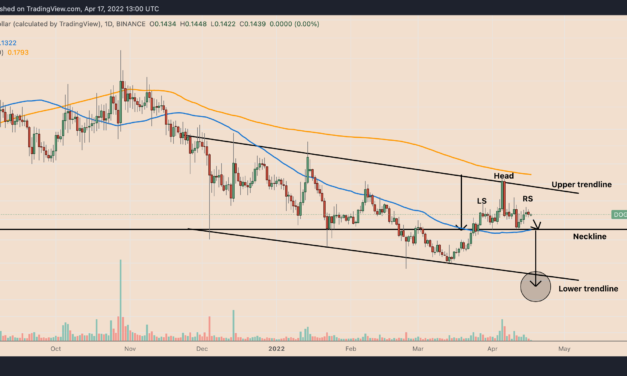
The brief Dogecoin (DOGE) price rally last week following Tesla CEO Elon Musk’s bid to buy Twitter appears to be fizzling out as DOGE closes the week over 8%. DOGE’s price dropped to $0.142 on April 17, three days after peaking out locally at $0.149. The Dogecoin correction, albeit modest, raised its potential to trigger a classic bearish reversal pattern with an 85% success rate of reaching its downside target. DOGE price eyes drop under $0.10Dubbed head and shoulders (H&S), the pattern appears when the price forms three peaks in a row, with the middle one, called the “head,” in between the other two, which are of almost equal height, and are thus called the left and right “shoulders.”These three peaks hold above a common support level called the “neckline.” As the theory goes, the price typically breaks below the neckline after forming the third peak, or the right shoulder, and falls by as much as the H&S’s maximum height, i.e., the distance between the head’s top and neckline.It appears DOGE has been forming a similar structure at least since March 24. The cryptocurrency now eyes a drop to the neckline after forming its right shoulder, followed by a full-fledged bearish breakout, as shown in the chart below.DOGE/USD daily price chart. Source: TradingViewAs a result, Dogecoin’s probability of correcting toward its H&S neckline near $0.132 appears higher, down about 7.5% below today’s price. The level coincides with DOGE’s 50-day simple moving average (50-day SMA; the blue wave), thus providing additional support.A decisive breakout move below the support confluence could risk triggering the H&S setup, with the downside target sitting below $1, down almost 30% below today’s price. Interestingly, the target appears close to the lower trendline of the descending channel pattern that has enveloped Dogecoin’s price moves since December 2021.The “Musk effect”Musk continues to be an influential catalyst behind Dogecoin’s interim price trends. The news of him buying a 9.2% stake in Twitter on April 4 helped boost DOGE’s price by more than 20% to $0.174 a day after, its best level in almost three months. A correction followed as traders locked interim profits, only for DOGE price to rebound again after Musk showed intentions to acquire Twitter in its entirety for $43 billion.Related: AMC Theaters mobile app accepts Dogecoin, Shiba Inu and moreEnthusiasts believe that the “Musk effect” and his growing influence on Twitter could boost Dogecoin adoption and price, their sentiment furthered by Robinhood CEO Vladimir Tenev, who earlier this week said DOGE could become the “currency of the internet.”#dogecoin + Elon Musk + Twitter + Popularity = $10 future value let’s go $Doge #DogecoinToTheMoon— Dogecoin and Bitcoin HODL (@HodlDogecoin) April 15, 2022Musk has supported the idea so far, suggesting the Twitter board introduce a DOGE payment option for the social media’s Twitter Blue monthly subscription service.The views and opinions expressed here are solely those of the author and do not necessarily reflect the views of Cointelegraph.com. Every investment and trading move involves risk, you should conduct your own research when making a decision.

Čítaj viac

Cardano price risks 30% drop in Q2 despite a 'major' hard fork ahead

Cardano (ADA) price risks undergoing a severe correction in the next few months despite touting its blockchain network’s bolstering growth and a “major” hard fork event in June.Descending channel hints at ADA selloff aheadADA, which makes up about 1.75% of the total crypto market capitalization, has been trending lower since September 2021, inside a “descending channel” pattern that has successfully capped its multiple upside attempts, as illustrated in the chart below.ADA/USD daily price chart featuring descending channel setup. Source: TradingViewThe channel showed further strength as ADA broke above its upper trendline on March 27, only to reverse entirely in later sessions, showing a lack of conviction among the Cardano bulls. ADA’s 200-day exponential moving average (200-day EMA; the blue wave), alongside the 0.236 Fib line (near $1.29) of the Fibonacci retracement graph, drawn from $2.96-swing high to $0.78-swing low, further aided the bearish bias.As of April 15, ADA’s price consolidates inside the $0.97-$0.92 range, signaling intentions to continue its pullback from its fakeout top near $1.25. If the descending channel setup continues panning out, ADA/USD could fall to its previous bottom range near $0.78 while eyeing the channel’s lower trendline around $0.65 as its primary downside target.ADA/USD daily price chart. Source: TradingViewThat amounts to an almost 30% drop from today’s price.Cardano network growth fails to impress tradersMeanwhile, Input Output Hong Kong (IOHK), the research and development firm behind the Cardano project, has announced incredible network growth entering April 2022.Stablecoins, sidechains, NFTs & partnerships, launchpads & project launches, converter bridges…getting overwhelmed with all the news from the #Cardano universe?We’ve gathered a structured recap of the key updates over the last 10 days.Here’s what’s happening$ADA— Input Output (@InputOutputHK) April 12, 2022IOHK also appears to be readying the “Vasil” hard fork, a network upgrade to make Cardano’s blockchain more scalable, sometime in June. Cardano founder Charles Hoskinson stressed the word “major” five times when describing the fork’s importance to the overall network growth in a video released April 12, a day after ADA crashed more than 10%.Related: Mark Yusko explains the real problem with Fed policy — and why Bitcoin mattersYes, ADA’s price recovered after Hoskinson’s address and IOHK’s tweets. But the rebound lost momentum and is trending sideways, remaining under the influence of macro factors.The daily correlation coefficient between ADA/USD and NDX. Source: TradingView Notably, like Bitcoin, ADA’s correlation with the Nasdaq-100 (NDX) rose to a record level, hitting 0.97 on April 15 versus.0.79 at the beginning of the year. In other words, ADA price is currently in lockstep with the tech-heavy index, which has erased more than $1 trillion from its market cap in April.The views and opinions expressed here are solely those of the author and do not necessarily reflect the views of Cointelegraph.com. Every investment and trading move involves risk, you should conduct your own research when making a decision.

Čítaj viac

XRP price bounces to $0.72 but still risks new lows in April — Here's why

Ripple’s XRP took a break from its prevailing downtrend as its price rebounded from $0.68 to $0.72 in the last three days.Ripple scores vs. SECTraders returned to buying XRP after a U.S. court denied the U.S. Securities and Exchange Commission’s (SEC) request to shield internal documents related to June 2018 speech made by its former director William Hinman wherein he said Bitcoin (BTC) and Ether (ETH) are not securities.To recap, SEC filed a lawsuit against Ripple, a San Francisco payment services company, in 2020, alleging that it and its executives Brad Garlinghouse and Christian Larsen conducted illegal securities sales via XRP tokens. But Hinman’s treatment of similar cryptocurrencies as utility tokens prompted Ripple’s legal team to argue that the SEC showed bias toward XRP by treating it as a security token.Overall, the legal battle has limited XRP’s upside to date. For instance, it remains the only top cryptocurrency that couldn’t break its all-time high of over $3 in 2018.XRP/USD weekly price chart. Source: TradingViewBut with Ripple scoring some wins against the SEC, analysts are hopeful that it would bring a sustainable buying momentum back to XRP’s market.I hope Ripple, and if they do then yes it will pump— Lark Davis (@TheCryptoLark) April 4, 2022More downside for XRP price?The latest XRP price rebound comes when it is already breaking out of a classic bearish pattern.In detail, XRP consolidated inside an ascending triangle between Dec. 28, 2021, and April 4, 2022. Ascending triangles are considered continuation patterns, for they resolve after the price breaks out in the direction of its previous trend. XRP broke out of its ascending triangle pattern to the downside on April 5, as shown in the chart below.XRP/USD daily price chart featuring ‘ascending channel’ setup. Source: TradingViewAs a rule, anascending triangle breakout targets come to be at length equal to the maximum distance between the structure’s upper and lower trendline when measured from the breakout point. In XRP’s case, the breakout point is near $0.82 while its triangle’s maximum height is around $0.32.This puts the bearish target for XPR at near $0.50, which would be a new 2022 low. Related: Digital currencies could get a boost from the international crisis: BlackRock CEOConversely, if XRP/USD stays above $0.69 as interim support, a rebound to the 50-day simple moving average (50-day SMA; blue wave in the chart above) near $0.78 in April is possible. Furthermore, a test of the 200-day EMA (orange wave) around $0.88 in Q2 would then be the next goal for the bulls.The views and opinions expressed here are solely those of the author and do not necessarily reflect the views of Cointelegraph.com. Every investment and trading move involves risk, you should conduct your own research when making a decision.

Čítaj viac

ApeCoin eyes 250% rally amid 'bull pennant' breakout, Robinhood APE listing rumors

ApeCoin’s (APE) market valuation could grow by nearly 250% in the second quarter of 2022 as it breaks out of a widely-tracked, classic technical pattern.APE price “bull pennant” breakout underwayOn April 13, APE’s price broke above the upper trendline of what appears to be a “bull pennant” chart pattern.Bull pennants appear when the price consolidates inside a triangle-like structure following a strong uptrend. Many traditional analysts consider them as continuation patterns, for they typically result in the price breaking out in the direction of its previous trend.As a rule, traders estimate a bull pennant’s upside target by measuring the size of the previous uptrend, called “flagpole,” and adding it to the breakout point. Applying the same to ApeCoin’s ongoing breakout move shows its potential for its potential for massive upside. APE/USD daily price chart featuring ‘bull pennant’ setup. Source: TradingViewTherefore, if the bull pennant structure pans out as intended, APE could rise to nearly $40 in Q2/2022.Robinhood listing?The bullish setup for ApeCoin appears as it rebounds by nearly 17% to over $12.50 in two days, amid speculations that Robinhood, a popular retail brokerage firm, would list APE on its trading platform.The rumors picked up momentum after Robinhood added Shiba Inu (SHIB), a Dogecoin-inspired meme cryptocurrency, alongside three other altcoins — Polygon (MATIC), Solana (SOL), and Compound (COMP) — for trading this Tuesday, leading to intraday gains across each asset.The next crypto to be listed on Robinhood is going to be $APE. I have no doubt about it.— David Gokhshtein (@davidgokhshtein) April 12, 2022However, Robinhood did not confirm any plans to integrate ApeCoin into its services, hinting that APE’s price gains since Tuesday might have resulted from mere speculation. Additionally, its breakout move out of the bull pennant accompanied lower volumes, suggesting a lack of upside conviction in the market.Related: Is the surge in OpenSea volume and blue-chip NFT sales an early sign of an NFT bull market?As a result, ApeCoin’s potential to invalidate its bull pennant setup cannot be ruled out as long as it breaks above a sequence of resistance levels, as shown in the chart below, with a steady rise in volumes.APE/USD daily price chart featuring Fibonacci support/resistance levels. Source: TradingViewFor instance, APE now eyes $13 as its next upside target while holding $11.50 as its interim support. Nonetheless, a break below the said price floor could have ApeCoin eye $10.25 as its next downside target.The views and opinions expressed here are solely those of the author and do not necessarily reflect the views of Cointelegraph.com. Every investment and trading move involves risk, you should conduct your own research when making a decision.

Čítaj viac

Shiba Inu price soars 35% in one day as Robinhood lists SHIB for trading

Shiba Inu (SHIB) prices soared on April 12 upon its debut on Robinhood, a U.S.-based commission-free trading platform.SHIB price climbed by more than 35% to 0.00003, its highest level in almost two months, before paring some gains. Nonetheless, SHIB was still on track to log its best daily performance since Feb. 6 when it rallied by nearly 27%.SHIB/USD daily price chart. Source: TradingViewStrong crypto revenues precede SHIB’s listingRobinhood emerged as a go-to avenue for everyday investors since the pandemic’s start in March 2020. Last year, the retail brokerage added 10 million funded accounts to its platform, with more than half of the new sign-ups coming from first-time investors.Still, it reported a net loss of $423 million in its fourth-quarter earnings of 2021, noting that its main source of revenue (payments for order flow) made $263 million compared to $267 million in the same quarter of the previous year. Meanwhile, revenues from cryptocurrency trading surged over 300% in the same period, putting Robinhood on course to introduce more crypto-related services in 2022, including a wallet and the addition of more altcoins and meme tokens to its brokerage platform.David Gokhstein, the founder of Gokhshtein Media, said the addition of SHIB to Robinhood is “a great thing” for the crypto space, noting that the cryptocurrency could help drive more users to other top coins like Bitcoin (BTC) and Ether (ETH).With the $SHIB listing on Robinhood, I’m watching the other meme tokens To see if they move. — David Gokhshtein (@davidgokhshtein) April 12, 2022What’s next for Shiba Inu?The events that led up to Shiba Inu’s massive intraday rally also include a period of strong accumulation, data from IntoTheBlock shows.The analytics platform noted the address holding SHIB for more than a year increased their balance in the past 30 days. As a result, these “hodlers” now has control over 2.82% of the net SHIB supply in circulation.Diamond Hands win$SHIB Hodlers remain unfazed and accumulated during the past weeks and it’s paying off with today’s Robinhood announcement- Addresses holding SHIB >1yr increased their balance by 57% in just 30 days- They now hold 2.82% of the supplyhttps://t.co/zAGHgiM8Qo pic.twitter.com/iwkGVVzMx9— IntoTheBlock (@intotheblock) April 12, 2022

From the technical perspective, however, Shiba Inu continues to face threats from its prevailing bearish continuation pattern.Related: Robinhood rolls out wallets to 2M waitlisted users, plans to integrate LightningNotably, SHIB has been consolidating inside a so-called symmetrical triangle since late December 2021. It formed the pattern after falling by nearly 70% decline from its October 2021 high of $0.00008894. As a general technical trading rule, SHIB should now break below its triangle to resume its bearish trend.SHIB/USD daily price chart featuring ‘symmetrical triangle’ pattern. Source: TradingViewIf SHIB falls below the triangle’s lower trendline, its next downside target comes to be at length equal to the maximum distance between the pattern’s upper and lower trendline, when measured from the breakout point. This bearish scenario puts the target for Shiba Inu below $0.00001200, down over 50% from April 12’s price.The views and opinions expressed here are solely those of the author and do not necessarily reflect the views of Cointelegraph.com. Every investment and trading move involves risk, you should conduct your own research when making a decision.

Čítaj viac

Získaj BONUS 8 € v Bitcoinoch

nakup bitcoin z karty

Registrácia Binance

Burza Binance

Aktuálne kurzy