Autor Cointelegraph By Yashu Gola

STEPN to new highs? GMT price painting first 'bull flag' toward $5 target

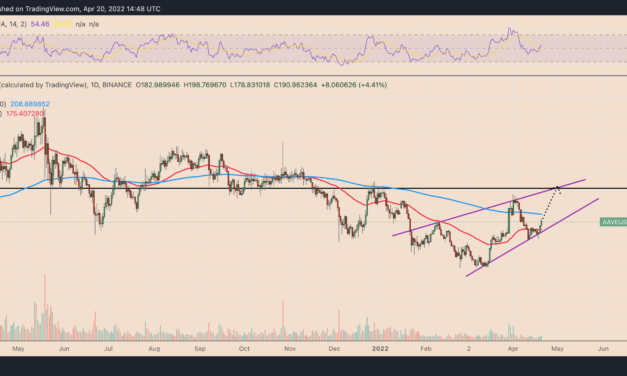
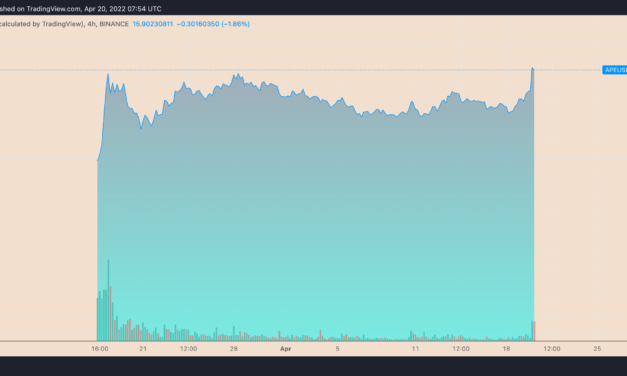
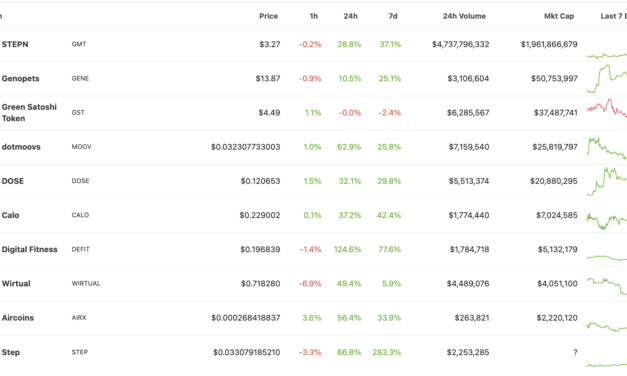
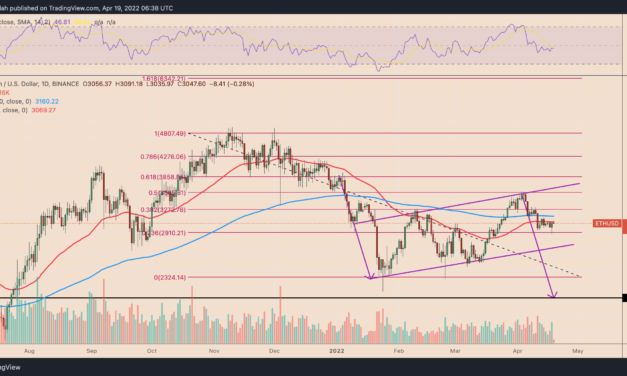
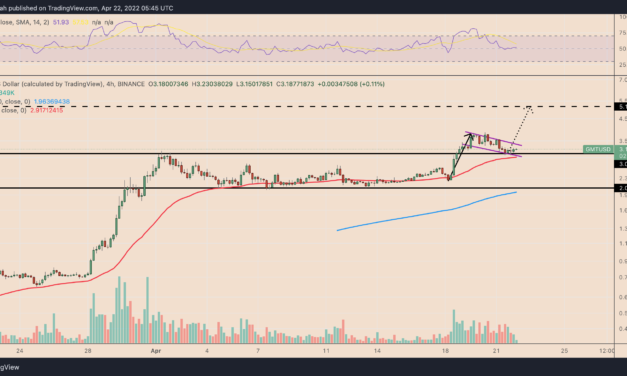
STEPN (GMT) has rallied strongly against the U.S. dollar this week as it looks likely to form a classical bullish technical pattern called the “bull flag.”GMT eyes more upsideGMT’s price rose 30% week-to-date, including a strong rally to establish an all-time high near $3.85 followed by a relatively modest correction to nearly $3. In particular, the correction phase occurred inside a descending parallel channel, raising possibilities that the price would eventually break out of it to the upside.That is precisely because traditional analysts consider strong run-ups, followed by range-trapped price corrections, as bullish continuation setups. And the one GMT has been painting — a bull flag, as mentioned above — could lead to an upside boom in the weeks ahead, as shown in the chart below.GMT/USD 4-hour price chart featuring ‘bull flag’ setup. Source: TradingViewAs a general rule, traders realize a bull flag target by measuring the previous uptrend’s height and projecting it from the breakout point. Applying the classic setup on GMT’s chart shows that it now eyes a run-up above $5, about 65% above today’s price.Bull flags’ success rate of meeting their upside targets sits near 64%, according to Thomas Bulkowski, a veteran investor and analyst.But the risk of a drop toward $2 becomes high if the GMT’s price breaks below the bull flag’s lower trendline, the last line of support, which coincides with the 50-4H exponential moving average (50-4H EMA; the red wave) at $2.91.STEPN’s 38,000% gains ‘an absolute joke’? GMT surged by nearly 38,000% in less than two months, amid the hype surrounding STEPN’s “move-to-earn” economic model that rewards its app’s users with a native currency, called Green Satoshi Token (GST), for merely moving. STEPN generates revenues (it made $26.81 million in Q1/2022) via the sales of its so-called “NFT Sneaker” — a unique digital image whose ownership enables players to earn GST in the first place. The game uses the proceeds first to buy and then burn GMT, thus creating upward pressure on its prices if the demand for the token goes up.Independent market analyst Wangarian believes the hype around STEPN looks similar to what Axie Infinity (AXS), a play-to-earn gaming metaverse, witnessed in May 2021. AXS/USD rallied from around $2.50 to about $178 between May and November last year.Tell me how $APE + $GMT ripping in a sideways market doesn’t look similar to $AXS back in May 2021.— Wangarian (@0xWangarian) April 21, 2022Fellow independent market analyst Michaël van de Poppe, however, fears that GMT’s market capitalization, which sits near $1.9 billion — with a fully diluted valuation of around $18 billion — is an “absolute joke.”But GMT “valuations can still become ridiculous,” he adds, owing to STEPN’s marketing tactics.The views and opinions expressed here are solely those of the author and do not necessarily reflect the views of Cointelegraph.com. Every investment and trading move involves risk, you should conduct your own research when making a decision.

Čítaj viac

DeFi token AAVE eyes 40% rally in May but 'bull trap' risks remain

A sharp rebound move witnessed in the Aave (AAVE) market in the last three days has raised its potential to rise further in May, a technical indicator suggests.AAVE price rebounds from key supportDubbed a “rising wedge,” the pattern appears when the price rises inside a range defined by two ascending, contracting trendlines. It typically resolves after the price breaks below the lower trendline with convincingly rising volumes.AAVE has been painting a similar ascending channel since early February 2022. The AAVE/USD pair has bounced in the past few days after testing the wedge’s lower trendline as support. This means the bulls are now eyeing the pattern’s upper trendline near $280, up over 40% from April 20’s price.AAVE/USD daily price chart. Source: TradingViewThe upside target also coincides with the level that has served as the resistance between November 2021 and January 2022. It was also instrumental in capping AAVE’s downside attempts during July-October 2021.”Bull trap” levels to watchAs noted earlier, rising wedges are considered bearish reversal patterns by many traditional analysts. It indicates that AAVE’s run-up to $280 might not transform into a full-fledged bull run. Instead, the likelihood of the token correcting lower appears higher.Moreover, AAVE’s price could also undergo an early pullback after hitting its 200-day exponential moving average (200-day EMA; the blue wave in the chart above) near $208, suggesting an imminent breakdown.As a rule, a rising wedge breakout results in the price falling to a target that is measured after adding the distance between the patterns’ upper and lower trendline to the breakout point.AAVE/USD daily price chart featuring ‘rising wedge’ breakout setup. Source: TradingViewTherefore, depending on the level at which AAVE breaks down from its rising wedge, the bearish scenario target becomes $105 and $124 by the end of Q2.Key “bull flag” levels to watch Switching to the weekly timeframe charts shows AAVE in a month-long descending channel pattern that looks like a “bull flag.”Bull flags are bullish continuation indicators that surface when the price consolidates lower inside a parallel range after a period of a strong uptrend.In theory, they resolve after the price breaks above the range’s upper trendline decisively, followed by an extended upside move equal to the height of the previous rally (called flagpole).Related: Aave v3 launch triggers 50% rally from long-term descending channel patternThe bull flag scenario now puts AAVE at risk of testing the structure’s lower trendline near $109, which coincides with its 200-week EMA. Interestingly, the level is also near the rising wedge’s interim downside target, as discussed above.AAVE/USD weekly price chart. Source: TradingViewBut the flag setup indicates that AAVE’s long-term bias is to the upside. Hence, the pair could rebound from the lower trendline to a roughly $900 bull flag target in 2022-2023, up about 400% from April 20’s price.Conversely, a decisive break below the 200-day EMA could expose AAVE to further selloffs, with the next downside target sitting near $72, a historical support/resistance level.The views and opinions expressed here are solely those of the author and do not necessarily reflect the views of Cointelegraph.com. Every investment and trading move involves risk, you should conduct your own research when making a decision.

Čítaj viac

ApeCoin: APE price climbs 55% in three days as a 'BAYC land drop' rumor goes viral

ApeCoin (APE) price has exploded higher on anticipations that it would become a de-facto payment token in an upcoming metaverse land sale.APE price swelled nearly 28% in one day to reach over $17 per token on April 20. The rally came as a part of a rebound from three-day lows under $11, resulting in a 55% gain.APE/USD four-hour price chart. Source: TradingViewBAYC land airdropA rumor circulating across social media platforms since April 18 suggested that the owners of the Bored Ape Yacht Club (BAYC) and Mutant Ape Yacht Club (MAYC) NFTs may receive virtual lands on the Yuga Labs’ much-anticipated “Otherside” metaverse platform.Alpha leak: these projects will be auto whitelisted to mint Otherside land. BAYC – airdrop (center land)MAYC – airdrop (mid land)CryptoPunks – WL (outer rim)Meebits – WL (outer rim)Cool Cats – WL (outer rim)Nouns – WL (outer rim)WoW – WL (outer rim)Toadz – WL (outer rim) pic.twitter.com/gZ5ldAdoQM— Willy ₿ullish (@WillyTheDegen) April 18, 2022Otherside will be an MMORPG game where players can employ their NFTs as native avatars or characters. A leaker investor pitch deck showed that Yuga Labs expects to earn $178 million by selling virtual lands, with APE acting as the de-facto token to process these purchases. Some BAYC NFT owners claimed that Yuga Labs would sell the Otherside virtual lands via a Dutch auction. In doing so, the firm could set the minimum bid at 600 APE, about $10,700 at today’s price.Was just sent some huge alpha re @yugalabs land drop. The sale will be a Dutch auction of some sort starting at 600 $APE. BAYC / MAYC (Airdrop) Punks, Meebits, Cool Cats, Nounz, WoW, Toadz (Auto WL) Get your $APE ready. Looks like we’re gonna need it. #BAYC #OTHERSIDE— renegademaster / guccibayc.eth (@renegademasterr) April 20, 2022

Given this potential use-case, demand for ApeCoin may grow higher, which could partially explain APE’s upside momentum in the last three days.APE undergoing bullish breakoutThe latest bout of buying in the APE spot market saw the APE/USD pair break out of a classic bullish continuation pattern.Related: How to get premium high-resolution metaverse and NFT imagesAs Cointelegraph reported earlier, breaking above the so-called “bull pennant” with decisive volumes could have ApeCoin rally above $40 in the next few months. Meanwhile, if the technical pattern turns out to be a “symmetrical triangle” instead, APE’s upside target will be near $22, according to the setup shown below. APE/USD daily price chart. Source: TradingViewApeCoin now targets the 0.236 Fib line (~$16) of the Fibonacci retracement graph, drawn from $41-swing high to $8.50-swing low, as its interim resistance. A pullback from the said price ceiling would risk sending APE toward the triangle’s top near $12.50.The views and opinions expressed here are solely those of the author and do not necessarily reflect the views of Cointelegraph.com. Every investment and trading move involves risk, you should conduct your own research when making a decision.

Čítaj viac

Solana's STEPN hits record high as GMT price skyrockets 34,000% in over a month

STEPN (GMT), a so-called “move-to-earn” token using the Solana (SOL) blockchain, has soared incredibly since its market debut in March.GMT’s price jumped from $0.01 on March 9 to a record high of $3.45 on April 19 — a 34,000% upside move in just 41 days (data from Binance). Its massive uptrend appeared primarily due to the hype surrounding decentralized finance (DeFi) projects that reward users in tokens for staying active.For instance, the prices of GMT and its top rivals, including Genopets (GENE) and dotmoovs (MOOV), exploded massively on a 24-hour adjusted timeframe, data on CoinGecko shows. Nonetheless, STEPN remained the most valuable move-to-earn (M2E) project, with its market capitalization closing in on $2 billion. The performance of M2E tokens featuring GMT. Source: TradingViewWhat’s pumping GMT?One major cue behind the GMT’s price rally comes from STEPN’s recent earnings report. Notably, the project made a profit of over $26.81 million from “royalty fees” and the sale of its “NFT Sneakers” in the first quarter of 2022, official data shows.In detail, buying NFT Sneakers enables users to play STEPN, which, in turn, allows them to earn its in-game token, called the Green Satoshi Token (GST). Later, traders can exchange their GST rewards for SOL or USD Coin (USDC).You can earn $5 for every Kilometre you run using $STEPNI bought 20 pairs of shoes that I’m starting to rent out for free to other application usersI get 50% of the rewards from the shoes meaning passively per day i can earn $250 from 20 people running and walking 5km!— That Martini Guy ₿ (@MartiniGuyYT) April 18, 2022STEPN uses its profits to first buyback GMT, its governance token, from secondary markets (exchanges, over-the-counter platforms, etc.) and then burn them on-chain, effectively removing them from circulation out of the 600 million GMT in total. Technicals signal overboughtThe latest bout of buying in the GMT market has made the token overbought, according to its four-hour relative strength index (RSI) reading, which sits above 70 — a sell signal.GMT/USD four-hour price chart. Source: TradingViewRelated: Move-to-earn: An active play-to-earn offshootTechnically, GMT/USD is now testing its previous record high of $3.14 as its interim support. A move below the level raises the pair’s potential of running down towards its 50-day exponential moving average (50-day EMA; the red wave) near $2.52, about 20% below April 19’s price.The views and opinions expressed here are solely those of the author and do not necessarily reflect the views of Cointelegraph.com. Every investment and trading move involves risk, you should conduct your own research when making a decision.

Čítaj viac

Ethereum price 'bear flag' could sink ETH to $2K after 20% decline in three weeks

Ethereum’s native token Ether (ETH) has dropped by nearly 20% in the last three weeks, hitting monthly lows near $2,900 on April 19. But despite rebounding above $3,000 since, technicals suggest more downside is possible in the near term, according to a classic bearish pattern.Ethereum price ‘bear flag’ setup activatedDubbed “bear flag,” the bearish continuation signal appears as the price consolidates higher inside an ascending parallel channel after a strong downward move (called the flagpole). It resolves after the price breaks out of the channel to drop further.ETH’s price turned lower after testing its bear flag’s upper trendline on April 4 and now eyes an extended decline towards its lower trendline near $2,700. If the pattern pans out as intended, the price could drop further, with its target at length equal to the flagpole’s height, as shown in the chart below.ETH/USD daily price chart featuring ‘bear flag’ setup. Source: TradingViewAs a result, Ether’s bear flag setup risks a potential retest of $2,000 in the second quarter. ETH price: macro factorsEthereum’s correlation with Bitcoin and the areas of traditional markets have also increased its downside risks in recent months. For instance, the correlation coefficient between Ether and Nasdaq 100 was 0.95 this April 19. A coefficient of 1 means that the two assets move in perfect tandem.ETH/USD and Nasdaq 100 correlation coefficient on daily chart. Source: TradingView Ether price is down by nearly 19% since the start of 2022. Meanwhile, Bitcoin, stock and other riskier markets have also fallen this year as investors assess the Federal Reserve’s willingness to aggressively raise rates and reduce its $9 trillion balance sheet.Longer-term bullish factorsMore or less, ETH’s fall comes primarily due to sentiments that there would be less cash available to purchase riskier assets. Related: Here’s how Ether options traders could prepare for the proof-of-stake migrationNonetheless, speculators remain hopeful about a long-term uptrend due to its much-anticipated protocol upgrade called “the Merge,” likely to be released after June.”ETH is still experiencing selling pressure from the people that wanted to make a quick buck on the Merge,” noted DoopleCash, an independent market analyst, adding: “At some moment in time we will find equilibrium, I’m not interested in predicting this bottom, I just want to accumulate as much as I can before we get there.”Additionally, the months running up to the technical update have coincided with a downtrend of Ether held by exchanges, the number of non-zero ETH addressees climbing, and more ETH flowing into the Merge’s official smart contract. At -2.8% supply growth a year post Merge, #ethereum will see about 3.3 million ETH a year burned. By the end of the decade total ETH supply will drop under 100 million. Or put another way, we will burn the equivalent of ALL ETH currently sitting on exchanges!!!! pic.twitter.com/zqr54TGCzC— Lark Davis (@TheCryptoLark) April 6, 2022Kennan Mell, an analyst at Seeking Alpha, argues that Ethereum’s style of running shadow forks ahead of the Merge launch increases the update’s possibility to become successful upon launch. This should influence more investors, especially those that are waiting on the sidelines, to accumulate Ether in the long run. The views and opinions expressed here are solely those of the author and do not necessarily reflect the views of Cointelegraph.com. Every investment and trading move involves risk, you should conduct your own research when making a decision.

Čítaj viac

Získaj BONUS 8 € v Bitcoinoch

nakup bitcoin z karty

Registrácia Binance

Burza Binance

Aktuálne kurzy