Autor Cointelegraph By Yashu Gola

STEPN move-to-earn tokens GMT, GST hit new highs after Coinbase listing announcement

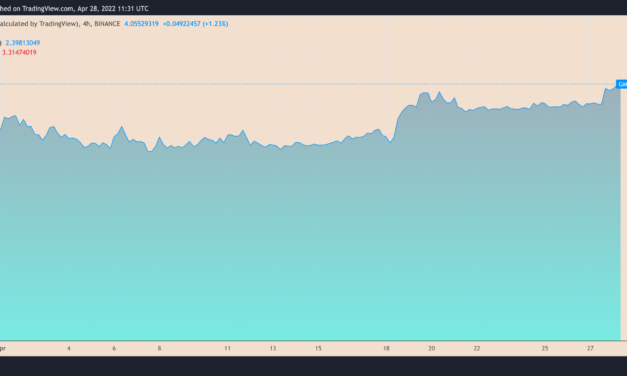
The native tokens of move-to-earn lifestyle app STEPN swung higher on news that they would be available to trade on Coinbase, a U.S.-based crypto exchange.The price of STEPN’s governance token Green Metaverse Token (GMT) rallied by nearly 20% to reach over $4 in the past 24 hours, hitting as high as $4.50, its best level to date.GMT/USD four-hour price chart. Source: TradingViewSimilarly, the other STEPN token, called the Green Satoshi Token (GST), which players earn after walking, jogging and running outdoors with STEPN’s “NFT Sneakers,” gained 6.5% to about $6.25 on a 24-hour adjusted timeframe with a new record high of $7.20. STEPN ecosystem growsThe intraday rallies in GMT and GST markets are part of a broader uptrend that started in early March 2022. The growing hype around the so-called move-to-earn industry is boosting the value of these tokens, which are rewarded to active players.Move-To-Earn Token FITFI on Avalanche has achieved a 50x increase over the price of DAOMaker IDO ($0.0049) after it was launched on OKX and Bybit today. The public offering will release 10% after the launch. The mechanism is similar to Stepn. https://t.co/KVRVb1kDvL— Wu Blockchain (@WuBlockchain) April 26, 2022In particular, STEPN’s economic model, which involves selling nonfungible token (NFT) shoes and using the proceeds to buy back and burn GMT tokens, likely attracted speculators that see a lower supply-higher demand structure as bullish. GMT comes with a supply cap of 6 billion.Stepn $GMT nearly 2x since last tweet. Up 40x since first mention. I’m up a lot and Stepn app makes me money too. What a great investment https://t.co/CgheKBoMib— MURO – won’t DM, beware of scam (@MuroCrypto) April 28, 2022

Meanwhile, GST, which comes with an unlimited supply cap, finds bullish cues from its underlying use-cases. Notably, STEPN players use the token to mint, repair and level up their NFT sneakers — or even sell them on the app’s marketplace. As a result, if the number of STEPN users increases, it could lead to players limiting GST’s downside prospects by using it as an in-game currency.Players have already been sharing screenshots of their STEPN profiles, which feature their physical activities and the GST rewards they earned for doing them. Meanwhile, leading NFT marketplace OpenSea has added STEPN’s sneakers collection, providing more avenues for STEPN NFT owners to resell their digital shoes. How do I get a $STEPN activation code?— KSICRYPTO (@ksicrypto) April 27, 2022

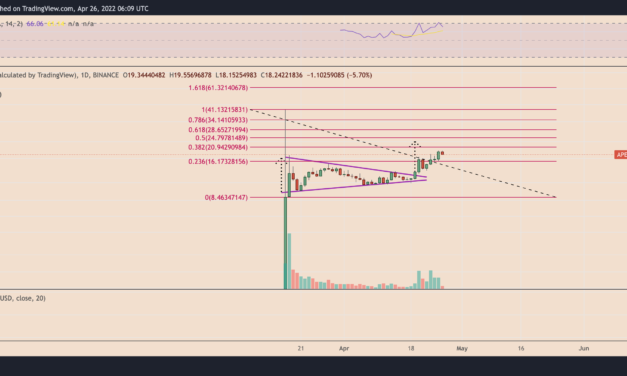
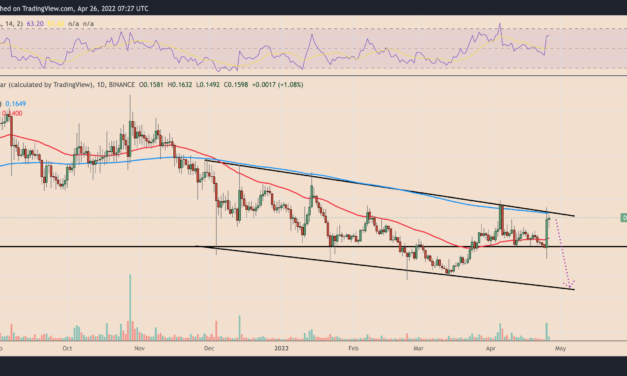
The hype for move-to-earn tokens appears similar play-to-earn projects such as Axie Infinity (AXS), which skyrocketed last year. GMT ascending triangleGMT’s price eyes a return to $4.50 ahead of this week’s close, based on the “ascending triangle” setup on its shorter-timeframe charts, as shown below.GMT/USD hourly price chart featuring ‘ascending triangle’ setup. Source: TradingViewAscending triangles appear when the price consolidates between a horizontal upper trendline and a rising lower trendline. They resolve after the price breaks out in the direction of its previous trend, and rise by as much as the maximum distance between the triangle’s upper and lower trendline.Related: STEPN to new highs? GMT price painting first ‘bull flag’ toward $5 targetInterestingly, the triangle’s upside target near $4.50 also coincides with the 1.618 Fib line of the Fibonacci retracement graph drawn from $3.82-swing high to $2.75-swing low. GST descending triangleUnlike GMT, GST is showing signs of breakdown as it forms a descending triangle pattern after topping out at $7.20.GST’s price has been trending lower between a falling upper trendline and a horizontal lower trendline, which is considered bearish reversal after a strong uptrend. That said, the STEPN token now risks breaking below the triangle’s lower trendline, as illustrated below.GST/USD hourly price chart featuring ‘descending triangle’ setup. Source: TradingViewIf this occurs, GST’s price will risk falling by as much as the triangle’s maximum height when measured from the breakdown point, resulting in the bearish target of $6.The views and opinions expressed here are solely those of the author and do not necessarily reflect the views of Cointelegraph.com. Every investment and trading move involves risk, you should conduct your own research when making a decision.

Čítaj viac

ApeCoin price breakout stalls after $2.4M BAYC NFT robbery — What's ahead?

ApeCoin (APE) underwent a modest selloff a day after the Bored Ape Yacht Club (BAYC), a popular nonfungible token (NFT) brand, reported losing $2.4 million worth of digital collectibles in a robbery.APE price rally to $25 stallsThe hacker compromised BAYC’s official Instagram account, using it to post a phishing link that withdrew tokens out of users’ cryptocurrency wallets. On April 25, the BAYC Twitter handle confirmed the hack, albeit too late as users had already transferred tokens to the hacker’s account, thus losing ownership of their extremely expensive Bored Ape, Mutant Ape and Bored Ape Kennel Project NFTs.annnd there goes like 100 apes to the hacker https://t.co/X2ts0mncTt pic.twitter.com/1tU2MVlpxU— cool guy moon (@MoonOverlord) April 25, 2022OpenSea, the biggest NFT marketplace by volume and earnings, tagged the stolen NFTs as suspicious. But even then, the hacker ended up selling four BAYC collectibles for about $1.6 million.APE, which serves as a governance token to BAYC’s decentralized autonomous organization ApeCoin DAO, dropped by nearly 11% to $17.41 this April 26. As it fell, the token also deviated from the upside target of its prevailing “symmetrical triangle” pattern around $25, as shown in the chart below.APE/USD daily price chart featuring ‘symmetrical triangle’ setup. Source: TradingViewThe correction confirmed strong bearish sentiments around $20, a level that coincides with the 0.382 Fib line of the Fibonacci retracement graph, drawn from the $41-swing high to the $8.50-swing low. This raised the possibility of APE extending its correction toward the 0.236 Fib line near $16 in the medium term.Rising wedge risks further APE selloffMore downside cues in the ApeCoin appeared in the form of a “rising wedge” pattern.In detail, rising wedges form when the price trends higher inside a range defined by two contracting, ascending trendlines. These patterns typically resolve after the price breaks below the lower trendline alongside a rise in trading volumes.Related: What are the top 3 trending altcoins to buy in 2022 | Find out now on The Market ReportApeCoin has been forming a similar ascending structure since April 2022, as shown in the chart below. APE/USD four-hour price chart featuring rising wedge setup. Source: TradingViewA rising wedge’s breakdown target is measured after adding the maximum distance between the upper and lower trendlines to the breakout point. Therefore, APE’s downside target for Q2 is between $14.37 and $17.50.The views and opinions expressed here are solely those of the author and do not necessarily reflect the views of Cointelegraph.com. Every investment and trading move involves risk, you should conduct your own research when making a decision.

Čítaj viac

Dogecoin price risks 40% correction despite Elon Musk-Twitter euphoria

Dogecoin (DOGE) prices flipped higher in the last 24 hours after its most celebrated backer, Elon Musk, purchased Twitter for $44 billion. At its best, Dogecoin had climbed to $0.17 on April 25, albeit still down 77% from its record high in May 2021.Twitter’s native currency: Dogecoin?DOGE’s price rose by nearly 25% to $0.15 on a 24-hour adjusted timeframe, confirming that traders considered Musk’s acquisition of Twitter a bullish event for Dogecoin. The reason: Musk’s long-time support for DOGE, including his recent advice to the Twitter board that they should start accepting the memecoin for Twitter Blue, their first-ever subscription service.The comments appeared a year after Twitter revealed that it plans to double its revenues to $7.5 billion by the end of 2023, raising hopes that Musk’s 100% ownership of the company would have it facilitate its future sales through an additional DOGE payment option.Elon acquires Twitter — > $DOGE becomes the currency of Twitter — > $1 $DOGE no longer a meme! How does that sound ?— Limbo (@CryptoLimbo_) April 25, 2022In January, Musk’s flagship company Tesla Motors started accepting Dogecoin, and only DOGE, for some of its merchandise.Related: What Elon Musk’s investment could mean for Twitter’s crypto plansDOGE price correction risksNevertheless, Dogecoin faces interim selloff risks following its impressive gains in the past 24 hours.DOGE’s price started correcting lower after re-testing a multi-month downward sloping trendline as resistance. Interestingly, the line constitutes a descending channel pattern, which raised the possibility of DOGE extending its pullback move by another 35%-40% by the end of Q2, as illustrated in the chart below.DOGE/USD daily price chart featuring ‘descending channel’ setup. Source: TradingViewThe selloff risks toward the channel’s lower trendline also remain elevated due to the 200-day exponential moving average (EMA) wave near $0.16, which has been capping Dogecoin’s upside attempts since November 2021. DOGE/USD daily price chart featuring Fib S/R levels. Source: TradingViewConversely, a strong upside continuation above the channel’s upper trendline and the 200-day EMA would position DOGE’s price for a test of $0.20 in Q2. This key level also coincides with the 0.382 Fib line of the Fibonacci retracement graph, drawn from the $0.35-swing high to the $0.10-swing low.The views and opinions expressed here are solely those of the author and do not necessarily reflect the views of Cointelegraph.com. Every investment and trading move involves risk, you should conduct your own research when making a decision.

Čítaj viac

Could XRP price lose another 70% by Q3?

XRP continued its correction trend on April 25, falling by 5.5% to reach $0.64, its lowest level since Feb. 28.More XRP price downside ahead?The plunge increased the possibility of triggering a bearish reversal setup called descending triangle. While these patterns form usually during a downtrend, their occurrences following strong bullish moves usually mark the end of the uptrend.XRP has been in a similar trading channel since April 2022, bounded by two trendlines: a lower horizontal and an upper downward sloping. The pattern now nears its resolve as XRP pulls back toward the support trendline that’s also coinciding with the 50-week exponential moving average (50-week EMA; the blue wave), five weeks after testing the upper trendline as resistance.XRP/USD weekly price chart. Source: TradingViewIf a breakdown occurs below the triangle’s lower trendline, coupled with increased volumes, XRP’s price could fall to the level that is at the length equal to the maximum distance between the structure’s upper and lower trendline, as shown in the chart above. That would put XRP en route towards $0.19, about 70% lower than today’s price.Bitcoin price correlation The bearish outlook for XRP comes majorly in the wake of a similar selloff happening across Bitcoin (BTC), Ether (ETH), and the rest of the crypto market. The correlation between Bitcoin and XRP was 0.84 this April 25. A perfect score of 1 indicates that the two assets move perfectly in sync with one another.XRP/USD correlation efficiency with BTC/USD. Source: TradingViewFurthermore, Bitcoin could fall to its January lows below $33,000, asserts Mark Newton, a technical strategist at Fundstrat. BTC’s initial pullback to $36,300 “should lead to a full retest of $32,950 without too much trouble,” he added. Related: ‘Something sure feels like it’s about to break’ — 5 things to know in Bitcoin this weekAs a result of its positive correlation with Bitcoin, XRP could therefore decline further to trigger its descending triangle breakdown setup.The views and opinions expressed here are solely those of the author and do not necessarily reflect the views of Cointelegraph.com. Every investment and trading move involves risk, you should conduct your own research when making a decision.

Čítaj viac

Monero 'falling wedge' breakout positions XMR price for 75% rally

Monero (XMR) price dropped by nearly 10% three days after establishing a week-to-date high around $290 on April 24. Nonetheless, several technical indicators suggest that the XMR/USD pair is poised to resume its uptrend over the next few months.Falling wedge breakout underwayNotably, XMR’s price broke out of its “falling wedge” structure in late March. It continued its move upside in the later daily sessions, with rising volumes indicating bullish sentiment among Monero traders.Traditional analysts consider falling wedges as bullish reversal patterns, i.e., the price first consolidates within a contracting, descending channel, followed by a strong bounce to the upside. As a rule, the falling wedge’s breakout target comes to be near the level at length equal to the maximum distance between the pattern’s lower and upper trendline.XMR/USD weekly price chart featuring ‘falling wedge’ breakout setup. Source: TradingViewThe XMR’s falling wedge is up to nearly $250-long. Meanwhile, the structure’s breakout point sits around $210. As a result of this, the Monero token’s upside target comes to be near $470, up more than 75% from today’s price.Nevertheless, XMR still needs to close above $300, a psychological resistance level, to confirm its move toward the falling wedge target.Monero hard fork aheadXMR’s bullish outlook also appears in the months leading up to Monero’s hard fork.Notably, Monero will undergo a tentative protocol upgrade in July, preceding a testnet deployment in May. The update aims to increase the ring size from 11 to 16 to ensure that XMR transactions have a larger anonymity set to make it harder to find the transaction source.#Monero has a network upgrade (hardfork) on July 16th 2022 at block 2668888.Privacy and performance will be improved! The update includes: Ring sizes will increase from 11 to 16 View tags to speedup wallet/node syncMultisig fixesBulletproof++more!#xmr $xmr pic.twitter.com/jZ5ouk1uqo— John Foss (@johnfoss69) April 17, 2022The hard fork announcement has appeared against the backdrop of rising demand for privacy coins amid geopolitical and economic turmoil.Top 10 privacy coin performers in the last seven days. Source: MessariShort-term correction risksXMR’s strong fundamentals underpin its bullish wedge setup. Nonetheless, Monero is also at risk of retracement in the short-term.XMR/USD daily price chart. Source: TradingViewXMR has corrected lower after testing $278 repeatedly as resistance in the last three days, raising the possibility that it could continue lower. This would present the next downside target appears near $227, coinciding with the 0.236 Fib line of the Fibonacci retracement graph, drawn from $493-swing high to $145-swing low.Related: Monero’s crypto of choice as ransomware ‘double extortion’ attacks increase 500%Conversely, a decisive move above $278 could have XMR test $320 — the 0.5 Fib line — as its interim upside target.The views and opinions expressed here are solely those of the author and do not necessarily reflect the views of Cointelegraph.com. Every investment and trading move involves risk, you should conduct your own research when making a decision.

Čítaj viac

Získaj BONUS 8 € v Bitcoinoch

nakup bitcoin z karty

Registrácia Binance

Burza Binance

Aktuálne kurzy