Autor Cointelegraph By Yashu Gola

Avalanche rebounds 25% in five days as AVAX price tests key level — big rally ahead?

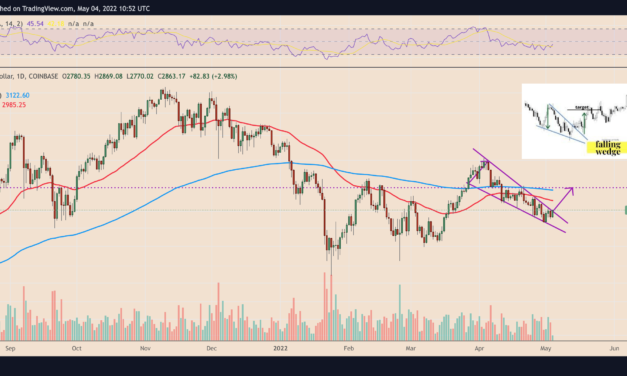
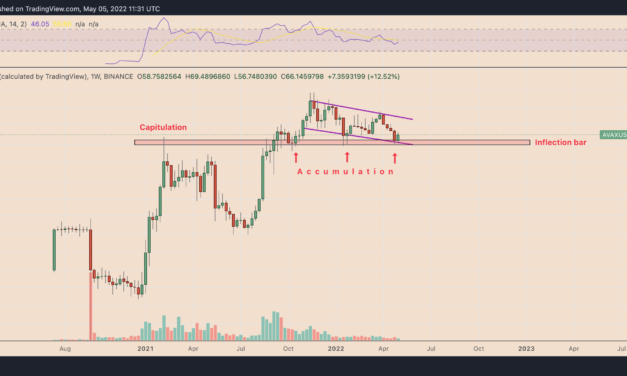
Avalanche (AVAX) has rebounded strongly five days after testing a key inflection area as its support. Now, the AVAX/USD pair faces the possibility of continuing its upside retracement move further into Q2.A 30%-plus move ahead?AVAX’s price surged to almost $69.50 on May 5 from nearly $55 on April 30, a 25% jump. Interestingly, AVAX’s rebound move surfaced inside the same support area ($54-60 range) that had preceded a 100% and a 175% price rally in the January 2022-April 2022 and the October 2021-November 2021 session, respectively.AVAX/USD weekly price chart. Source: TradingViewAdditionally, the lower trendline of the AVAX’s prevailing descending channel pattern (possibly a “bull flag”) served as support. That raised the Avalanche token’s potential to extend its rebound move towards the channel’s upper trendline near $90, up almost 35% from today’s price.Valkyrie launches AVAX fundAVAX’s price rally also coincided with similar upside moves elsewhere in the crypto market, in part due to Federal Reserve’s announcement on May 4 to hike interest rates by 0.5% against the widely-anticipated 0.75%.AVAX is up by about 20% when measured from its May 4’s lows near $59. Interestingly, its gains turned out to be higher than its top rivaling assets, including Bitcoin (BTC), Ethereum (ETH), and Polkadot (DOT). That could be due to Valkyrie.The Tennessee-based crypto investment firm announced on May 4 that it is launching an Avalanche Trust (VAVAX) for accredited investors. It set the minimum investment at $25,000 and, according to sources, has already attracted $25 million to its vaults.We’re excited to partner with @avalancheavax to launch the Valkyrie Avalanche Trust today! Gain secure access to $AVAX within the ease of a trust vehicle.Learn more below pic.twitter.com/UvpnDId0ln— Valkyrie (@ValkyrieFunds) May 4, 2022The launch comes after Avalanche saw uptrends in key metrics, including usage and revenue generation. In detail, the network’s average daily transactions nearly doubled in Q1/2022 (+82.8%) compared to the previous quarter, while its total income grew by 72.7% in the same timeframe, reports Messari researcher James Trautman.Avalanche network value and cumulative revenue during Q1. Source: MessariThe analyst further highlighted that Avalanche’s revenue growth could put “upward pressures” on AVAX’s market value, given its proof-of-stake network burns 100% of fees (derived in AVAX), and thus lowers the total supply in circulation. Related: The birth of ‘Ethereum killers’: Can they take Ethereum’s throne?”This drives value to all token holders through increased scarcity rather than compounding the balances of validators and delegators,” Trautman wrote, adding:”The question is just how statistically significant the spread between revenue and market value is […] As fundamental value (as opposed to speculative value) becomes a more substantial part of market value, a strong correlation between revenue and market value should theoretically exist.”The views and opinions expressed here are solely those of the author and do not necessarily reflect the views of Cointelegraph.com. Every investment and trading move involves risk, you should conduct your own research when making a decision.

Čítaj viac

DOT rallies 12% in a day as Polkadot gears up to solve a major blockchain hacking problem

Polkadot (DOT) price ticked higher in the past 24 hours on anticipations that its new cross-chain communications protocol would solve a long-standing problem in the blockchain sector.DOT price gains 12% on XCM launchBulls pushed DOT’s price to $16.44 on May 5 from $14.72 a day before, gaining a little over 12% as they assessed the launch of XCM, a messaging system that allows parachains — individual blockchains that operate in parallel inside the Polkadot ecosystem — to communicate with each other.DOT/USD daily price chart. Source: TradingViewAs Cointelegraph reported, future updates in the XCM protocol would see parachains exchanging messages without relying on Polkadot’s central blockchain, the Relay Chain. That expects to eliminate bridge hacks that have cost the industry more than $1 billion in a year.Other bullish catalystsDOT’s gains also appeared in line with similar upside moves elsewhere in the cryptocurrency market.For instance, Bitcoin (BTC) rallied nearly 6% in the same period DOT climbed 12% with their correlation coefficient at 0.87 as of May 5, suggesting that BTC and DOT’s prices are moving almost in lockstep in recent days.DOT/USD and BTC/USD correlation coefficient. Source: TradingViewThe crypto market gained after Federal Reserve clarified that it would not increase benchmark rates by a 75 basis point, as propagated by one of its presidents, James Bullard, in April 2022. The S&P 500 index, too, rallied by nearly 3%, and bond yields fell.Nonetheless, the U.S. central bank remained on its path to cutting interest rates, hoping to get near the 2-3% “neutral” while preparing for a “softish” landing, i.e., curbing inflation without overly impacting the U.S. economic growth. On May 4, it began with a 50 bps cut, with chairman Jerome Powell promising more 0.5% increments.BTC/USD daily price chart. Source: TradingViewAs a result of this hawkish tone, Bitcoin’s current price rebound could fizzle out once more short of $40,000, taking down the rest of the crypto market with it, DOT included.Polkadot price risks 35% decline Polkadot technicals put it at risk of a correction in the short term as it breaks below a head-and-shoulders (H&S) pattern.H&S patterns appear when the price forms three peaks while gaining support from a common support level, called a neckline. Meanwhile, the middle peak (head) comes to be taller than the other two (left and right shoulder), which are more or less of same heights.H&S typically resolve after the price breaks below its neckline. As a rule of technical analysis, a H&S breakdown sends the price to level at a length equal to the maximum distance between the head’s peak and neckline. Related: Bitcoin trader keeps $40.8K BTC price target amid warning over risk asset ‘pain trade’DOT is in the breakdown stage of its prevailing H&S setup, with its recent bounce testing the neckline as support to reconfirm the bearish pattern. Meanwhile, the neckline area coincides with the 50-day exponential moving average (50-day EMA; the red wave in the chart below) at $18.20, which sets up a potential pullback scenario following the next upside attempt.DOT/USD daily price chart featuring H&S setup. Source: TradingViewPolkadot’s H&S downside target is near $11 if the breakdown continues, almost 35% lower than today’s price. Conversely, a decisive breakout above the neckline area and the 50-day EMA would have DOT eye its 200-day EMA (the blue wave) near $22.75 as the upside target.The views and opinions expressed here are solely those of the author and do not necessarily reflect the views of Cointelegraph.com. Every investment and trading move involves risk, you should conduct your own research when making a decision.

Čítaj viac

Ethereum eyes mini breakout above $3K as Coinbase ETH outflows hit new record

Ethereum’s native token Ether (ETH) is poised for a mini bull run above $3,000 primarily due to a classic bullish reversal pattern on its shorter-timeframe chart, and a huge spike in ETH outflows from Coinbase.ETH price forming falling wedgeETH’s price has been forming a falling wedge pattern since late March 2022, which raises its prospects of undergoing a breakout move in May.Falling wedges appear when the price trends lower inside a range defined by two descending, contracting trendlines. As a rule of technical analysis, these wedges resolve after the price breaks out of their range to the upside and rises to a level at length equal to the maximum distance between the pattern’s upper and lower trendline when measured from the breakout point.ETH/USD daily price chart featuring falling wedge setup. Source: TradingViewThe maximum falling wedge height is around $395. Suppose ETH’s price closes above $2,850, the potential breakout point, accompanied by an increase in trading volume, its likelihood of rising by another $395 (toward $3,150) will be higher.Coinbase ETH outflows hit all-time highThe interim upside outlook in the Ether market coincides with bullish on-chain data.Notably, the number of ETH leaving Coinbase, the second-largest crypto exchange by volume, reached its highest level on May 3, data from CryptoQuant shows.$ETH Coinbase Outflow hits an all-time-highLive Chart https://t.co/PiITw2ZFf3 pic.twitter.com/tlFQndUhvQ— CryptoQuant.com (@cryptoquant_com) May 4, 2022Simultaneously, the ETH balance on all the crypto exchanges fell on May 3 to its lowest level since August 2018, according to one of Glassnode’s on-chain metrics.Ethereum balance on exchanges. Source: GlassnodeBoth indicators imply a surge in traders’ preference to hold Ethereum tokens over trading them for other assets. They also coincide with a recent recovery in the upside sentiment of small Ether traders, namely an increase in the number of addresses that have a minimum balance of 0.1 ETH, 1 ETH and 10 ETH.Ethereum number of addresses with balance ≥ 0.1 ETH, 1 ETH, and 10 ETH. Source: GlassnodeThe Ethereum balances tick higher across the retail addresses as Ether’s price trends lower, indicating that traders have been buying ETH at local lows. That further supports the falling wedge’s bullish reversal setup.Bearish long-term prospectsEther’s likelihood of crossing the $3,000-level has not plucked it out of its prevailing, long-term bearish setup, however. As Cointelegraph covered earlier, ETH risks breaking below its ascending triangle range in Q2/2022 with its downside target sitting anywhere between $1,820 and around $2,670, depending on the breakout point.ETH/USD daily price chart featuring ‘ascending triangle’ setup. Source: TradingViewAdditional downside cues come from macro fronts, with Ethereum — like its top rival Bitcoin (BTC) — still holding its positive correlation with U.S. stocks in a sign that it would tail the traditional markets downward due to a common factor: a hawkish Federal Reserve. ETH/USD and S&P500 correlation coefficient. Source: TradingViewThe U.S. central bank will release a policy statement on May 4 at 2 pm EST, followed by chairman Jerome Powell’s press conference at 2:30 pm EST. Officials have signaled that they would increase benchmark rates by 0.5% and approve plans to unwind their $9-trillion asset portfolio.Related: Smart money is accumulating ETH even as traders warn of a drop to $2.4KResearchers from Strategas Research Partners and Morgan Stanley anticipate that the U.S. benchmark index, the S&P 500, will decline by another 15-16% into 2022, reports Bloomberg. As a result of its consistent positive correlation, ETH also faces similar downside prospects this year.The views and opinions expressed here are solely those of the author and do not necessarily reflect the views of Cointelegraph.com. Every investment and trading move involves risk, you should conduct your own research when making a decision.

Čítaj viac

ALGO price in danger of 25% correction despite Algorand–FIFA partnership hype

Algorand (ALGO) prices rallied higher on May 3 after becoming FIFA’s official blockchain solution provider. Nonetheless, the ALGO/USD pair continues to face selloff risks.High-profile partnershipALGO’s price jumped 20% to $0.74, its highest level since April 22. Its move upside came as a part of a broader rebound that started April 30, gaining 37.5% in just three days of trading.ALGO/USD daily price chart. Source: TradingViewAs visible in the chart above, a large portion of the ALGO’s upside move took cues from the FIFA’s announcement. Late Monday, the official football governing body revealed that it had teamed up with Algorand to develop its “digital assets strategy,” beginning with a wallet solution.It also confirmed making Algorand its “regional supporter” in North America and Europe during the next football World Cup in Qatar in November and a FIFA Women’s World Cup Australia and New Zealand 2023™ Official Sponsor. Just bought some more #algorand to celebrate the fifa news. Transferred to my wallet. Before I could even open the pera app is was already there. Smoothest blockchain I’ve been apart of. Algorand in the future.— Chris (@chris__aoki) May 3, 2022The ALGO token is a native cryptocurrency within the Algorand blockchain ecosystem, incentivizing network participation and power transactions or state changes.3.5 Billion people watched the 2018 #FIFA World Cup, with over 1 Billion tuning in to the final match. The most watched Super Bowl ever drew 114 Million viewers. Algorand is the first new American sponsor since 2011. $Algo #Algorand ⚽️ https://t.co/MKpEhiyEKP— vanbrooks.algo (@Royal0ui) May 2, 2022

ALGO price fails to break key resistanceThe latest bout of buying in the Algorand market showed signs of faltering as ALGO reached a critical resistance confluence.ALGO’s price corrected by nearly 8% after hitting its intraday high near $0.74. Interestingly, the peak level is close to the token’s 50-day exponential moving average (50-day EMA; the red wave in the chart below) and a support-turned-resistance area.ALGO/USD daily price chart featuring resistance confluence. Source: TradingViewRelated: Institutional investment flows out of ETH and into competing L1 altcoinsAdditionally, the $0.74-level also coincided with the upper trendline of a descending channel pattern, raising ALGO’s possibility of undergoing a pullback move toward the channel’s lower trendline (near $0.50 or lower) in Q2.ALGO/USD daily price chart featuring breakout setup. Source: TradingViewConversely, a break above the resistance confluence could have ALGO eye a run-up toward $1, which coincides with the 0.236 Fib line of the Fibonacci retracement graph, drawn from the $2.38-swing high to $0.56-swing low and the token’s 200-day EMA (the blue wave in the chart above).The views and opinions expressed here are solely those of the author and do not necessarily reflect the views of Cointelegraph.com. Every investment and trading move involves risk, you should conduct your own research when making a decision.

Čítaj viac

Cardano price drops to level that sparked a 65% ADA rally in March — will history repeat?

Cardano (ADA) price has been rebounding after falling to the worst levels since February 2021. Meanwhile, a technical fractal suggests that ADA’s upside retracement could continue in the coming weeks.Can ADA price extend the recovery?ADA’s price has started bouncing after testing the same support area that preceded a 65% bull run in March 2022. Specifically, ADA/USD witnessed a bullish rejection as its price fell below $0.75 on Feb. 24, a move that followed a short period of sideways consolidation. It later broke out of the flat price range, rising to $1.24 on March 26, indicating a strong buying sentiment near the area around the $0.75-level (the red bar in the chart below).ADA/USD three-day price chart. Source: TradingViewThe March 2022 fractal also showed ADA’s three-day relative strength index (RSI) treading near its oversold threshold of 30. The momentum indicator has returned to near the same level as ADA consolidates inside the flat range.As a result of this fractal, Cardano eyes a sharp rebound from $0.75 in May 2022, with its interim upside target around $1, a level that coincides with the upper trendline of ADA’s prevailing descending channel pattern.ADA/USD three-day price chart featuring rebound target. Source: TradingViewConversely, a break below the $0.75-level, accompanied by an increase in volume, could have ADA test the descending channel’s lower trendline as its next downside target (near $0.55).ADA whales buying the dipCardano can also undergo a sharp rebound because of strong accumulation sentiment.Notably, Cardano’s richest investors, or “whales” that hold between 1 million ADA and 10 million ADA — have added 196 million ADA (worth $147 million at today’s price) to their addresses in the past five weeks, on-chain data from Santiment shows.Cardano 1M to 10M ADA whales supply. Source: SantimentThe accumulation sentiment grows as ADA trades near its 15-month lows, suggesting that investors have been buying the dip in anticipation of a sharp rebound. Earlier, a distribution phase witnessed across whale addresses between December 2021 and March 2022 coincided with ADA price dropping from $1.75 to around $0.75.”Basho” factorThe Digital Trend, a pseudonymous analyst at Seeking Alpha, anticipates Cardano to continue heading lower in the next three-four months, primarily due to its correlation with the rest of the crypto market that risks correction due to macroeconomic factors.Related: 400 new projects and 100K new wallets in a month on CardanoNonetheless, the analyst noted that ADA’s price would rebound to a new all-time high in the days leading to “Basho,” Cardano’s next technical upgrade that promises to bring greater scalability.”ADA’s price has always rallied strongly leading up to the update,” he explained, adding: “In the months leading up to Shelley, ADA went from $0.02 to $0.15. Between Shelley and Goguen, ADA also appreciated significantly, and we see nothing but green in the months leading up to the upgrade.”ADA/USD daily price chart featuring key technical upgrades. Source: TradingViewThe Basho update will go live sometime in 2022 or early 2023, according to Cardano’s roadmap.The views and opinions expressed here are solely those of the author and do not necessarily reflect the views of Cointelegraph.com. Every investment and trading move involves risk, you should conduct your own research when making a decision.

Čítaj viac

Získaj BONUS 8 € v Bitcoinoch

nakup bitcoin z karty

Registrácia Binance

Burza Binance

Aktuálne kurzy