Autor Cointelegraph By Yashu Gola

SHIB price eyes 30% drop with Shiba Inu's massive triangle breakdown underway

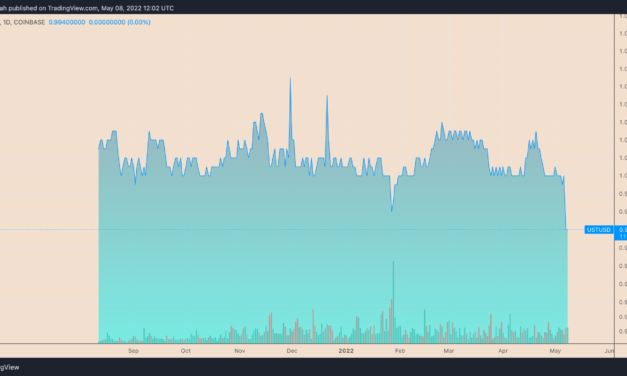
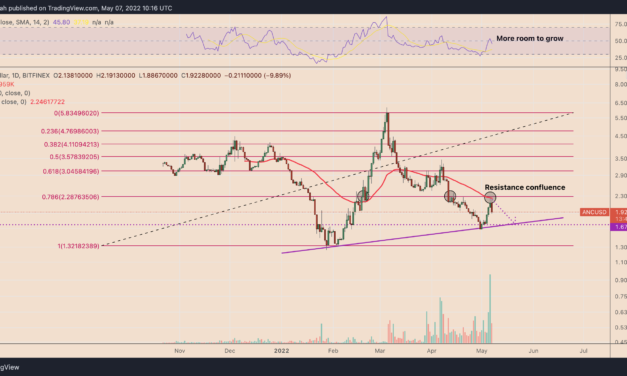
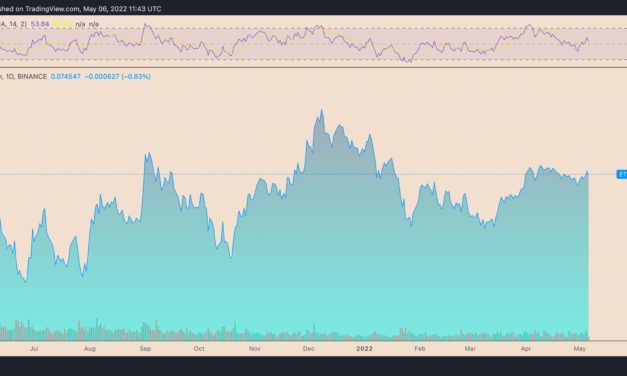
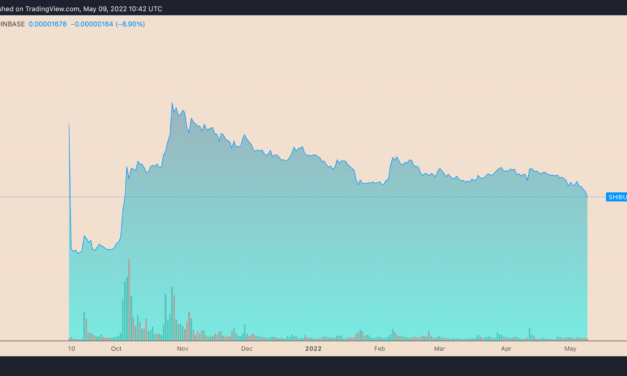
Shiba Inu (SHIB) price dropped by over 10% to $0.00001641 on May 9 amid a broader crypto market decline. This year, SHIB’s returns were 50% below zero, one of the worst performances by a top-ranking cryptocurrency in 2022.Last week, luxury fashion brand Gucci named Shiba Inu in the list of tokens it would accept for payments in five of its U.S.-based stores. Nonetheless, the bulls have ignored the major adoption news as SHIB price continues to fall under macro and technical pressures.SHIB/USD daily price chart. Source: TradingViewShiba Inu triangle breakdownThe prospect of Shiba Inu facing more yearly losses increases as it stays on the path toward its “symmetrical triangle” breakdown target near $0.00001197.The level, which sits around 30% below today’s price, results from a technical rule that measures symmetrical triangles’ profit targets by adding the maximum distance between the structure’s upper and lower trendline to the breakout/breakdown point. SHIB/USD weekly price chart featuring ‘symmetrical triangle’ breakout. Source: TradingViewNevertheless, SHIB’s shorter-timeframe charts reflects an interim bullish bias.Short-term 20% bounce in play SHIB has dropped near the red horizontal line near $0.00001667, which has served as an accumulation zone for traders three times since October 2021. For instance, Shiba Inu had rallied by over 100% two weeks after testing the $0.0000167-level as support in January 2022.The level also coincides with the lower trendline of the descending parallel channel, as shown in the chart below. As a result of this confluence, SHIB eyes a price rebound, with the channel’s upper trendline near $0.00002000 acting as the interim upside target for the May-June period.SHIB/USD daily price chart featuring descending parallel channel setup. Source: TradingViewMeanwhile, SHIB’s daily relative strength index (RSI) has dipped below 30, an oversold territory that could further catalyze a short-term rebound.Nonetheless, macroeconomic catalysts — primarily a hawkish Federal Reserve — continue to pose downside risks for the crypto market, including SHIB. So price rallies are likely to sell off at higher levels, thus keeping SHIB on track toward its triangle breakdown target near $0.00001197.Bright future promisedShiba Inu’s developer Shytoshi Kusama offered a bright outlook for the project in what appeared to be an effort to pent-up the market demand for SHIB tokens.Related: Shiba Inu has a new use case — Buying land in SHIB: The MetaverseThe developer noted that Playside, an Australia-based video gaming firm, would feature Shiba Inu-themed nonfungible tokens (NFT) — called Shiboshi — on their upcoming metaverse game of the same name. He also noted that Shiba Inu would release the documentation of their layer-2 blockchain, Shibarium, by “this month or next.”I updated the Shiboshi chat recently but I’m sure we will be seeing more from Playside soon as we near the final triad of production.— Shytoshi Kusama™ (@ShytoshiKusama) May 7, 2022The disclosures came after an Ethereum whale bought 74 billion SHIB (worth $1.23 million at press time).The views and opinions expressed here are solely those of the author and do not necessarily reflect the views of Cointelegraph.com. Every investment and trading move involves risk, you should conduct your own research when making a decision.

Čítaj viac

Monero avoids crypto market rout, but XMR price still risks 20% drop by June

Monero (XMR) has shown a surprising resilience against the Federal Reserve’s hawkish policies that pushed the prices of most of its crypto rivals — including the top dog Bitcoin (BTC) — lower last week. XMR’s price closed the previous week 2.37% higher at $217, data from Binance shows. In comparison, BTC, which typically influences the broader crypto market, finished the week down 11.55%. The second-largest crypto, Ether (ETH), also plunged 11% in the same period.XMR/USD vs. BTC/USD vs. ETH/USD weekly price chart. Source: TradingViewWhile the crypto market wiped off $163.25 billion from its valuation last week, down nearly 9%, Monero’s market cap increased by $87.7 million, suggesting that many traders decided to seek safety in this privacy-focused coin. XMR near critical supportMonero started the new week with a selloff, with XMR plunging by nearly 4% to around $208 on May 9.The decline brought the token near its key support level — the 50-week exponential moving average (50-day EMA; the red wave in the chart below) near $214. The wave also coincides with another price floor — the 0.618 Fib line of the Fibonacci retracement graph drawn from the $38-swing low to the $491-swing low.XMR/USD weekly price chart. Source: TradingViewInterestingly, XMR’s price drop is part of a pullback move that began April 21 from about $290. In turn, the reversal to the downside surfaced amid a falling wedge breakout whose upside target comes to be around $490.  That could result in either of these two outcomes: XMR breaks below its support confluence around $214 to test the wedge’s upper trendline as support (which also coincides with the token’s 200-week EMA near $161.50); OR the token rebounds from the support confluence and continue its move towards the wedge’s technical upside target near $490.The overall crypto market trend looks biased towards bears in a higher interest rate environment. This, coupled with Monero’s erratic but consistent positive correlation with Bitcoin, could eventually weigh XMR lower, resulting in a decline toward the wedge’s top around $160 in Q2, down about 20% from today’s price. XMR’s correlation with Bitcoin. Source: TradingViewStrong XMR fundamentalsXMR’s bearish setup could see a period of price spikes as Monero inches closer to its tentative hard fork, scheduled for July 16.Related: Making crypto conventional by improving crypto crime investigations worldwideA testnet version of the same technical upgrade expects to come out on May 16, according to Monero’s GitHub post. The team behind the project has confirmed that the hard fork would improve Monero’s network security while cutting fees. #Monero has a network upgrade (hardfork) on July 16th 2022 at block 2668888.Privacy and performance will be improved! The update includes: Ring sizes will increase from 11 to 16 View tags to speedup wallet/node syncMultisig fixesBulletproof++more!#xmr $xmr pic.twitter.com/jZ5ouk1uqo— John Foss (@johnfoss69) April 17, 2022Meanwhile, demand for Monero expects to rise higher in 2022 due to its promise of providing anonymity. For instance, XMR emerged as a choice of crypto among ransomware attackers, with a CipherTrade study showing a 500% increase in the token’s usage in 2021. The views and opinions expressed here are solely those of the author and do not necessarily reflect the views of Cointelegraph.com. Every investment and trading move involves risk, you should conduct your own research when making a decision.

Čítaj viac

LUNA drops 20% in a day as whale dumps Terra's UST stablecoin — selloff risks ahead?

Terra (LUNA) has plunged significantly after witnessing a FUD attack on its native stablecoin TerraUSD (UST).The LUNA/USD pair dropped 20% between May 7 and May 8, hitting $61, its worst level in three months, after a whale mass-dumped $285 million worth of UST. As a result of this selloff, UST briefly lost its U.S. dollar peg, falling to as low as $0.98.UST daily price chart. Source: TradingViewExcessive LUNA supplyLUNA serves as a collateral asset to maintain UST’s dollar peg, according to Terra’s elastic monetary policy. Therefore, when the value of UST is above $1, the Terra protocol incentivizes users to burn LUNA and mint UST. Conversely, when UST’s price drops below $1, the protocol rewards users for burning UST and minting LUNA.Therefore, during UST supply reduction, LUNA’s valuation should decrease. Similarly, when UST’s supply expands, LUNA’s valuation increases, notes Will Comyns, a researcher at Messari.The chart below shows an ongoing downtrend in the daily UST supply, coinciding with a relative increase in daily LUNA supply. On May 8, UST’s market underwent contraction for the first time in two months, dropping by 28.1 million below zero. Simultaneously, LUNA’s supply expanded by over 436.75 million above zero.Daily change in LUNA and UST supply. Source: SmartStake.ioThe excessive daily supply against what appears to be a lowering or stable market demand may have pushed LUNA’s price lower.More pain for Terra ahead?Terra’s ongoing price decline prompted LUNA to retest a support confluence consisting of its 50-day exponential moving average (50-day EMA; the red wave) near $56 and a multi-month upward sloping trendline.Interestingly, the ascending trendline constitutes a rising wedge pattern in conjugation with another upward trending line above. Rising wedges are bearish reversal setups, so their occurrence on Terra’s weekly chart suggests more downside is probable.LUNA/USD weekly price chart featuring ‘rising wedge’ setup. Source: TradingViewAs a rule of technical analysis, a rising wedge breakdown pushes the price lower by as much as the maximum distance between the structure’s upper and lower trendline. Related: Luna Foundation Guard acquires additional 37,863 BTC as part of reserve strategyThus, if LUNA breaks below its wedge from its current support confluence, accompanied by an increase in volumes, its price would risk falling to around $22.50, down over 60% from today’s price.Conversely, a rebound from the support confluence would have LUNA positioned for a run-up toward the wedge’s upper trendline — above $130, a new record high.The views and opinions expressed here are solely those of the author and do not necessarily reflect the views of Cointelegraph.com. Every investment and trading move involves risk, you should conduct your own research when making a decision.

Čítaj viac

Anchor Protocol rebounds sharply after falling 70% in just two months — what's next for ANC?

Anchor Protocol (ANC) returned to its bullish form this May after plunging by over 70% in the previous two months. Pullback risks aheadANC’s price rebounded by a little over 42.50% between May 1 and May 6, reaching $2.26, its highest level in three weeks. Nonetheless, the token experienced a selloff on May 6 and May 7 after ramming into what appears to be a resistance confluence. That consists of a 50-day exponential moving average (50-day EMA; the red wave) and 0.786 Fib line of the Fibonacci retracement graph, drawn from the $1.32-swing low to the $5.82-swing high, as shown in the chart below.ANC/USD daily price chart. Source: TradingViewA continued pullback move could see ANC’s price plunging towards its rising trendline support, coinciding with the floor near  $1.67 that preceded a 175% price rally between Feb. 20 and March 5. Meanwhile, a decisive break below the trendline would risk crashing ANC towards the 1.00 Fib line near $1.32, almost 30% below today’s price of $1.92. Conversely, ANC’s daily relative strength index (RSI) readings rose from below 30 (oversold) to around 50 in the last seven days, hinting at upside strengths in the Anchor market unless the readings cross 70, the overbought threshold.As a result of favorable RSI, the Anchor Protocol token has the potential to break above the resistance confluence around $2.28, with its next upside target lurking around the 0.618 Fib line near $3.Anchor Protocol TVL hits record highThe sharp upside retracement in the Anchor Protocol market also coincides with a continued capital inflow into its liquidity pools.In detail, the total value locked (TVL) inside the Anchor’s savings and borrowing pools surged to $16.48 billion on May 7 from $8.6 billion at the beginning of this year — almost a 100% rise. In doing so, Anchor reserves also reached a record high of $17.15 billion on May 5, data from DeFi Llama shows.Anchor Protocol TVL. Source: DeFi LlamaUsers continued to commit funds to Anchor Protocol primarily due to its steeper annual yield of 19.5%. That has made it the largest liquidity pool within the Terra (LUNA) blockchain ecosystem. Related: Crypto Biz: The real reason crypto hodlers should care about the Federal Reserve, April 28–May 4, 2022Anchor has also expanded its services to Avalanche (AVAX), another base-layer blockchain, and now plans to function atop the Polkadot (DOT) ledger.ANC is a governance token within the Anchor Protocol’s “decentralized money market” ecosystem. It also offers holders a percentage of protocol earnings. Thus, Anchor Portocol’s expansion into other blockchain ecosystems promises to generate more demand for ANC.Additionally, proposals like vote-escrowed ANC, which enables holders to lock their tokens for a preset period in return for better voting rights and staking rewards, could also drive up ANC’s demand.The views and opinions expressed here are solely those of the author and do not necessarily reflect the views of Cointelegraph.com. Every investment and trading move involves risk, you should conduct your own research when making a decision.

Čítaj viac

Ethereum hits 3-week high vs. Bitcoin amid Fed-led market rout

Ethereum’s native token Ether (ETH) tumbled to its worst levels in almost two months against the U.S. dollar on May 6 as the rout in financial markets rippled across the cryptocurrency sector. Nonetheless, ETH did fare better than Bitcoin (BTC) with the ETH/BTC pair hitting a three week high.ETH/BTC daily price chart. Source: TradingViewThe Merge impactMany analysts credited Ethereum’s merge to proof-of-stake from proof-of-work as one of the key reasons behind the capital rotation from Ether to Bitcoin markets, including Toast.ETH, a pseudonymous analyst, who underscored Ether’s ongoing supply reduction as another reason ETH may be currently outperforming BTC.Interestingly, Ethereum has grown by nearly 250% against Bitcoin since the beginning of its migration to proof-of-stake in December 2020. ETH/BTC weekly price chart. Source: TradingViewEliezer Ndinga, a research lead at 21 Shares, a Zug-based crypto ETP provider, pointed out that “liquid staking” could also be playing a big role in reducing sell-side pressure.Liquid staking is the main cushion here, hence why Lido is the largest DeFi app by TVL — up 51% YTD from $11.9B to over $18BAs of writing, Lido is the second largest app by TVL actually. Still an incredible ride. https://t.co/9HgBsu2PC6— Ξli (hiring!) (@elindinga) May 5, 2022ETH/BTC upside prospectsTechnicals indicate ETH/BTC could grow further in May but risks a broader correction overall as its trends inside a rising wedge pattern.The pair has bounced after testing the wedge’s lower trendline as support on April 30, and is now heading towards the upper trendline (around 0.078) as its interim upside target. Related: Bitcoin’s rocky road to becoming a risk-off asset: Analysts investigateBut since rising wedges are typically bearish reversal patterns ETH/BTC’s likelihood of breaking lower remains higher in the long-term.ETH/BTC daily price chart featuring ‘rising wedge’ setup. Source: TradingViewAs a rule of technical analysis, rising wedge breakdowns end up with the price crashing to level at a length equal to the pattern’s maximum height when measured from the breakdown point, i.e. 0.064-0.069.ETH/USD bearish scenarioTechnical signals suggest more downside prospects for Ether in the coming months, with a “bear flag” pattern projecting ETH’s price decline toward $1,700 in Q2, down about 40% from today’s price.ETH/USD weekly price chart featuring ‘bear flag’ setup. Source: TradingViewConversely, a rebound from the flag’s lower trendline could have Ether retest $4,000.The views and opinions expressed here are solely those of the author and do not necessarily reflect the views of Cointelegraph.com. Every investment and trading move involves risk, you should conduct your own research when making a decision.

Čítaj viac

Získaj BONUS 8 € v Bitcoinoch

nakup bitcoin z karty

Registrácia Binance

Burza Binance

Aktuálne kurzy