Autor Cointelegraph By Yashu Gola

Aave price risks a 25% plunge as a classic bearish reversal pattern emerges

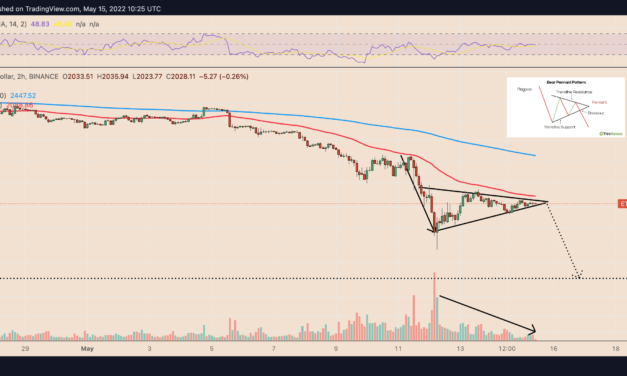
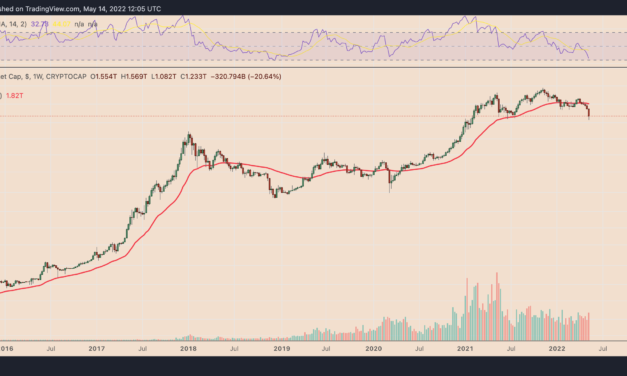
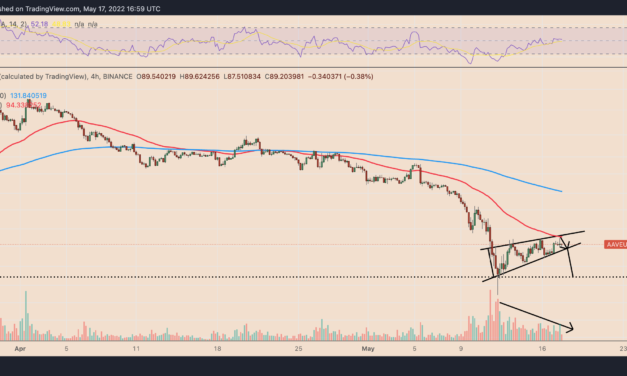
Technical analysis suggests that a recent uptrend in the price of Aave (AAVE) is showing signs of exhaustion based on early development of a classic bearish reversal pattern.Is AAVE headed to $70?Dubbed a “rising wedge,” the pattern surfaces when the price rises inside a range defined by two ascending, converging trendlines. As it happens, the trading volume declines, pointing to a lack of conviction among traders when additional buying is needed for continued upside momentum.Therefore, falling wedges typically result in a bearish breakout where the price breaks below the pattern’s lower trendline and falls by as much as the maximum distance between the wedge’s upper and lower trendline.AAVE has been painting a similar pattern amid its sharp upside move from nearly $61.50 on May 12 to over $93.50 on May 17. If a sustained breakdown pans out, AAVE will fall by at least $27, which is the wedge’s maximum height, as shown in the chart below.AAVE/USD four-hour price chart featuring ‘rising wedge’ setup. Source: TradingViewThis puts AAVE en route to around $70, down about 25% from the current price at $89.20.Related: Bitcoin macro bottom ‘not in yet’ warns analyst as BTC price holds $30KBearish headwinds persistThe bearish setup for AAVE appears in the wake of the crypto market’s ongoing strong correlation with U.S. equity markets. The daily correlation coefficient between AAVE and the tech-heavy Nasdaq 100 stood at 0.91 as of May 17, underscoring that the two markets have been moving in a near-perfect tandem. At the core of their synchronous trends is the Federal Reserve’s ultra-hawkish monetary policies, including the recent 0.5% hike in benchmark interest rates, against rising inflation.AAVE/USD daily correlation coefficient with Nasdaq 100. Source: TradingViewFear of continued sell-off remains as Wall Street veterans warn about a looming recession. According to Lloyd Blankfein, the former CEO of Goldman Sachs, higher interest rates, coupled with supply chain issues, fresh lockdowns in China and the conflict in Ukraine could keep inflation high. The persistent combination of these factors is likely to make the Federal Reserve keep its hawkish policies and the knock-on-effect is a reduction in U.S. economic growth.Similarly, Michael J. Wilson, Morgan Stanley’s chief U.S. equity strategist and CIO reiterated the same catalysts while predicting a 15% decline in the benchmark S&P 500 index. As a result of its correlation with cryptocurrency, AAVE also risks similar downside moves heading further into 2022. The views and opinions expressed here are solely those of the author and do not necessarily reflect the views of Cointelegraph.com. Every investment and trading move involves risk, you should conduct your own research when making a decision.

Čítaj viac

Ethereum in danger of 25% crash as ETH price forms classic bearish technical pattern

Ethereum’s native token Ether (ETH) looks ready to undergo a breakdown move in May as it forms a convincing “bear pennant” structure.ETH price to $1,500?ETH’s price has been consolidating since May 11 inside a range defined by two converging trendlines. Its sideways move coincides with a drop in trading volumes, underscoring the possibility that ETH/USD is painting a bear pennant.Bear pennants are bearish continuation patterns, meaning they resolve after the price breaks below the structure’s lower trendline and then falls by as much as the height of the previous move downside (called the flagpole).ETH/USD two-hour price chart. Source: TradingViewAs a result of this technical rule, Ether risks closing below its pennant structure, followed by additional moves to the downside. The height of ETH’s flagpole is around $650. Therefore, if the price undergoes breakdown at the pennant’s apex point near $2,030 then the structure’s bearish target will be below $1,500, down over 25% from today’s price.Sell-off, pullbackInterestingly, the bear pennant’s profit target falls into the area that preceded a 250% price rally in the February-November 2021 session. Also, the target is around Ether’s 200-week exponential moving average (200-day EMA; the blue wave), currently near $1,600.Ideally, the demand zone could prompt Ether traders to accumulate the tokens in anticipation of a sharp upside retracement. Suppose it happens, then ETH’s price interim profit target would likely be the multi-month downward sloping trendline that has served as resistance in a “falling channel” pattern, as shown in the chart below.ETH/USD weekly price chart. Source: TradingViewETH has already been rebounding after testing the demand zone (and the falling channel’s lower trendline) as support. This could push ETH/USD to reach the channel’s upper trendline near $3,000, about 50% above today’s price, by June.Extended breakdown scenarioThe worst-case scenario could be ETH breaking below the demand zone, led by macro risks and their impact on the crypto market so far in 2022.Related: $1.9T wipeout in crypto risks spilling over to stocks, bonds — stablecoin Tether in focusNotably, Ether has declined by over 50% quarter-to-date as investors reduce their exposure to the riskier assets, including Bitcoin (BTC) and tech stocks, in a higher interest rate environment.As Cointelegraph has reported, anticipations of additional stock market selloffs could weigh on cryptos, thus hurting Ether, Bitcoin, Cardano (ADA), and others in tandem.Ethereum’s correlation coefficient with tech-heavy Nasdaq 100 is at 0.90. Source: TradingViewBOOX Research, a financial blogger at SeekingAlpha, remains long-term bullish on Bitcoin, Ethereum, and the broader crypto market but believes a recovery might take several years. Excerpts from its note:”While some of the corrections from the top may have simply shaken out the ‘hot money,’ there is still a risk that a deteriorating macro environment opens the door for even deeper losses.”The views and opinions expressed here are solely those of the author and do not necessarily reflect the views of Cointelegraph.com. Every investment and trading move involves risk, you should conduct your own research when making a decision.

Čítaj viac

$1.9T wipeout in crypto risks spilling over to stocks, bonds — stablecoin Tether in focus

The cryptocurrency market has lost $1.9 trillion six months after it soared to a record high. Interestingly, these losses are bigger than those witnessed during the 2007’s subprime mortgage market crisis — around $1.3 trillion, which has prompted fears that creaking crypto market risk will spill over across traditional markets, hurting stocks and bonds alike.Crypto market capitalization weekly chart. Source: TradingViewStablecoins not very stableA massive move lower from $69,000 in November 2021 to around $24,300 in May 2022 in Bitcoin’s (BTC) price has caused a selloff frenzy across the crypto market. Unfortunately, the bearish sentiment has not even spared stablecoins, so-called crypto equivalents of the U.S. dollar, which have been unable to stay as “stable” as they claim.For instance, TerraUSD (UST), once the third-largest stablecoin in the industry, lost its dollar peg earlier this week, falling to as low as $0.05 on May 13. UST/USD daily price chart. Source: TradingViewMeanwhile, Tether (USDT), the largest stablecoin by market cap, briefly fell to $0.95 on May 12. But unlike TerraUSD, Tether managed to recover back to near $1, primarily because it claims to back its dollar peg using good old-fashioned reserves, including the real dollars and government bonds.Crypto spillover risksBut that is where the trouble begins, according to a warning issued by rating agency Fitch last year. The agency feared that Tether’s rapid growth could have implications for the short-term credit market, where it holds a lot of funds, according to the company’s reserves breakdown disclosed here.If traders decide to dump their Tether, the most-popular dollar-pegged stablecoin in the crypto sector, for cash, it would risk destabilizing the short-term credit market, Fitch noted.Crypto losses now equal $1.7 trillion. The 2007 subprime mortgage market was $1.3 trillion. It’s highly likely that Crypto will be the catalyst for accelerated global collapse. Weekend risk is HIGH. pic.twitter.com/4Ewo73uTeg— Mac10 (@SuburbanDrone) May 12, 2022The credit market is already struggling under the weight of higher interest rates. Tether could further pressure it lower as it holds $24 billion worth of commercial paper, $35 billion worth of Treasury notes, and $4 billion worth of corporate bonds. The signs are already visible. For example, Tether has been reducing its commercial paper reserves during the crypto correction in the last six months, its chief technology officer, Paolo Ardoino, confirmed on May 12. So, based on Fitch’s warning last year, many analysts fear that the “financial run” might soon spill over to the traditional market.That includes Joseph Abate, managing director of fixed income research at Barclays, who believes Tether’s decision to sell its commercial papers and certificate deposit holdings before maturity could mean paying several months of interest in penalty.As a result, they could be forced to sell their liquid Treasury bills, which make up 44% of their net holdings.Related: What happened? Terra debacle exposes flaws plaguing the crypto industry”We do not know what is going to happen, but the danger cannot be dismissed out of hand,” opines Robert Armstrong, the author of Financial Times’ Unhedged newsletter, adding: “Stablecoins have a total market capitalization of more than $150 billion. If the pegs all break — and they could — there will be ripples well beyond crypto.”The views and opinions expressed here are solely those of the author and do not necessarily reflect the views of Cointelegraph.com. Every investment and trading move involves risk, you should conduct your own research when making a decision.

Čítaj viac

3 reasons why Cardano can sink further despite ADA price bouncing 58%

Cardano (ADA) pared a big portion of the weekly losses incurred during this week’s crypto market rout. ADA’s price reached an intraday high of $0.60 on May 13, a day after rebounding from its week-to-date low of $0.38 — a 58% rally. The huge upside retracement appeared in the wake of similar price action in the crypto market with top cryptos Bitcoin (BTC) and Ether (ETH) rebounding by 23% and 25.75% since yesterday’s lows.The top ten crypto assets’ recovery in the past 24 hours. Source: MessariBut the sharp ADA recovery does not promise an extended upward continuation, at least according to three of these factors discussed below.Stock market crash far from overFirst, the price action in the Cardano and similar crypto-assets has been in lockstep with U.S. equities, especially tech stocks.Notably, the correlation coefficient between ADA and the tech-heavy Nasdaq Composite was 0.93 on May 13, meaning that any major moves in stocks would likely steer Cardano in the same direction. The correlation between Cardano and Nasdaq Composite. Source: TradingViewMoreover, the chances of Nasdaq undergoing a sharp recovery are currently slim, as analysts highlight the overstretched valuations of the Big Tech stocks and their probability of crashing further in a higher interest-rate environment.”The [ax] is hanging, rather, over high-growth tech companies,” opines Richard Waters, the Financial Times’ West Coast editor, adding: “This is where valuations became most stretched, and where the market is having the most trouble finding its nadir.”Simply put, Cardano’s persistent positive correlation with Nasdaq could result in more sharp declines in the ADA market, at least for the time bein.ADA’s “fifth wave missing”Secondly, another hint of a potential Cardano price decline comes from a technical structure highlighted by Capo of Crypto, an independent market analyst.The pseudonymous analyst notes that ADA could fall to the $0.30-$0.35 range next, given its possibility to paint the fifth and final wave of a bearish Elliott Wave setup, as shown in the chart below. ADA/USD two-day price chart featuring bearish Elliott Wave setup. Source: Capo of Crypto/TradingViewThe target range coincides with the support area from January 2021 that preceded a 850% bull run.Descending channel breakdown Thirdly, Cardano has been breaking below its multi-month descending channel in another sign of weakness.  ADA has been trending lower inside a range defined by two falling, parallel trendlines, underscoring traders’ current strategy of buying near the lower trendline and selling toward the upper trendline. But on May 12, ADA/USD broke down below the lower trendline near $0.568, showing that traders ignored the buying opportunity.Instead, buyers showed up near the $0.378-level to accumulate ADA, leading to the price rebound, as discussed above. However, the trading volume backing the recovery move was lower than during the selloff’s, indicating a weakening rebound trend.ADA/USD daily price chart. Source: TradingViewSimultaneously, the upside retracement move showed signs of further weakness after testing the descending channel’s bottom as resistance — a way of confirming the breakdown. If the bulls fail to flip the price ceiling to support, then ADA’s likelihood of continuing its prevailing downtrend will be much higher.Related: Look out below! Ethereum derivatives data hints at further downside from ETHConversely, a decisive move above the channel’s lower trendline could have ADA then test its upper trendline near $1. The views and opinions expressed here are solely those of the author and do not necessarily reflect the views of Cointelegraph.com. Every investment and trading move involves risk, you should conduct your own research when making a decision.

Čítaj viac

Dogecoin eyes 'oversold' bounce as DOGE price gives up 90% of yearly gains

Dogecoin (DOGE) shows the prospect of undergoing a strong price rebound after reaching a technical support confluence on May 12.DOGE price 25% bounce incoming?DOGE’s 45% price drop to $0.065 this week, or a 90% decline from its record high of $0.76 a year ago, was met with decent buying sentiment. As a result, the token underwent a modest price rebound on May 12, rising over 10% to $0.078.Interestingly, Dogecoin’s upside retracement move started near a confluence of two support levels: a multi-month downward sloping trendline and a horizontal line that preceded a 335% price rally in the week ending April 19 last year. DOGE/USD weekly price chart. Source: TradingViewMeanwhile, the falling trendline is part of a broader descending channel pattern. Its multiple retests as support in the last 12 months propelled DOGE’s price toward the channel’s upper trendline. If the pattern repeats, Dogecoin’s rebound will stretch toward the upper trendline near $0.1, up almost 25% from May 12’s price.DOGE/USD weekly price chart featuring ‘descending channel’ setup. Source: TradingViewThe upside setup also picks cues from Dogecoin’s daily relative strength index (RSI), now near its oversold threshold of 30 — a buy signal. Conversely, a decisive move below the confluence support risks sending DOGE to $0.04, which has served as a strong support level in the February–April 2021 session. That would mean another 40% price decline before the next potential rebound.Elon Musk vs. Federal ReserveThe latest bout of selling in the Dogecoin market coincides with similar sentiment in the overall crypto and traditional markets, led by the Federal Reserve’s decision to tighten monetary policy aggressively to curb rising inflation.Dogecoin, much like its top-ranking rivals Bitcoin (BTC) and Ethereum (ETH), has also been hit by the panic around the de-pegging of two popular stablecoins: TerraUSD (UST) and Tether (USDT). 2/2… mainstream adoption of #cryptos not just to trade, but also to conduct everyday transactions for goods & services. The upshot: keep a close eye on the biggest stablecoin, #Tether. $USDT fell to $0.95 overnight & is back to $0.99 now.$BTC $ETH— DataTrek Research (@DataTrekMB) May 12, 2022As DOGE holds above its technical support levels, its next potential bull case is none other than Tesla CEO Elon Musk. The billionaire investor, who has emerged as one of the most celebrated Dogecoin backers, recently bought Twitter for $44 billion. Before the acquisition, he had suggested that the Twitter board start accepting DOGE as payments for their first-ever subscription service Twitter Blue.#ElonMusk bought Twitter I think #Dogecoin will benefit from it— Yuriy_Bishko (@YuriyBishko) April 26, 2022

Twitter has not revealed any plans to use DOGE for payments. But the prospect of it happening could put a price floor below the token in the coming weeks.The views and opinions expressed here are solely those of the author and do not necessarily reflect the views of Cointelegraph.com. Every investment and trading move involves risk, you should conduct your own research when making a decision.

Čítaj viac

Získaj BONUS 8 € v Bitcoinoch

nakup bitcoin z karty

Registrácia Binance

Burza Binance

Aktuálne kurzy