Autor Cointelegraph By Yashu Gola

Avalanche nears key breakdown level that could sink AVAX price by another 65%

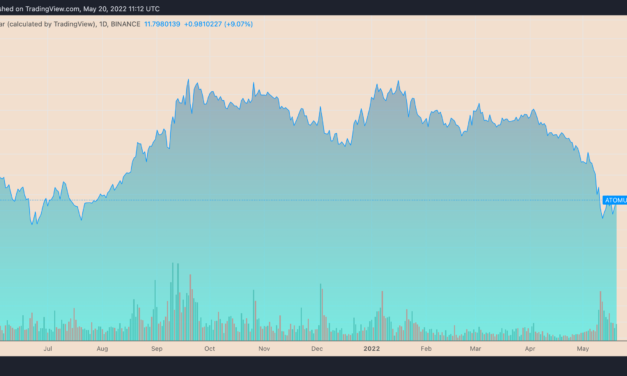
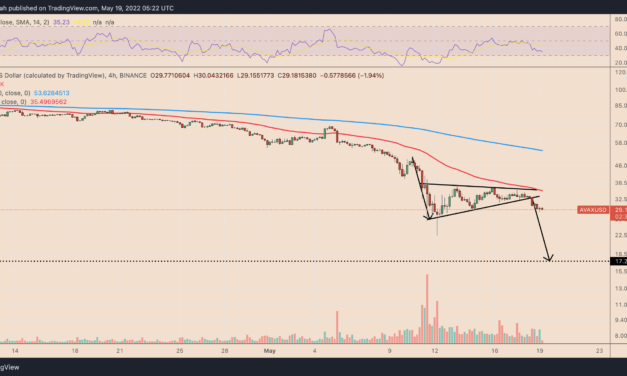
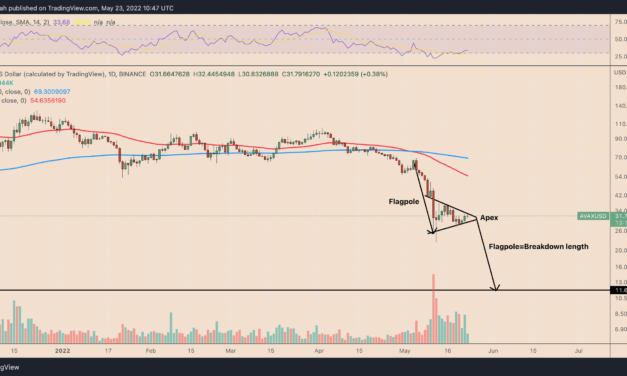
Avalanche (AVAX) gained 0.5% to reach over $31 on May 23 but AVAX price remains trapped inside a trading range that appears like a “bear pennant” structure.Avalanche could get buried technicals Bear pennants are bearish continuation patterns, i.e., they resolve after the price breaks out of them to the downside and then—as a rule of technical analysis—falls by as much as the height of the previous downtrend, also called “flagpole.”AVAX is nearing a technical breakdown as its price moves toward the pennant’s apex, i.e., the point where its upper and lower trendlines converge. This paints the bearish target for the AVAX/USD pair at $11.50 by June 2022, down about 65% from today’s price, as shown below.AVAX/USD daily price chart featuring ‘bear pennant’ breakdown setup. Source: TradingViewAVAX price: key support levelsConversely, AVAX’s breakdown setup toward $11.50 could fell short due to certain key support areas.For instance, the Avalanche token’s volume profile shows it trading near its point of control (POC)—the level where the traders were most active since 2021—around $32. Interestingly, the level was instrumental in capping AVAX’s downside attempts in the August-September 2021 session; it preceded a 390% bull run, which saw AVAX reaching its record high of around $150 in late November 2021.AVAX/USD daily price chart featuring volume profile. Source: TradingViewThe POC level also served as a median during the consolidation trend witnessed between January 2021 and May 2021. Now, It holds as a price floor even as AVAX eyes the bear pennant breakdown, as discussed above.Meanwhile, creating a Fibonacci retracement graph from AVAX’s $2.75-swing low to $97.50-swing high shows AVAX consolidating between its 0.618 Fib line (near $40) and 0.786 Fib line (around 23), as shown below. AVAX/USD weekly price chart featuring Fib support and resistance levels. Source: TradingViewThat raises Avalanche’s possibility of retesting $23 as support, followed by a rebound move toward $40. Such a move would risk invalidating the bear pennant setup.Fundamentally bearishToday, Avalanche trades nearly 78% below its record high of around $150, burdened by a strong bearish sentiment elsewhere in the crypto market in a higher interest rate environment. In addition, the recent Terra ecosystem meltdown has also stressed the prices of AVAX and other cryptos lower.JUST IN: #AVAX CEO says the company lost $60 million from the $LUNA and $UST collapse.— Watcher.Guru (@WatcherGuru) May 22, 2022But the worst is still yet to come if AVAX continues trending in sync with the top crypto Bitcoin (BTC) and, in turn, its global risk-on counterparts, such as Nasdaq. The correlation coefficient between Avalanche and Nasdaq was 0.91 as of May 23, showing that they have been moving in near-perfect tandem.  Related: Bitcoin macro bottom ‘not in yet’ warns analyst as BTC price holds $30KOn the brighter note, AVAX shows promise of an interim upside scenario with a divergence between its rising relative strength index (RSI) and falling prices, according to Scott Melker, an independent market analyst.AVAX/USD daily price chart showing bullish divergence. Source: Scott Melker/TradingView”There are potential bullish divergences with oversold RSI on a ton of daily altcoin charts,” said Melker, adding: “Need definitive elbow up on RSI, but I still think we have been bottoming here across markets…. for now.”The views and opinions expressed here are solely those of the author and do not necessarily reflect the views of Cointelegraph.com. Every investment and trading move involves risk, you should conduct your own research when making a decision.

Čítaj viac

Dollar Cost Averaging or Lump-sum: Which Bitcoin strategy works best regardless of price?

Bitcoin (BTC) has declined by more than 55% six months after it reached its record high of $69,000 in November 2021. The massive drop has left investors in a predicament about whether they should buy BTC when it is cheaper, around $30,000, or wait for another market selloff.The more you look at prior $BTC price history the more one can think it’s not the bottomAfter 190 days from the all-time high, Bitcoin still had another 150 to 200 days until it hit bottom last couple of cycles (red box)If time is any indicator, could be another 6 to 8 months pic.twitter.com/C1YHnfOzxC— Rager (@Rager) May 20, 2022This is primarily because interest rates are lower despite Federal Reserve’s recent 0.5% rate hike. Meanwhile, cash holdings among the global fund managers have surged by 6.1% to $83 billion, the highest since the 9/11 attacks. This suggests risk aversion among the biggest pension, insurance, asset, and hedge funds managers, the latest Bank of America data shows.Many crypto analysts, including Carl B. Menger, see greater buying opportunities in the Bitcoin market as its price searches for a bottom. But instead of suggesting a lump-sum investment (LSI), wherein investors throw down a huge sum to enter a market, there’s a seemingly safer alternative for the lay investor, called the “dollar cost averaging,” or DCA.Bitcoin DCA strategy can beat 99.9% of all asset managersThe DCA strategy is when investors divide their cash holdings into twelve equal parts and buy Bitcoin with each part every month. In other words, investors purchase more BTC when its prices decline and less of the same asset when its prices rise.The strategy has so far provided incredible results. For instance, a dollar invested into Bitcoin every month after it topped out in December 2017—near $20,000—has given investors a cumulative return of $163, according to CryptoHead’s DCA calculator. That means a circa 200% profit from consistent investments.Bitcoin DCA calculator. Source: CryptoHeadThe Bitcoin DCA strategy also originates from an opinion that BTC’s long-term trend would always remain skewed to the upside. Menger claims that buying Bitcoin regularly for a certain dollar amount could have investors “beat 99.99% of all investment managers and firms on planet Earth.”This chart speaks everything #btc DCA is the smartest and the most effective way of beating the market #bearmarket https://t.co/ndKyzAi6FT— ahmad (@albazzi02) May 13, 2022

Cracks in the DCA strategyHistorical returns in traditional markets, however, do not support DCA as the best investment strategy. Instead, the LSI strategy proves to be better.For instance, a study of 60/40 portfolios by Vanguard, which looked at every 12-month timeframe from 1926 until 2015, showed that all-at-once investments outperformed the DCA two-thirds of the time, averaging 2.4% on a calendar year basis.Related: Bitcoin ends week ‘on the edge’ as S&P 500 officially enters bear marketThis somewhat raises the possibility that Bitcoin, whose daily positive correlation with the benchmark S&P 500 index surged to 0.96 in May, would show similar results between its DCA and LSI strategies in the future. Thus, investing regularly in Bitcoin with a fixed cash amount might not always give better profits than the all-in method.BTC/USD daily price chart. Source: TradingViewBut what about combining both?Larry Swedroe, chief research officer for Buckingham Wealth Partner, believes investors should invest with a “glass is half full” perspective, meaning a mix of LSI and DCA.”Invest one-third of the investment immediately and invest the remainder one-third at a time during the next two months or next two quarters,” the analyst wrote on SeekingAlpha, adding: “Invest one-quarter today and invest the remainder spread equally over the next three quarters. Invest one-sixth each month for six months or every other month.”The views and opinions expressed here are solely those of the author and do not necessarily reflect the views of Cointelegraph.com. Every investment and trading move involves risk, you should conduct your own research when making a decision.

Čítaj viac

Ethereum preparing a 'bear trap' ahead of the Merge — ETH price to $4K next?

Ethereum’s native token, Ether (ETH), continues to face downside risks in a higher interest rate environment. But one analyst believes that the token’s next selloff move could turn into a bear trap as the market factors in the possible release of the Merge this coming August.ETH to $4K?Ether’s price could reach $4,000 by 2022’s end, according to a technical setup shared on May 20 by Wolf, an independent market analyst.The analyst envisioned ETH moving inside a multi-month ascending triangle pattern, which comprises a horizontal trendline resistance and rising trendline support. Notably, ETH’s latest retest of the structure’s lower trendline could initiate a big rebound toward its upper trendline, which sits around the $4,000-level, as shown below. ETH/USD three-day price chart featuring ascending triangle setups. Source: Wolf/TradingViewWolf took his bullish cues from a similar triangle setup from 2016, whose formation preceded a major bull run from $1 to $27. Similarly, another ascending triangle occurrence in 2017 coincided with a bullish follow-up, wherein ETH/USD rose 270% to over $1,500.The Merge vs. low liquidity “death spiral”Wolf’s fractal-based analysis came as Preston Van Loon, one of the Ethereum core developers, confirmed that the blockchain project’s much-anticipated upgrade to a proof-of-stake consensus mechanism would occur sometime in August.Wolf noted that Ethereum was setting up a “bear trap,” which would make sense prior to the upgrade, complimenting his technical setup, as discussed above.Bear trap few months from the #merge makes sense. $ETH— Wolf (@IamCryptoWolf) May 20, 2022The pending upgrade was one of the key catalysts behind Ether’s price rally in 2021, as many investors believed it would improve the long-standing scalability problem in the Ethereum blockchain while cutting transaction and gas costs. Nonetheless, Ethereum Foundation kept delaying the launch.”Undoubtedly, this lack of progress has played a major role in Ethereum’s recent price decline,”  Bitfreedom Research, a tech-stock and crypto research entity, noted while predicting ETH’s price to decline toward $950–$1,900 by October 2022. Related: Analysts note parallels with March 2020: Will this time be different?The firm cited higher interest rates as the core reason behind its bearish outlook for Ethereum, noting:”The crypto market moves extraordinarily fast, which means crypto companies need LOTS of cash to power rapid growth. With no cash available, this can lead Ethereum’s ERC20-token economy to move in a death spiral.”The views and opinions expressed here are solely those of the author and do not necessarily reflect the views of Cointelegraph.com. Every investment and trading move involves risk, you should conduct your own research when making a decision.

Čítaj viac

Cosmos price rebounds 45% in one week despite Terra's debacle — what's next for ATOM?

Cosmos (ATOM) emerges as the biggest gainer among the top cryptocurrencies this May 20, brushing aside the fears about its association with Terra (LUNA), an algorithmic stablecoin project whose market valuation fell by 99% last week.Cosmos TVL down from $10M to $155KATOM’s price increased by over 10% intraday to almost $12. The gains appeared as a part of a broader upside retracement that started on May 12 when it had fallen to its eleven-month low near $8. That marked around a 45% price recovery in almost a week.ATOM/USD daily price chart. Source: TradingViewThe ATOM price rebound occurred despite its parent chain, Cosmos Hub, witnessing massive capital outflows from its liquidity pools. Notably, the total value locked (TVL) with Cosmos dropped to around $155,000  on May 20, compared to its year-to-date high of over $10 million, according to Defi Llama. Terra emerged as one of the primary reasons behind the drop since its liquidity pools made up 92% of the overall Cosmos TVL as of May 9. But on May 20, the project’s stake in the Cosmos ecosystem was just around 17%.Cosmos TVL distribution. Source: Defi LlamaMeanwhile, a hawkish Federal Reserve had also contributed to the selloff across riskier assets last week, hurting cryptos like Bitcoin (BTC), Ether (ETH), and ATOM in tandem, as Cointelegraph covered here.ATOM price rebound sustainable?From a technical perspective, ATOM remains at the risk of continuing its decline in Q2/2022.First, the Cosmos token’s 45% rebound accompanies a drop in its trading volumes, suggesting a low trader turnout behind the rally that, in turn, could lead to a price reversal. Second, the price appears to have formed an ascending triangle, a trend continuation indicator, as shown in the chart below.ATOM/USD four-hour price chart featuring ascending triangle setup. Source: TradingViewAs a rule of technical analysis, ascending triangles formed during a downtrend resolve after the price breaks below their lower trendline and continue falling until it reaches the level at length equal to the triangle’s maximum height. Applying the same theory on Cosmos shifts ATOM’s downside target to $7.50 with the breakdown point around $10.35.Bullish reversal scenarioIn some cases, however, ascending triangles in a downtrend could lead to a trend reversal instead of continuation. Therefore, the bulls could attempt a breakout with a run-up to the triangle’s upper trendline near $12.50.Related: Contrarian Bitcoin investors identify buy zones even as extreme fear grips the marketATOM’s likelihood of continuing its recovery is high if this occurs particularly with increasing trading volume. In doing so, the upside target for ATOM/USD could again be at the length equal to the maximum distance between the triangle’s upper and lower trendline, as shown below.ATOM/USD four-hour price chart featuring ascending triangle’s reversal setup. Source: TradingViewIn other words, the bullish scenario puts ATOM’s price en route to $17.25 by June, up around 45% from today’s price.The views and opinions expressed here are solely those of the author and do not necessarily reflect the views of Cointelegraph.com. Every investment and trading move involves risk, you should conduct your own research when making a decision.

Čítaj viac

Here’s why Terra’s snowball effect could send Avalanche (AVAX) price to $15

Avalanche (AVAX) has emerged as one of the worst-performing cryptocurrencies among the top-ranking tokens in the last 24 hours, partially due to fears connected to Terra (LUNA) and it’s a near-dead UST algorithmic stablecoin project.Avalanche price dips amid Terra’s tax evasion FUDAVAX’s price plunged by nearly 14% between May 18, where it traded near $35 to May 19 when the price dipped to $28.50. The dip coincided with a South Korean news agency report that claims Terraforms Labs, the developer of the Terra blockchain, owes 100 billion won (approximately $78.5 million) to the regional tax agency.#Terra owes $78.5M in taxes to South Korea’s government— Market Rebellion (@MarketRebels) May 18, 2022The news came three days after Luna Foundation Guard (LFG), a nonprofit subsidiary of TerraForms, revealed that it had around 1.97 million AVAX tokens (worth $58.39 million at May 19’s price) in the reserves that were supposed to back its benchmark UST stablecoin. In the same pool, LFG also holds Bitcoin (BTC), Binance Coin (BNB) and LUNA. The firm had earlier sold a good portion of its holdings to shore up UST’s value following its “depeg” from the U.S. dollar.Interestingly, LFG has not sold any AVAX, nonetheless, the panic around the Terra fiasco prompted the Avalanche token to plunge by nearly 50% month-to-date, including a 30% intraday decline on May 11.Related: Tether to move over 1B USDT from Tron to Ethereum and AvalancheTechnical analysis projects further downside for AVAXAVAX/USD 4-hour price chart featuring ‘bear pennant’ setup. Source: TradingViewFrom a technical perspective, AVAX’s price could fall by another 40% in May as it breaks out of its prevailing bearish continuation setup.Dubbed “bear pennant,” the pattern appears when the price consolidates inside a range—defined by a falling upper trendline and a rising lower trendline—after a strong move downward. It resolves after the price breaks below the lower trendline and, as a rule of technical analysis, falls by as much as the flagpole of the previous downtrend.The bear pennant setup puts AVAX en route to around $17 in May, down about 40% from May 19’s price.The views and opinions expressed here are solely those of the author and do not necessarily reflect the views of Cointelegraph.com. Every investment and trading move involves risk, you should conduct your own research when making a decision.

Čítaj viac

Získaj BONUS 8 € v Bitcoinoch

nakup bitcoin z karty

Registrácia Binance

Burza Binance

Aktuálne kurzy