Autor Cointelegraph By Yashu Gola

Spooky Solana breakdown begins with SOL price facing a potential 45% drop — Here's why

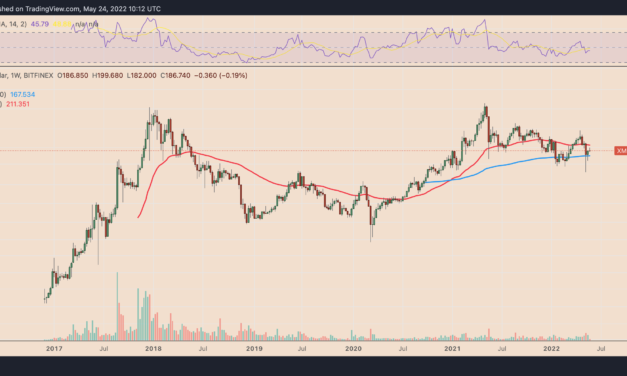
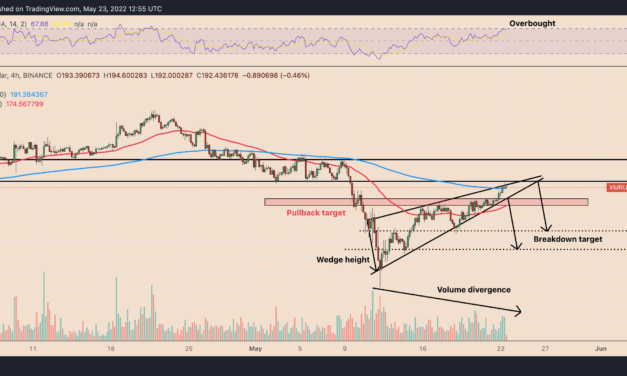
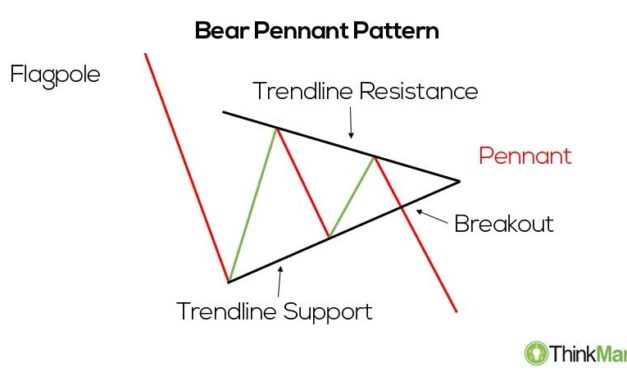
Solana (SOL) dropped on May 26, continuing its decline from the previous day amid a broader retreat across the crypto market.SOL price pennant breakdown underwaySOL price fell by over 13% to around $41.60, its lowest level in almost two weeks. Notably, the SOL/USD pair also broke out of what appears to be like a “bear pennant,” a classic technical pattern whose occurrences typically precede additional downside moves in a market.In detail, bear pennants appear when the price trades inside a range defined by a falling trendline resistance and rising trendline support. Bear pennant pattern. Source: ThinkMarketsThese patterns resolve after the price breaks below the lower trendline, accompanied by higher volumes. As a rule of technical analysis, traders decide the pennant’s profit target after adding the length of the prior’s leg lower (called “flagpole”) to the breakdown point.SOL has been undergoing a similar breakdown after closing below its pennant’s lower trendline on May 25, as shown below. In theory, Solana’s profit target comes to be near $23, down about 45% from May 26’s price.SOL/USD daily price chart featuring ‘bear pennant’ setup. Source: TradingViewNonetheless, SOL’s bear pennant breakdown appears without a spike in trading volumes, suggesting that traders are not fully convinced with the move. That could prompt the token to retest the pennant’s lower trendline as resistance. Moreover, a successful retaking of the trendline as support risks invalidating the bear pennant setup while bringing the 20-day exponential moving average (20-day EMA; the green wave) near $57.59 in proximity as the next upside target. Conversely, a pullback could keep SOL’s near-$23 profit target in view, with $35.50—the May 12 price floor that preceded a sharp rebound—serving as interim support. Solana price support confluenceSOL also trades near a support confluence, comprising multi-month horizontal and rising trendlines.SOL/USD weekly price chart. Source: TradingViewThe horizontal trendline near $45.75 served as resistance during the April–August 2021 session and later flipped to become support between January 2022 and March 2022. Simultaneously, the rising trendline has been capping SOL’s extended bearish attempts since March 2021.Related: Assuming Bitcoin plays nice, higher timeframe analysis points to $90 Solana (SOL) priceAs the two trendlines converge, they could become a psychological entry point for investors with a long-term upside outlook. That would mean SOL rebounding towards its next upside target near $79, which also coincides with a multi-month falling trendline resistance.On the other hand, a continued selloff in the Solana market would have SOL risk another massive decline, as discussed in the bear pennant setup above.The views and opinions expressed here are solely those of the author and do not necessarily reflect the views of Cointelegraph.com. Every investment and trading move involves risk, you should conduct your own research when making a decision.

Čítaj viac

U.S. dollar index retreats from 20 year highs — but will DXY topping spark a Bitcoin recovery?

The U.S. dollar index (DXY) retreated broadly from its prevailing bull run in the past two weeks, dropping by up to 3.20% after hitting its two-decade high of 105.Overvaluation risks grip dollar marketDollar’s correction in the last two weeks preceded twelve months of relentless buying. To recap, the greenback’s weight against the basket of top foreign currencies grew by around 14.3% in a year, primarily as markets looked for safe havens against the fears of a hawkish Federal Reserve and more recently the military conflict between Ukraine and Russia.DXY weekly price chart. Source: TradingViewCash balances among the global fund managers grew 6.1% on average since 9/11, a recent survey of 288 asset allocators by Bank of America showed. The report also noted that 66% of asset managers believe global profits will weaken in 2022, prompting them to hold “overweight” cash positions.”The market has hoarded a huge amount of dollars in recent months,” George Saravelos, strategist at Deutsche Bank, told the Financial Times, adding that it is “leading to a very substantial dollar overvaluation.”Thus, the dollar’s latest retreat may have been an interim correction to neutralize its “overbought” conditions, as the greenback’s weekly relative strength index (RSI) readings also suggested (in the chart below).From a further technical perspective, the DXY could decline further toward a rising trendline that as support has been capping its downside moves since January 2021, as shown below. DXY weekly price chart. Source: TradingViewIf more selloffs occur, the index is likely to pull back from its current resistance range, with the next downside target at the 0.786 Fib line near 100.Stronger euro prospectsThe DXY also pulled back earlier this week as Christine Lagarde, president of the European Central Bank (ECB), set a new and more hawkish policy on May 23.Lagarde committed to interest rate hikes by September 2022, thus turning away from ECB’s decade-long dovish monetary policy that has resulted in de facto negative interest rates. As a result, rates in Eurozone would shoot back to zero, the prospect of which has made the euro stronger against the dollar.EUR/USD weekly price chart. Source: TradingViewBut even with the ongoing Ukraine-Russia crisis and its access to energy thrown into haywire, Eurozone’s confidence in business growth remains strong, the recent IFO survey shows. That would mean more upside boost for the euro, which could pressure the dollar lower.The IFO survey shows robust German business confidence. Source: Bloomberg”It’s still too soon to say with any confidence that the dollar is now into a weakening trend,” said John Authers, a senior editor at Bloomberg Opinion, adding: “But its decline is another indication that the ‘stagflation and ever-higher rates’ narrative is being rethought.”EM currencies versus BitcoinA weaker DXY merely represents its declining weight against foreign currencies. But a deeper look into the dollar shows weakening purchasing power in a high inflation environment. The consumer price index (CPI) was above 8% as of this April 2022. In result, the dollar, albeit stronger than it was a year ago, has not been able to send emerging market currencies into a tailspin, thus breaking off their widely-watched negative correlation. Notably, returns on the currencies of developing nations such as the Brazilian real and Chilean peso have been higher than the dollar since January 2022.BRL/USD and CLP/USD daily price chart. Source: TradingViewEM currencies tend to underperform when the dollar rises, mainly because investors look at the greenback as their ultimate haven in times of global market uncertainty. But with commodity prices rising due to the Ukraine-Russia crisis, investors are rethinking their strategy. Meanwhile, countries increasing their interest rates are also creating a better investment environment for their currencies, says Stephen Gallo, European head of FX strategy for BMO Capital Markets. Excerpts from his statement to the Wall Street Journal:”Emerging-market central banks are forced to tighten policy to keep pace with the Fed. It’s either that, or capital controls are imposed.”The ongoing power play between the dollar and the EM currencies has left Bitcoin (BTC) without consideration. Its value has dropped by over 50% since November 2021 and remains heavily with risk-on assets. Related: Scott Minerd says Bitcoin price will drop to $8K, but technical analysis says otherwiseBTC/USD daily price chart featuring its correlation with DXY and EUR/USD. Source: TradingViewHowever, Bitcoin’s long-standing negative correlation with the DXY has flipped to positive this week. This suggests that a further decline in the dollar markets might not necessarily trigger a BTC price recovery in the near term. As Cointelegraph reported, calls for a $20,000 macro bottom and even much lower are growing louder as Bitcoin struggles to rise back above the $30,000 mark. The views and opinions expressed here are solely those of the author and do not necessarily reflect the views of Cointelegraph.com. Every investment and trading move involves risk, you should conduct your own research when making a decision.

Čítaj viac

Bitcoin price bottom signals flash as 'fear and greed' index matches March 2020 lows

Bitcoin (BTC) has fallen by over 67% in 2022 and is now wobbling between a tight trading range defined by $28,000 as interim support and $30,500 as interim resistance.The selloff appears in the wake of the Federal Reserve’s hawkish policy and the uncertainties in the crypto market led by Terra, an algorithmic stablecoin project whose native token LUNA fell by 99% earlier in the month. Nonetheless, Bitcoin’s decline has somewhat cooled down as May draws to a close, leaving speculators with the hope that the token is in the process of bottoming out. Something like this might play out for #Bitcoin. Notice the lower left corner we had a double bottom before getting a green wave. We’re currently sitting at the bottom of the wedge. We can go a little lower and form another double bottom before reversing. pic.twitter.com/feuzp5tiDZ— BitcoinAlArab (@BitcoinAlArabx) May 23, 2022Interestingly, Bitcoin’s Fear and Greed Index (F&G) also hints at the same scenario, notes Arcane Research in its latest weekly report.Bitcoin F&G readings hit March 2020 lowsIn detail, Bitcoin’s F&G reached the score 8 on May 17, indicating “extreme fear,” a first since March 2020.”We see that buying fear has previously been a profitable strategy when measuring median and average returns of previous extreme fear periods,” Arcane wrote while citing the four instances wherein Bitcoin’s F&G had dropped to 8.Bitcoin price median returns after reaching ‘extreme fear’ levels. Source: Arcane ResearchMeanwhile, Ben Lilly, market researcher at Jarvis Labs, added that Bitcoin’s F&G index falling below ten signals the extreme possibility of the market bottoming out. He also noted that buying Bitcoin when its F&G score is below 10 is a good short-term strategy, saying:”Turns out the strategy where you hold it for less time produced greater results. Meaning the strategy where you sold after F&G rose above 35 (yellow line in the chart [below]) produced better results than a reading of 50 (orange) and 80 (red).”F&G returns for Bitcoin. Source: Ben Lilly’s Twitter HandleOn the flip side, Arcane highlighted that not all lower F&G scores have guaranteed bullish retracement moves in the past; some preceded continued selloffs. For instance, Bitcoin dropped nearly 11% on April 7, 2018, just sixty days after its F&G reached extreme fear levels.More indicators signal bottomMore signs of a possible in the Bitcoin market come from several on-chain indicators.For instance, Glassnode’s MVRZ Z-Score, which assesses when Bitcoin is undervalued/overvalued based on its “fair value,” is nearing the green zone that had preceded the crypto’s massive rebound rallies, as shown in the chart below. Bitcoin MVRV Z Score. Source: GlassnodeSimultaneously, the Long Term Output Profit Ratio (LTH-SOPR) indicator, which “evaluates the profit ratio of the whole market participants by comparing the value of outputs at the spent time to created time,” also suggests that Bitcoin is bottoming out. Specifically, when the LTH-SOPR value falls below 1, it highlights that some long-term Bitcoin holders could sell BTC at a loss. Conversely, a value above 1 shows that they could sell in profit. As of May 25, the LTH-SOPR is 0.72, which could mean a potential forming bottom in the Bitcoin market because people will be reluctant to sell BTC at a loss.Bitcoin LOTH:SOPR (SMA 7). Source: CryptoQuantSelloff warnings remain for BTCNevertheless, the uplifting bottom indicators appear in contrast to a few other bearish signs elsewhere in the market and calls for as low as $15,500 and even below $10,000. For instance, Scott Minerd, chief investment officer at Guggenheim, argues that Bitcoin is on its way to $8,000, a 70% drop from today’s price. Minerd cites a hawkish Federal Reserve for the bearish outlook on Bitcoin, whose daily correlation with Nasdaq has been positive since February 2022.BTC/USD and Nasdaq 100 correlation. Source: TradingViewFrom the technical perspective, Bitcoin could indeed fall further toward the $22,000-$26,000 range before bottoming out. Related: Bitcoin ‘death cross’ data hints 43% drop due in BTC price bear marketThese levels coincide with two historical support levels—the 200-day exponential moving average (200-week EMA; the blue wave) and the 200-day simple moving average (200-week SMA; the orange wave)—that marked the end of BTC’s previous bearish cycles.BTC/USD weekly price chart. Source: TradingView”Towards the downside, the $25,000 bottom from May 12th is the closest support level below $29,000,” further noted Arcane’s researchers Vetle Lunde and Jalan Mellerud, adding that Bitcoin’s “next critical support level” could be around $20,000, the 2017 peak. Excerpts:”Towards the upside, $30,500 has been a strong resistance area over the last week. If BTC breaks out of resistance, $35,000 is the next key resistance area.”The views and opinions expressed here are solely those of the author and do not necessarily reflect the views of Cointelegraph.com. Every investment and trading move involves risk, you should conduct your own research when making a decision.

Čítaj viac

Top 3 cryptocurrencies that are faring the best in the 2022 bear market

The crypto market has been in decline over the past six months with its valuation dropping from over $3 trillion in November 2021 to $1.23 trillion in May 2022.Fears over persistently higher inflation, the Federal Reserve’s hawkish response to it, and the ongoing conflict between Ukraine and Russia prompted investors to limit their exposure to riskier assets. Also, their increasing appetite for the safe-havens, such as the U.S. dollar, weighed down demand for some of the top cryptocurrencies and U.S. equities.As a result, some digital assets, such as Dogecoin (DOGE) and Cardano (ADA), fell by more than 80% from their record highs established last year. At the same time, a few tokens witnessed similar albeit dwarfed declines compared to other assets in the top-30. These are three among those cryptocurrencies listed in random order.Monero (-65%)Privacy-focused cryptocurrency Monero (XMR) has suffered fewer losses than its top rivals in the space since November 2021.XMR’s price dropped nearly 40% to $186 from its November 2021 peak of around $300. The plunge surfaced as a part of a broader correction move that started after Monero reached its record high in May 2021, near $520, bringing its net downside retracement to around 65%.XMR/USD weekly price chart. Source: TradingViewXMR’s limited downside prospects since November 2021 came forth amid reports that it’s been used to bypass sanctions. Meanwhile, fears of strict regulations lurking over the crypto market also appeared to have boosted the speculative demand for Monero.From a technical perspective, XMR has been consolidating in a range defined by its 50-week exponential moving average (50-week EMA; the red wave) around $211 and 200-week EMA (the blue wave) near $167, underscoring a bias conflict.UNUS SED LEO (-40%)UNUS SED LEO (LEO), a utility token backed by iFinex — the parent company of BitFinex exchange, has been largely unfazed by broader crypto trends. The token continued its uptrend even as its rivals in the top-30 moved lower after November 2021; it reached an all-time high of around $8.15 in February 2022 but has since corrected by almost 40%, now trading at around $4.90.LEO/USD weekly price chart. Source: TradingViewNotably, iFinex introduced LEO in a private token sale to raise $1 billion back in 2018. In doing so, the firm wanted to alleviate the cash shortfall it had incurred after the partial fund seizure of its payment processor, Crypto Capital.IFinex also announced that it would buy back LEO with a minimum of 27% of its consolidated revenues from the previous month, thus removing its supply from the market. In addition, the firm also committed to allocating 95% of the recovered Crypto Capital funds and 80% of the funds from the BitFinex hack in 2016 to buy LEO.LEO’s returns to date now stands around 100%. But the token appears heavily centralized, with a so-called centralized exchange whale still holding around 97% of its net supply, according to data from Santiment.Binance Coin (-53%)Like Monero, Binance Coin (BNB) topped out in early May as its price per token crossed over $700. Then in November 2021, the BNB/USD pair almost retested its record high before correcting lower with the rest of the market. In doing so, it wiped out more than half of its valuation, now trading around $325.BNB/USD weekly price chart. Source: TradingViewBNB serves as a utility token inside the Binance ecosystem, including the world’s leading crypto exchange by volume and a native blockchain named BNB Chain. The token holders also get to submit proposals via BNB Chain’s built-in governance module, which are then voted on.Other crypto assetsTop cryptos, Bitcoin (BTC), and Ethereum’s native token, Ether (ETH), have also fared better than most of their top-ranking rivals in the ongoing bear market. BTC’s price has dropped by 57% to around $29,300 from its November 2021 record high of $69,000. Meanwhile, the second-largest crypto, ETH, has plunged 60% to around $1,975 from above $4,850 in the same period.Related: Bitcoin price coma greets Wall Street open amid signs market ‘calling for rally’Shiba Inu (SHIB) and Polkadot (DOT) are down 65% from their record highs of $55 and $0.00008760, respectively.The views and opinions expressed here are solely those of the author and do not necessarily reflect the views of Cointelegraph.com. Every investment and trading move involves risk, you should conduct your own research when making a decision.

Čítaj viac

Monero enters 'overbought' danger zone after XMR price gains 75% in two weeks

Monero (XMR) price may witness a sharp pullback by June because its 75% rally in the last two weeks has left the gauge almost “overbought.”Monero price RSI meets rising wedgeDownside risks have been mounting due to XMR’s relative strength index (RSI), which almost hit 70 this May 23, indicating that the market is considered overvalued. An oversold RSI could amount to a bout of declining moves, as a rule of technical analysis.Additionally, Monero is also painting a bearish reversal pattern, dubbed the rising wedge. Rising wedges form when the price moves inside a range defined by two ascending, converging trendlines. As they do, the volumes typically decline, underscoring a lack of conviction among traders about the upside price move.Rising wedges typically resolve after the price breaks below their lower trendline, followed by an extended move downside to the level that traders locate after adding the maximum wedge’s height to the breakdown point. XMR/USD four-hour price chart featuring RSI and rising wedge setup. Source: TradingViewAs a result of this technical rule, XMR risks falling toward $138.50 by June—down nearly 30% from May 23’s price—if the breakdown point comes to be around $180 hile a breakdown move that appears near the apex point around $200 would shift the wedge’s downside target to nearly $150.A slightly bullish XMR setupConcurrent with the rising wedge, XMR has also been forming an ascending channel pattern, confirmed by at least two reactive highs and lows across the past two weeks, as shown below.XMR/USD four-hour price chart featuring ascending channel. Source: TradingViewXMR now trades in the middle of its ascending channel range, eyeing a close above $200, a historically significant support level, albeit acting as resistance. Meanwhile, the token holds its 200-4H exponential moving average (200-4H EMA; the blue wave) near $191 as its interim support.Related: Indie Russian news firm raises $250K in crypto after sanctions cripple financesIf the price breaks above $200, it would invalidate the bearish reversal setup posed by the falling wedge pattern discussed above. XMR’s decisive jump would shift its interim upside target near $220, up about 15% from May 23’s price.Conversely, failing to close above $200 would increase XMR’s risks of declining toward the $180–$175 range, marked as the “pullback target” in the chart above. The area coincides with the ascending channel’s lower trendline.The views and opinions expressed here are solely those of the author and do not necessarily reflect the views of Cointelegraph.com. Every investment and trading move involves risk, you should conduct your own research when making a decision.

Čítaj viac

Získaj BONUS 8 € v Bitcoinoch

nakup bitcoin z karty

Registrácia Binance

Burza Binance

Aktuálne kurzy