Autor Cointelegraph By Yashu Gola

Axie Infinity V-shape recovery fizzles as AXS price drops 20% from three-week high

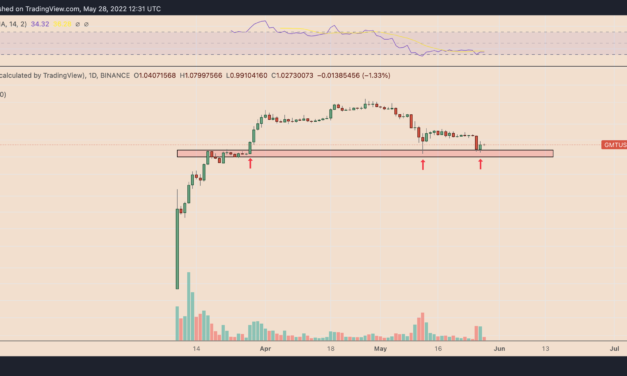
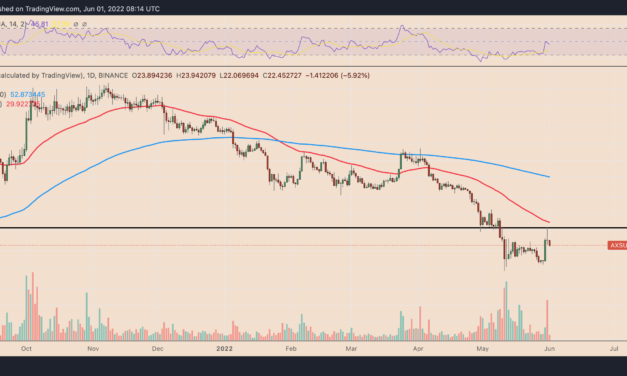
Axie Infinity (AXS) price dropped sharply on June 1, suggesting that its supersonic gains in the last two days might have been a part of a bear market rally.The AXS/USD pair soared 54% week-to-date to over $28 on May 31, its highest level in three weeks. But Axie Infinity price failed to hold the gains, correcting by more than 21% to $22 while raising the possibility of more downside to come.AXS/USD daily price chart. Source: TradingViewTrading behavior witnessed in the last 24 hours supported the downside outlook, with AXS/USD trading volume spiking during the selloff on May 31.AXS price bear trendAxie Infinity’s continued exposure to Bitcoin (BTC) and traditional stock markets was also instrumental in pushing its prices lower on June 1.Notably, AXS’s correction in the said period coincided with Bitcoin’s move lower from around $32,250 to below $31,500 and with U.S. stocks resuming their downward trajectory after the Memorial Day holiday close on May 30.AXS/USD versus SPX versus BTC/USD daily price chart. Source: TradingViewAdditionally, AXS’s price correction began near a confluence of technical resistances, containing a support-turned-resistance aroun the $27-29 region and the 50-day exponential moving average (50-day EMA; the red wave in the chart below) around $29.AXS/USD daily price chart. Source: TradingViewNo V-shape recoveryIf the pullback continues, AXS risks retesting its previous support line near $18.40, down about 20% from today’s price. Simultaneously, the persistent positive correlation with Bitcoin and stock markets could mean additional price declines below the $18.40-level. “There’s no V-shaped bottom here,” argues Michael Antonelli, managing director and market strategist at Baird, noting that the factors that led to the decline across the risk assets in 2022— primarily the interest rate hikes—are going to stay the same in the coming quarters.Related: Bitcoin’s recent gains have traders calling a bottom, but various metrics remain bearishMeanwhile, independent market analyst PostyXBT believes that AXS must close above $40 to validate a long-term bullish rebound. Until then, the AXS/USD pair remains at risk of more downside to come.”Play the relief bounces but don’t overstay your welcome,” PostyXBT told his 79,200 social media followers.The views and opinions expressed here are solely those of the author and do not necessarily reflect the views of Cointelegraph.com. Every investment and trading move involves risk, you should conduct your own research when making a decision.

Čítaj viac

Wealthy Coinbase clients are still 'hodling' Bitcoin since December 2020, data suggests

Bitcoin’s (BTC) price dropped by more than 50% after peaking out at $69,000 six months ago but the plunge did little in forcing some of its wealthiest investors into selling.Notably, the number of Bitcoin under Coinbase Custody for institutional clients rose by 296% since Q4 2020, showcasing the most investors decided to “hodl” onto their investments despite BTC price down well over 50% from its all-time highs.JUST-IN: #Bitcoin under @Coinbase Custody for institutional clients increased by 296% since Q4’20. pic.twitter.com/iILge2Cane— CryptoQuant.com (@cryptoquant_com) May 30, 2022For instance, institutions that deposited 10,939 BTC (~$335 million at today’s price) with Coinbase Custody in December 2020, when BTC/USD was around $23,000, have not moved since, on-chain data from CryptoQuant shows.Ki Young Ju, CEO of CryptoQuant, noted: “For most cases, the same amount of BTC is still in the (custodian) wallets, which flowed out from Coinbase for highly likely institutional purchases in December 2020.”Coinbase custodial wallets comparison. Source: CryptoQuant/Ki Young JuIf this is the case, then these institutions are currently sitting on 30% profits from their BTC investments. Meanwhile, their decision to not unwind their Bitcoin positions, even when BTC/USD has plummeted by more than half, underscores their strong “hodling” sentiment.That also points to institutions’ ability to withstand additional declines in the Bitcoin price, at least until it drops below the investors’ breakeven level of $23,000.Bitcoin bear market not over?Bitcoin’s price has been fluctuating inside the $29,500-$30,500 range since May 12, underscoring the market’s indecision in a higher interest rate environment.Related: On-chain data flashes Bitcoin buy signals, but the bottom could be under $20KBut several technical analysts anticipate that BTC’s price would continue its prevailing downtrend. For instance, PostyXBT, an independent market analyst, argues that the token could fall toward its 200-week moving average (the $20,000-22,000 range) next, as shown in the setup below.BTC/USDT weekly price chart. Source: PostyXBT/TradingViewMeanwhile, Popular analyst Rekt Capital adds that a drop toward the 200-week MA could also have Bitcoin form a bearish wick, which might take its price to as low as $15,500-$19,000.The views and opinions expressed here are solely those of the author and do not necessarily reflect the views of Cointelegraph.com. Every investment and trading move involves risk, you should conduct your own research when making a decision.

Čítaj viac

Ethereum sell-off fears rise as crypto hedge fund moves $60M ETH to an exchange

Ethereum’s native token Ether (ETH) rose by more than 5% to reach its intraday high above $1,930 on May 30. Nonetheless, the ETH/USD pair risks facing another sell-off round due to concerns about a massive ETH inflow into an exchange.58.7K Ether transferred to FTX in MayOn May 30, the Ether address allegedly associated with Three Arrow Capital — a Singapore-based crypto hedge fund, sent 32,000 ETH worth $60 million to the FTX crypto exchange within a span of an hour, on-chain data shows. The bulk transfer, which follows the fund’s 26,700 ETH deposit to the same exchange earlier in May, raised suspicions that it would dump the Ether stash. That is primarily because, in theory, investors transfer crypto to their exchange wallets only when they want to sell them for other assets. dump eeth? https://t.co/7xdI80P8rZ— Tim Copeland (@Timccopeland) May 30, 2022Nonetheless, the number of Ether held by exchanges continued to drop in May, according to on-chain data tracked by Glassnode. The ETH balance across all the crypto exchanges dropped from 20.45 million to 20.38 million month-to-date (MTD), underscoring that investors are holding their investments for the long term. Ethereum balance on exchanges. Source: GlassnodeETH rebound weakensThree Arrow’s massive Ether transfer to FTX coincides with ETH testing a critical support-turned-resistance level near $1,920 for a breakout, as shown below.ETH/USD four-hour price chart. Source: TradingViewSimultaneously, Ether’s relative strength index is near its “overbought” threshold of 70, which as a rule of technical analysis tends to precede a sell-off. In other words, ETH could consolidate around $1,920 in the coming days before pulling back to its rising trendline support near $1,850.Related: ‘Mega bullish signal’ or ‘real breakdown?’ 5 things to know in Bitcoin this weekConversely, a decisive move above the $1,920-level, accompanied by a rise in trading volumes, could trigger a long-term upside setup shared by “Wolf,” a pseudonymous market analyst, as shown below.ETH/USD weekly price chart. Source: Wolf/TradingViewThe setup showcases the levels around $1,820 as support in a so-called accumulation range, with $4,000 serving as resistance on the other end. Wolf noted that the price could rally toward $4,000 “a few months from the Merge,” a highly-awaited upgrade that would make Ethereum a proof-of-stake protocol.The views and opinions expressed here are solely those of the author and do not necessarily reflect the views of Cointelegraph.com. Every investment and trading move involves risk, you should conduct your own research when making a decision.

Čítaj viac

STEPN rebounds sharply after falling 80% in a month — is GMT price bottoming out?

A massive downtrend in the STEPN (GMT) prices witnessed in the last 30 days appears to be nearing exhaustion.GMT’s price has rebounded by nearly 35%—from $0.80 on May 27 to $0.99 on May 28. Interestingly, the upside retracement started after the price fell in the same range, which had acted as support before GMT’s 500% and 120% price rallies in March and early May, respectively.GMT/USD daily price chart. Source: TradingViewAdditionally, the rebound further preceded an 80% drop from its record high of $4.50, established on April 27, which left GMT oversold, per its daily relative strength index reading that slipped below the oversold threshold of 30 on May 26.The technical support, in addition to oversold RSI, suggests GMT is in the process of bottoming out.GMT price levels to watchDrawing a Fibonacci retracement graph from GMT’s $0.0099-swing low to $3.82-swing high leaves the token inside a broader consolidation range, defined by the 0.382 Fib line (near $1.50) acting as interim resistance and the 0.786 Fib line (near $0.82) serving as interim support.GMT/USD daily price chart featuring Fib support/resistance levels. Source: TradingViewTherefore, an extended rebound move from the $0.82-support level brings $1.50 into the attention as the next upside target, up about 40% from today’s price. Moreover, a strong upside follow-up could send the STEPN token towards the $2-2.50 area, suggesting that the market has bottomed out.Conversely, a weaker upside follow-up could have GMT’s price retest $0.82 for a breakdown move toward $0.54. This level was instrumental in capping the token’s downside attempts between March 17 and March 21 earlier this year.STEPN a “hype-driven speculative frenzy?”From the fundamental perspective, GMT’s bias looks skewed to the downside.First, the token continues to trade in near-perfect tandem with Bitcoin (BTC) and the other top-cap cryptocurrencies, according to their daily correlation coefficient readings, which topped 0.98 on May 21, but had subsided to 0.75 on May 28.GMT/USD and BTC/USD daily correlation coefficient. Source: TradingViewSo, if Bitcoin continues to struggle below $30,000, as many analysts believe, it could take GMT lower alongside due to its consistent positive correlation with the token.Second, GMT could drop due to the rising uncertainties surrounding STEPN’s business model, which involves paying users for exercising either by walking, jogging, or running with the native Green Satoshi Token (GST) units.Time to hit half a million followers milestone! We are giving away $1.5 million worth of NFT once we reach 500k Twitter followers (50 pairs BNBChain Genesis Sneakers):1⃣ Follow us2⃣ Retweet3⃣ Tag 3 friends & comment below pic.twitter.com/ngzXPxuXLw— STEPN | Public Beta Phase IV (@Stepnofficial) May 9, 2022Mike Fay, an independent market analyst and the author of the Heretic Speculator financial newsletter, says that STEPN’s so-called move-to-earn model is neither scalable nor sustainable in the long term.The analyst cited some core issues with the “lifestyle app.” First, STEPN has a massive entry barrier for it makes people acquire its expensive “Sneaker NFTs.” But even then, people buy these digital issues for hundreds or thousands of dollars in anticipation that they would recover their investments by earning and selling GST tokens.Many users have already recouped their money, such as YouTuber Sebbyverse, who claims that he earned $219 worth of GST tokens just by walking 15 minutes to-and-fro for dinner. Related: People want to be paid crypto to exercise in the Metaverse: Survey”The way this likely ends is with the last people who come into the platform essentially serving as ‘exit liquidity’ for the early adopters when the app’s in-game payment token (GST-USD) collapses,” Fay said while highlighting that the STEPN’s in-house token is already crashing. GST/USD daily price chart. Source: TradingViewThat would hurt users’ return on investment who paid thousands of dollars for Sneaker NFTs. So, if the demand for NFTs dries up and incentive drops, STEPN would have trouble attracting new players to its app, thus dampening demand for GMT, according to Fay. He added:”STEPN is in a hype-driven speculative frenzy and I’m not touching any of this. Not the payout token (GST-USD), the governance token GMT, or the NFTs.”The views and opinions expressed here are solely those of the author and do not necessarily reflect the views of Cointelegraph.com. Every investment and trading move involves risk, you should conduct your own research when making a decision.

Čítaj viac

3 reasons why Bitcoin is regaining its crypto market dominance

Bitcoin (BTC) is regaining its lost crypto market dominance even as it trades nearly 60% below its record highs.Bitcoin dominance at 6-month highsThe Bitcoin Market Dominance (BTC.D) index, a metric that weighs BTC’s market capitalization against the rest of the cryptocurrency market, jumped to around 47% on May 27, its highest since October 2021.Bitcoin Market Dominance daily chart. Source: TradingViewThe dominance index swelled despite the drop in Bitcoin’s market cap in the last six months from $1.3 trillion in November 2021 to nearly $550 billion in May 2022, suggesting that traders were more comfortable selling altcoins. Let’s look at three likely reasons why traders have been rotating out of the altcoin market to seek safety in Bitcoin.Ethereum “Merge” narrative is cooling downEthereum’s native token Ether (ETH), the largest alternative cryptocurrency by market cap, has witnessed consistent declines in its market dominance in the last five months—from 22.38% in December 2021 to 17.86% in May 2022.Ethereum Market Dominance daily chart. Source: TradingViewThe plunge comes after two years of a sustained uptrend, with ETH/BTC rising more than 200% between September 2019 and December 2021.As Cointelegraph reported, Ether outperformed Bitcoin in recent years, largely due to the hype surrounding its long-awaited protocol upgrade, called “the Merge,” which hopes to make Ethereum more scalable and less expensive.But the upgrade, which aims to transition Ethereum’s blockchain from proof-of-work to proof-of-stake—a counterpart known as Beacon Chain—has faced repeated delays in its launch. Only recently, Martin Köppelmann, the co-founder of the Ethereum Virtual Machine- (EVM)-compatible Gnosis chain, highlighted a seven-block reorganization on the Beacon Chain, meaning that the chain got briefly “forked” in its testing phase.The Ethereum beacon chain experienced a 7-block deep reorg ~2.5h ago. This shows that the current attestation strategy of nodes should be reconsidered to hopefully result in a more stable chain! (proposals already exist) pic.twitter.com/BkQrKuUlw1— Martin Köppelmann (@koeppelmann) May 25, 2022Ether dropped by nearly 13.5% against the U.S. dollar following the reveal on May 25 while ETH/BTC plunged to 0.059, the lowest in six months. ETH/BTC daily price chart featuring key support level. Source: TradingViewEthereum lacks narratives to drive ETH’s price upward after undergoing the Merge upgrade, noted OxHamZ, an independent market analyst, saying that investors have already “priced in” the network upgrade hype. What’s the narrative to own ETH after the merge?All KPIs are downActive wallets stagnantNFT hype deadLP trading volumes trending poorly Liquidity shrink in stablesL2 cannibalization growing (h/t @TaschaLabs)ETH is down 50% but the value of its block-space is also down— 0xHamZ (@0xHamz) May 25, 2022

LUNA to zeroBitcoin’s renewed crypto market strength also appears due to the Terra (LUNA) market’s collapse.LUNA/BTC, a financial instrument that traces the Terra token’s strength against Bitcoin, fell by 99.99% to 0.00000004 in May, which made it practically worthless. Meanwhile, LUNA declined similarly against the dollar, raising anticipations that traders dumped the token to seek safety in BTC and cash.LUNA/BTC daily price chart. Source: TradingViewLUNA’s market cap before the May’s deadly crash was $40.88 billion.Related: Crypto funds under management drop to a low not seen since July 2021Altszn ded On the whole, the altcoin market, containing everything from large-cap blockchain projects to sketchy crypto assets, has fallen by nearly 65% six months after topping out near $1.7 trillion.Altcoin market cap daily chart. Source: TradingViewA deeper look into some tokens shows that — unlike Bitcoin — most are down over 80% from their all-time highs, hinting at an overall investor exit from altcoins and into cash, stablecoins or BTC.DeFi projects and their downside retracement from record highs. Source: MessariSome dead crypto projects so far in 2022. Source: MessariThat is primarily because Bitcoin isn’t only the oldest blockchain, but stands on its own without any central authority.No one controls the #bitcoin network.— CZ Binance (@cz_binance) May 26, 2022

Historically, Bitcoin’s dominance drops during crypto bull markets as waves of new tokens spring up during the mania phase. For instance, the duration of the infamous initial coin offering (ICO) pump coincided with BTC.D dropping from nearly 96% in January 2017 to 35% in January 2018.BTC.D daily price chart. Source: TradingViewThen the March 2020 crash was the beginning of the DeFi and nonfungible token (NFT) hype, boosted further by the Federal Reserve’s quantitative easing. Therefore, if Bitcoin’s market dominance has indeed bottomed out, it could once again align with a macro bottom in Bitcoin price, and possibly the beginning of a new bull market phase in the coming months. The views and opinions expressed here are solely those of the author and do not necessarily reflect the views of Cointelegraph.com. Every investment and trading move involves risk, you should conduct your own research when making a decision.

Čítaj viac

Získaj BONUS 8 € v Bitcoinoch

nakup bitcoin z karty

Registrácia Binance

Burza Binance

Aktuálne kurzy