Autor Cointelegraph By Yashu Gola

Is Cardano ready for a go at $1? June's hard fork FOMO lifts ADA price to weekly highs

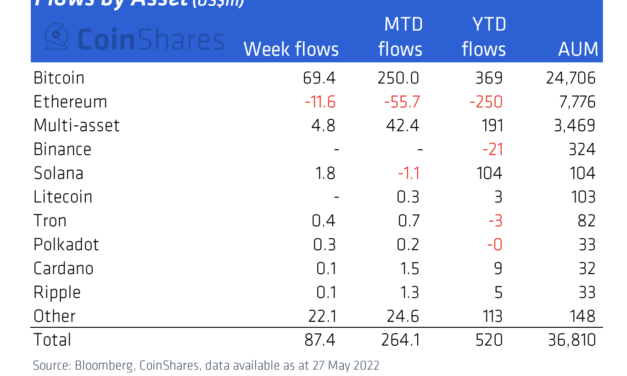
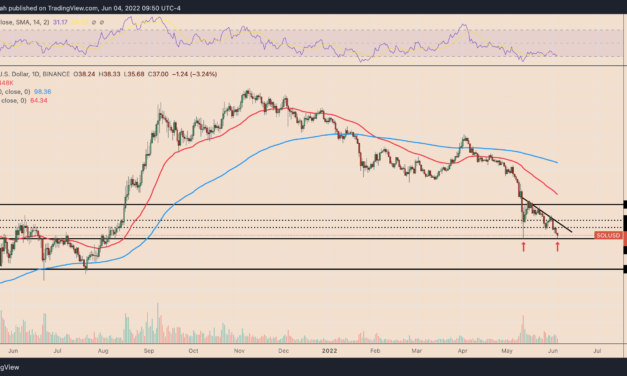
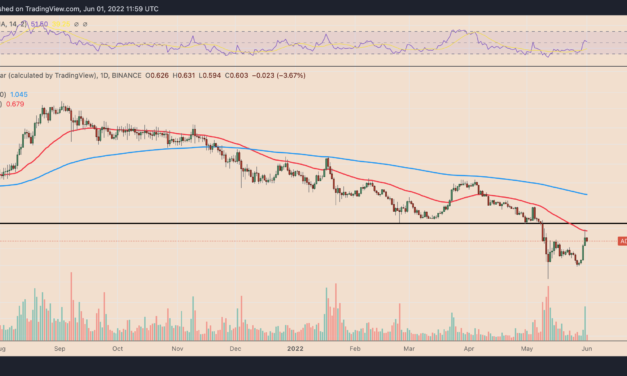
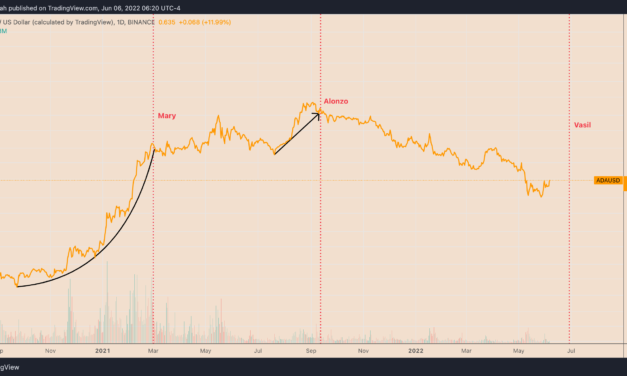
Cardano (ADA) was among the best performers among the top cryptocurrencies on June 6 as traders assessed a key upgrade that promises to enhance its blockchain’s smart contract capabilities.Vasil hard fork FOMODubbed “Vasil,” the so-called hard fork event will tentatively take place on June 29, 2022. As a result of the euphoria surrounding this upgrade, traders have started speculating more on ADA’s upside prospects, resulting in its better performance than other top-ranking digital assets.For instance, ADA’s price rose by over 14% to $0.64 on June 6 compared to the 6% gains of its top rival, Ether (ETH), on the same day.Thanks to the excitement surrounding its upcoming Vasil Hard Fork, #ADA surged over 20% to become one of the best-performing cryptos last week.Prices as of now:#ADA – $0.637400#LINK – $7.98#XLM – $0.149126#UNI – $5.34Buy/sell crypto futureshttps://t.co/QgaS0WtKde pic.twitter.com/1DWDxwFJ3Z— BTCC (@YourBTCC) June 6, 2022Cardano’s price history also shows similar euphoric behaviors among traders in the days leading up to hard fork events. For example, the “Alonzo” upgrade in September 2021, which introduced smart contract functionalities to the Cardano network, preceded a 200%-plus ADA price rally, as shown below.ADA/USD daily price chart. Source: TradingViewSimilarly, Cardano’s “Mary” hard fork in March 2021 preceded ADA’s 1,600%-plus price boom.ADA bull trapsThe previous price rallies that led to the hard fork events also occurred amid an expansionary macro-environment. At the time, interest rates were near-zero, and the Federal Reserve was buying $120 billion worth of government bonds every month.But currently, the U.S. central bank has turned hawkish after witnessing persistently higher inflation. Therefore, many analysts argue that there is now less U.S. dollar liquidity to buy riskier assets, including stocks and cryptos.Cardano has reeled under the pressure of the Fed’s tightening, with ADA trading almost 80% lower than its September 2021 peak of $3.16. The broader move downside also includes significant bounces, as shown in the chart below.ADA/USD daily price chart featuring price rebounds in ongoing bear market. Source: TradingViewADA price to $1?From the technical perspective, ADA now tests a resistance confluence comprising a falling trendline and its 50-day exponential moving average (50-day EMA; the red wave) near $0.66 and a horizontal trendline (the neckline) near $0.62 that constitutes what appears to be a “double bottom” pattern.ADA/USD daily price chart featuring ‘double bottom’ setup. Source: TradingViewA break above the resistance confluence could trigger the double bottom breakout.Related: Crypto funds under management drop to a low not seen since July 2021As a rule of technical analysis, traders measure the double bottom’s breakout target by adding the distance between the bottom levels and the neckline to the breakout point. That paints a June target of  $0.87, up around 40% from June ‘s price and likely ahead of the Vasil upgrade.A follow-up rally could also see ADA testing its 200-day exponential moving average (200-day EMA; the blue wave) near $1 for a breakout or pullback. A pullback seems more likely, however, given the prevailing macro risks.The views and opinions expressed here are solely those of the author and do not necessarily reflect the views of Cointelegraph.com. Every investment and trading move involves risk, you should conduct your own research when making a decision.

Čítaj viac

3 reasons Ethereum price risks 25% downside in June

Ethereum’s native token Ether (ETH) has dropped more than half of its value in 2022 in dollar terms, while also losing value against Bitcoin (BTC), and now remains pinned below $2,000 for several reasons. What’s more, ETH price could face even bigger losses in June due to another slew of factors, which will be discussed below. Ethereum funds lose capital en masseInvestors have withdrawn $250 million out of Ethereum-based investment funds in 2022, according to CoinShares’ weekly market report published May 31.The massive outflow appears in contrast to other coins. For instance, investors have poured $369 million into Bitcoin-based investment funds in 2022. Meanwhile, Solana (SOL) and Cardano (ADA), layer-one blockchain protocols competing with Ethereum, have attracted $104 million and $9 million, respectively.Flow into/from crypto funds (by assets). Source: CoinShares/BloombergThe withdrawals from Ethereum funds are a sign of how the recent crash in TerraUSD (UST) and LUNA—tokens within Terra’s algorithmic stablecoin ecosystem—has dampened interest in the overall DeFi sector. ETH’s bullish prospects remain glued to anticipations of a boom in the DeFi market, because Ethereum’s blockchain host a majority of financial applications in the sector. As of June 5, the total valued locked (TVL) inside the Ethereum-based apps was $68.71 million, almost 65% of the total DeFi TVL.Ethereum TVL as of June 5. Source: DeFi LlamaBut the TVL still reflects a massive retreat from Ethereum’s DeFi pools, which, before LUNA and UST’s collapse on May 9 was hovering around $100 billion.With macro risks led by the Federal Reserve’s hawkish policies, coupled with a cautious outlook around the DeFi sector, Ether looks poised to continue its decline in June, according to Ilan Solot, a partner at Tagus Capital. He told the Financial Times:If the Federal Reserve is tightening, the world is in recession, and people need to pay $4.5 per gallon of gas, they’ll have less to invest in DeFi or spend on blockchain gamesSluggish technicalsTrading behavior witnessed since May also paints a bearish outlook for Ethereum.In detail, Ether has been fluctuating inside a range defined by a horizontal trendline support and a falling trendline resistance. The pattern looks more or less like a “descending triangle,” a bearish continuation pattern when formed during a downtrend.Related: Total crypto market cap risks a dip below $1 trillion if these 3 metrics don’t improveAs a rule of technical analysis, descending triangles resolve after the price breaks decisively below their support trendline and then falls by as much as the triangle’s maximum height. Ether risks undergoing a similar downside move in June, as shown in the chart below.ETH/USD daily price chart featuring ‘descending triangle’ setup. Source: TradingViewIf ETH’s price breaks below the triangle’s lower trendline, it risks falling toward $1,350 in June, down about 25% from today’s price.ETH reserves on exchanges are increasingThe total number of Ether balances at crypto exchanges globally has increased by 550,459 ETH since May, data from CryptoQuant shows. That amounts to almost $950 million worth of inflows into the exchanges’ hot wallets since the beginning of the Terra debacle.Ethereum exchange reserves. Source: CryptoQuantTypically, traders send tokens to exchanges when they want to trade them for other assets. Thus, selling pressure would likely increase if the downtrend in ETH reserves on exchanges begins to reverse.The views and opinions expressed here are solely those of the author and do not necessarily reflect the views of Cointelegraph.com. Every investment and trading move involves risk, you should conduct your own research when making a decision.

Čítaj viac

Is Solana a 'buy' with SOL price at 10-month lows and down 85% from its peak?

Solana’s (SOL) price dropped on June 3, bringing its net paper losses down to 85% seven months after topping out above $260.SOL price fell by more than 6.5% intraday to $35.68, after failing to rebound with conviction from 10-month lows.  Now sitting on a historically significant support level, the SOL/USD pair could see an upside retracement in June, eyeing the $40-$45 area next, up around 25% from today’s price.SOL/USD daily price chart. Source: TradingView60% SOL price decline ahead?However, a rebound scenario is far from guaranteed and Solana faces headwinds from trading in lockstep with Bitcoin (BTC), the top cryptocurrency (by market cap) that typically influences trends across the top altcoins. Notably, the weekly correlation coefficient between BTC and SOL was 0.92 as of June 4.SOL/USD versus BTC/USD correlation coefficient. Source: TradingViewWhat’s more, Solana is likely to see even bigger losses than BTC if Bitcoin falls deeper below its current psychological support level of $30,000.Meanwhile, the Federal Reserve looks determined to raise benchmark interest rates and reduce its balance sheet. As a result of this hawkish policy, riskier assets like Bitcoin have room to go lower, hurting Solana’s bullish prospects. Breaking below SOL’s current support level—around $35—raises the chances for a decline toward the $18-25 range, which acted as a strong support area in March-July 2021, and preceded a 1,200% price rally, as shown below.SOL/USD weekly price chart. Source: TradingViewThis bearish scenario would put SOL almost 60% below today’s price.Solana network outagesThe bearish outlook for SOL also comes as the Solana blockchain faces repeated outages, thus leaving its network practically unusable for its key “dapps,” including lending protocol Solend and decentralized exchange Serum, for hours.Solana’s latest software glitch appeared on June 1 that shut down the network for 4.5 hours. The blockchain’s biggest outage happened in January and was down for almost 18 hours.Validator operators successfully completed a cluster restart of Mainnet Beta at 9:00 PM UTC, following a roughly 4 and a half hour outage after the network failed to reach consensus. Network operators an dapps will continue to restore client services over the next several hours.— Solana Status (@SolanaStatus) June 1, 2022The outages risk spooking investors to the benefit of Solana’s competition and have already coincided with several traders rotating their capital elsewhere.Just sold all of my $SOL for $ADA. Solana is a great project but personally I cant in good faith continue to invest in a layer 1 that shuts down on a frequent basis (partial and major outages about 11 times).#ADA #Cardano— $Smac07_NFT$ (@Shawn_Deezy07) May 31, 2022

Miles Deutscher, an independent market analyst, believes crypto investors have become cautious after witnessing the recent Terra fiasco. Nonetheless, the analyst asserts that Solana’s outages would decrease over time as the network matures.Related: Alchemy announces support for Solana Web3 applications the day after blockchain halted”But if they fail to stifle such events, then other L1s [layer-1 blockchains] will continue to eat away at its market share,” he noted.8/ However, the reasons I like Solana still stand: • Scales using a single global state (liquidity isn’t fragmented). • Low cost and fast (despite handling the most transactions of any chain). • 3rd most developed on chain (Electric Capital)• Large list of VC backers— Miles Deutscher (@milesdeutscher) June 2, 2022

The views and opinions expressed here are solely those of the author and do not necessarily reflect the views of Cointelegraph.com. Every investment and trading move involves risk, you should conduct your own research when making a decision.

Čítaj viac

These are the least 'stable' stablecoins not named TerraUSD

The recent collapse of once the third-largest stablecoin, TerraUSD (UST), has raised questions about other fiat-pegged tokens and their ability to maintain their pegs.Stablecoins’ stability in questionStablecoin firms claim that each of their issued tokens is backed by real-world and/or crypto assets, so they behave as a vital component in the crypto market, providing traders an alternative to park their cash between placing bets on volatile coins. They include stablecoins that are supposedly 100% backed by cash or cash equivalents (bank deposits, Treasury bills, commercial paper, etc.), such as Tether (USDT) and Circle USD (USDC). At the other end of the spectrum are algorithmic stablecoins. They are not necessarily backed by real assets but depend on financial engineering to maintain their peg with fiat money, usually the dollar. UST/USD daily price chart. Source: TradingViewHowever, following the collapse of UST—an algorithmic stablecoin, that stability is now in doubt. The distrust has led to massive outflows from both asset-backed and algorithmic stablecoin projects. For instance, the market capitalization of USDT has fallen from $83.22 billion on May 9—the day on which UST started losing its U.S. dollar peg—to $72.49 billion on June 2.USDT drifted from its one-to-one dollar parity while suffering outflows, albeit briefly. Unfortunately, that is not the case with algorithmic stablecoins; some are still trading below their intended fiat pegs, as discussed below.USDXUSDX, the Kava Network’s native “decentralized” stablecoin, was notorious for mostly trading 2-4 cents below the dollar. But, it moved further away from its near-perfect peg with the greenback amid the TerraUSD debacle.In detail, USDX dropped to its lowest level on record—at $0.66—on May 12. The USDX/USD pair has been attempting to reclaim its dollar peg ever since and was changing hands for around $0.89 on June 2, as shown below.USDX price chart year-to-date. Source: CoinMarketCapSimultaneously, USDX has witnessed outflows worth $60 million since May 9, illustrating that traders are redeeming their tokens.Kava Labs, the development team behind Kava Network, noted that USDX lost its dollar peg due to its exposure to UST as one of its collaterals. Meanwhile, a decline across USDX’s other reserve assets, including KAVA, Cosmos (ATOM), and Wrapped Bitcoin (WBTC), also shook its stability.1/ $UST has (obviously) significantly de-pegged and has promulgated some risk to downstream protocols that use it. The UST risk in Kava is isolated and can be tolerated with current system parameters.— Scott Stuart (@Scott_Stuart_) May 11, 2022In May, Scott Stuart, the co-founder and CEO of Kava Labs, asserted that USDX would retain its dollar peg after they flush out UST out of their ecosystem.VAIVAI is another victim of the ongoing stablecoin market rout.The algorithmic stablecoin, built on the Binance Smart Chain-based Venus Protocol — a lending platform, traded for $0.95 this June 2. However, like USDX, the token is notorious for trading below its intended dollar peg since launch. Related: DeFi protocols launch stablecoins to lure new users and liquidity, but does it work?For instance, in September 2021—long before the TerraUSD’s collapse, VAI had dropped as low as $0.74. In addition, the de-peg scenario occurred after Venus Protocol suffered a $77 million loss on bad debts in May 2021 due to large liquidations in its lending platform.VAI price chart to date. Source: CoinMarketCapThe market cap of VAI was $272.84 million in May 2021. But after the Venus debt fiasco, coupled with TerraUSD’s collapse, VAI’s net valuation dropped to almost $85 million, suggesting a substantial plunge in its demand.Some stable exceptionsDAI, an algorithmic stablecoin native to Maker—a peer-to-contract lending platform, performed exceptionally well versus its rivals, never fluctuating too far from its promised dollar peg even though witnessing a 20% decline in its market capitalization since May 9.DAI market cap year-to-date. Source: CoinMarketCapFRAX and MAI, other algorithmic stablecoin projects, also maintained their dollar peg during TerraUSD’s crash. The views and opinions expressed here are solely those of the author and do not necessarily reflect the views of Cointelegraph.com. Every investment and trading move involves risk, you should conduct your own research when making a decision.

Čítaj viac

Cardano price fake-out? ADA's 45% rebound in two days could trap bulls

Cardano (ADA) price climbed from $0.48 on May 30 to as high as $0.68 on May 31—a 45% rally in less than 48 hours. But ADA/USD failed to extend its rally further upward and dropped by almost 13.75% from its weekly high.ADA price: Ear market vibesCardano’s price retreated sharply on June 1, giving up a portion of the gains secured in the previous two days. The question now arises whether the ADA/USD pair can extend its recovery trend, especially as it trades almost 80% below its September 2021 peak of $3.16.Interestingly, the downside retracement began after ADA tested its 50-day exponential moving average (50-day EMA; the red wave in the chart below) as resistance. Also, the pair moved lower in tandem with a broader correction sentiment across riskier assets, including Bitcoin (BTC) and the S&P 500 (SPX).ADA/USD daily price chart. Source: TradingViewNow, the Cardano token risks a further price correction, according to the Digital Trend, a financial analysis contributor at SeekingAlpha, noting that ADA has seen sharp price rebounds in the past that turned into bull traps, adding:”In March, we saw ADA go from south of $0.80 to over $1.24 in a couple of weeks. This, to me, looks like another fake-out.”Several fundamental factors also support a bearish outlook. On June 1, the Federal Reserve will begin unwinding its $9 trillion asset portfolio, likely creating more headwinds for risk-on assets, Cardano included.1/16Today it begins.Quantitative Tightening.So what does it mean? Is it a straight down market? Do we know its all good if nothing bad happens the first day?How do you navigate this?— Adam Cochran (adamscochran.eth) (@adamscochran) June 1, 2022″I don’t think we know the impacts of QT [quantitative tightening] just yet, especially since we haven’t done this slimming down of the balance sheet much in history,” Dan Eye, the chief investment officer of Fort Pitt Capital Group, told Market Watch, adding that removing liquidity from the market would “affect multiples in valuations to some degree.”Cardano price paints bull pennantFrom a technical perspective, Cardano could continue its recovery trend in June due to a bullish continuation pattern.Related: Bitcoin’s recent gains have traders calling a bottom, but various metrics remain bearishADA has been consolidating inside what appears to be a “bull pennant,” confirmed by the price fluctuating inside a triangle structure following a massive move upside, called “flagpole.” As a rule, a bull pennant resolves after the price breaks above its upper trendline and rises by as much as the flagpole’s height.ADA/USD hourly price chart featuring ‘bull pennant’ setup. Source: TradingViewIn other words, a $0.77 bullish target in June, up more than 25% from June 1’s price.ADA/BTC sees a similar upside setupADA has been painting a similar bull pennant setup against Bitcoin, raising the chances of an uptrend for the ADA/BTC pair in June.ADA/BTC hourly price chart featuring ‘bull pennant’ setup. Source: TradingView.comAs a result, ADA/BTC’s decisive breakout above the pennant’s upper trendline could have it rise toward 0.00002355, up 23% from June 1’s price.The views and opinions expressed here are solely those of the author and do not necessarily reflect the views of Cointelegraph.com. Every investment and trading move involves risk, you should conduct your own research when making a decision.

Čítaj viac

Získaj BONUS 8 € v Bitcoinoch

nakup bitcoin z karty

Registrácia Binance

Burza Binance

Aktuálne kurzy