Autor Cointelegraph By Yashu Gola

DeFi contagion? Analysts warn of ‘Staked Ether’ de-pegging from Ethereum by 50%

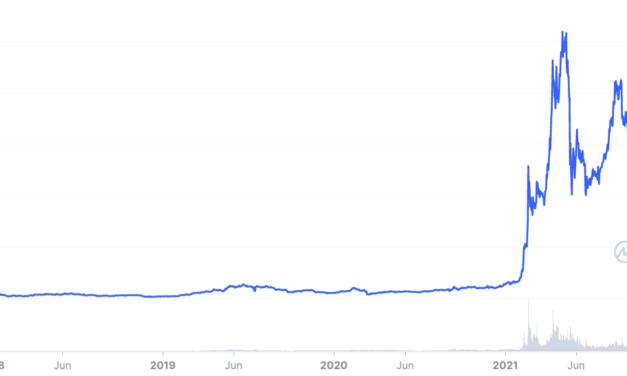
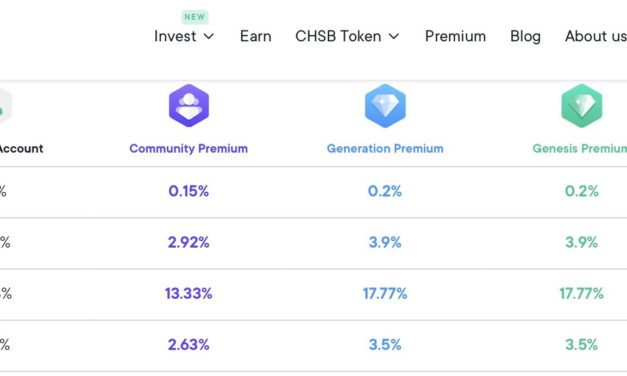
The next big crypto crash could be around the corner due to Lido Staked Ether (stETH), a liquid token from the Lido protocol that is supposed to be 100% pegged by Ethereum’s native token, Ether (ETH).Notably, the stETH peg could drop against ETH by 50% in the coming weeks, raising the risk of a “DeFi contagion” as Ethereum moves toward proof-of-stake (PoS), argues popular Bitcoin investor and independent analyst Brad Mills.Over 1M Ether liability risks defaultIn detail, investors deposit ETH in Lido’s smart contracts to participate in The Merge, a network upgrade aiming to make Ethereum a proof-of-stake blockchain, also called the Beacon Chain. As a result, they receive stETH representing their staked ETH balance with Lido.Users will be able to redeem stETH for unstaked ETH when Beacon Chain goes live. In addition, they can use stETH as collateral to borrow or provide liquidity using various decentralized finance (DeFi) platforms to earn yield.But, if the switch to Eth2 gets delayed, this could cause a massive liquidity problem across DeFi platforms, Mills asserts, using Celsius Network, a crypto lending platform that offers up to 17% annual percentage yields, as an example.“If customers start withdrawing from Celsius, they will have to sell their stETH,” Mills explained. “Celsius has liabilities of 1 million ETH. So, 288k are inaccessible until [the] Merge, ~30K are lost, ~445k are stETH, and 268k are liquid. Could cause a run.”Regardless of unverified rumors that Celsius could be insolvent, the best way to secure your funds is to control your own private keys. He adds: “stETH might not ‘depeg,’ but the risk of DeFi contagion in a crypto bear market is high.”Contagion risks?Moreover, even centralized yield platforms could face insolvency risks due to their ETH liabilities, argues market commentator Dirty Bubble Media (DBM), citing crypto asset management service Swissborg as an example.Swissborg offers daily yield on about $145 million worth of Ether it holds, including 80% exposure in stETH.Swissborg’s daily yield offerings. Source: Official WebsiteThe firm had staked around 11,300 ETH out of its total Ether holdings in Curve’s stETH/ETH pool. Then the ETH peg became imbalanced on May 12 in the wake of Terra’s collapse, with stETH/ETH dropping to 0.955 on the day.Staked Ether to Ethereum exchange ratio in 2022. Source: CoinMarketCap“How is Swissborg paying daily yield on these assets, when the yield from staked Ether is locked along with the principal,” questioned DBM, adding that it could have the firm “exit their entire stETH position,” thus forcing its ETH peg even lower.Meanwhile, the warnings coincided with a whale dumping its staked Ether positions for ETH on Wednesday.Battening down the hatches before ropsten. pic.twitter.com/MPQV5n0XMf— Hsaka (@HsakaTrades) June 8, 2022Mills responded, saying that stETH’s “dynamic is no different than GBTC at a perma-discount.” In other words, sell pressure can be “merciless” once the market flips bearish and yields vanish. He explained:“When there’s deep liquidity & potential to arbitrage, quants, Wall Street raccoons [and] flashbois will milk the yield. When the strategy goes against them, they will add merciless sell pressure.”As of Thursday, the stETH/ETH ratio had recovered to 0.97, still 3% below its intended peg.The views and opinions expressed here are solely those of the author and do not necessarily reflect the views of Cointelegraph.com. Every investment and trading move involves risk, you should conduct your own research when making a decision.

Čítaj viac

Ethereum 'double doji' pattern hints at a 50% ETH price rally by September

Ethereum’s native token, Ether (ETH), looks poised to undergo a sharp upside retracement in the coming weeks after painting a so-called “double doji” pattern, accompanied by a few bullish technical indicators.Ether strong support confluence meets dojisTo recap, a doji is a candlestick that forms when a financial instrument opens and closes around the same level on a specified timeframe, be it hourly, daily, or weekly. From a technical perspective, doji represents indecision in the market, meaning a balance of strength between bears and bulls.So, if a market is trending downwards when doji appears, traditional analysts view it as a sign of slowing selling momentum. As a result, traders may look at doji as a sign to existing their short positions or open new long positions in anticipation of a price reversal.Meanwhile, a double doji shows a continued state of bias conflict among traders, which could result in the price breaking out in either direction. With ETH/USD forming a similar pattern on its weekly chart, the token looks ready to log strong trend-defining moves in the coming sessions. ETH/USD weekly price chart featuring two Doji formations in a row. Source: TradingViewSome of Ether’s technicals favor a decisive rebound move, beginning with its 200-week exponential moving average (200-day EMA; the blue wave in the chart above) near $1,625, which has served as a strong support level in May 2022.Next, Ether gets another concrete price floor in the $1,500-$1,700 range, which was instrumental in capping the token’s bearish attempts between February and July 2021. Coupled with double doji, these technical indicators anticipate a price rebound ahead.A 50% ETH rally ahead?If ETH price rebounds as described above, then the next bullish target is the 0.5 Fib line (near 2,120) of the Fibonacci retracement graph, drawn from the $85-swing low to the $4,300-swing high.ETH/USD weekly price chart featuring Fib support and resistance targets. Source: TradingViewThat would mark a 20% upside move. Meanwhile, an extended move above the 0.5 Fib line could have traders eye the 0.382 Fib line near $2,700 as their next upside target, a level coinciding with ETH’s 50-week EMA (the red wave), by the end of September 2022.This would be a nearly 50% price rally.Related: 3 reasons why Ethereum price is pinned below $2,000Conversely, if the double doji pattern resolves in a breakdown below the support range, it could push Ether toward $1,400. This level coincides with ETH’s 2018 top and was instrumental as a support in February 2021, as shown below.ETH/USD weekly price chart. Source: TradingViewA decisive breakdown below $1,400 then opens the door to the 0.786 Fib line near $1,000 as the next downside target.The views and opinions expressed here are solely those of the author and do not necessarily reflect the views of Cointelegraph.com. Every investment and trading move involves risk, you should conduct your own research when making a decision.

Čítaj viac

Sold your SOL? Solana price eyes 35% jump as two technical signals flip bullish

At least two technical indicators show Solana (SOL) could undergo a sharp price recovery in June, even after the SOL/USD pair’s 78.5% year-to-date decline.SOL price nears bullish wedge breakoutFirst, Solana has been painting a “falling wedge” since May, confirmed by its fluctuations inside two descending, converging trendlines. Traditional analysts consider falling wedges as bullish reversal patterns, meaning they resolve after the price breaks above their upper trendlines.As a rule of technical analysis, a falling wedge’s profit target is measured after adding the maximum distance between its upper and lower trendlines to the breakout point. So depending on SOL’s breakout level, its price would rise by roughly $20, as shown below.SOL/USD daily price chart featuring “rising wedge” breakout setup. Source: TradingViewThat puts the SOL’s price target at $58 if measured from the current price, or about 35% higher. But if the price retreats after testing the wedge’s upper trendline and continues to fluctuate inside its range, SOL’s profit target would keep getting lower.The Solana token can rise at least to $44 after breaking out of its wedge pattern.Bullish divergenceMore upside cues for Solana come from a growing separation between its price and momentum trends.In detail, SOL’s recent downside moves accompany an upside retracement in the readings of its daily relative price index (RSI), a momentum oscillator that detects an asset’s overbought ( >70) and oversold (SOL/USD daily price chart featuring price-momentum divergence. Source: TradingViewThis situation, otherwise known as “bullish divergence,” shows that bears are losing control and that bulls would capture the market again.Solana still faces bearish risksFinancial market veteran Tom Bulkowski believes falling wedges are poor bullish indicators, however, with a higher breakeven failure rate of 26%. Meanwhile, there is only a 64% chance that a falling wedge would meet its profit target, which leaves Solana with the possibility of continuing its downtrend.Related: Solana developers tackle bugs hoping to prevent further outagesBulkowski asserts:”The only variation that works well is a downward breakout in a bear market.”Fundamentals around Solana agree with a downside outlook. They include a hawkish Federal Reserve and the negative impact of their tightening on riskier assets, including cryptos and equities. As a result, SOL could move lower under the said macro risks, with its next potential downside target in the $19-$25 area, as shown below.SOL/USD weekly price chart. Source: TradingViewThis range was instrumental as support in the March-July 2021 session.The views and opinions expressed here are solely those of the author and do not necessarily reflect the views of Cointelegraph.com. Every investment and trading move involves risk, you should conduct your own research when making a decision.

Čítaj viac

BNB price risks 40% drop as SEC launches probe against Binance

Binance Coin (BNB) price dropped by nearly 7.3% on June 7 to below $275, its lowest level in three weeks.What’s more, BNB price could drop by another 25%-40% in 2022 as its parent firm, Binance, faces allegations of breaking securities rules and laundering billions of dollars in illicit funds for criminals.Two bad news in a rowBNB was issued as a part of an initial coin offering (ICO) in 2017 that amassed $15 million for Binance. The token mainly behaves as a utility asset within the Binance ecosystem, primarily enabling traders to earn discounts on their trading activities. Simultaneously, BNB also functions as a speculative financial asset, which has made it the fifth-largest cryptocurrency by market capitalization. BNB market capitalization was $45.42 billion as of June 7. Source: CoinMarketCapAs a result, the U.S. Securities and Exchange Commission (SEC) is investigating whether the ICO of BNB tokens in 2017 was sales of securities that should have been registered with the regulator, according to sources contacted by Bloomberg.So, will all exchanges including binance delist $BNB like they did with $XRP?— Crypto Mark ❄️ (@MarkCrypto8) June 6, 2022This risks putting downward pressure on BNB’s price, which has already lost more than half of its value after peaking out in May 2021 at around $700.BNB holds above May-July 2021 supportIn addition to the bad news, BNB’s plunge also came as a part of a broader correction trend elsewhere in the crypto market, with top coins Bitcoin (BTC) and Ether (ETH) dipping by 7% and 7.25% on the same day. $BNB aggressively shorted because of the FUD. pic.twitter.com/BzvGtPcK3d— Byzantine General (@ByzGeneral) June 6, 2022

Now, BNB tests the 61.8 Fib retracement level (near $274) of the Fibonacci retracement graph sketched from its $10-swing low to $700-swing high. Interestingly, the same level was instrumental as support during the May-July 2021 session that preceded a 170% price rally.But weak fundamentals, including the Federal Reserve’s hawkish policy, have raised BNB’s possibility of dropping below the 61.8 Fib line. Related: The crypto market dropped in May, but June has a silver liningIf this happens, then BNB’s next downside target could be its 200-week exponential moving average (200-week EMA; the blue wave) near $200, down about 25% from today’s price. The BNB/USD pair’s weekly relative strength index (RSI), now at 34, also shows more room to drop until the reading hits 30, an oversold level that indicates buying sentiment.BNB/USD weekly price chart. Source: TradingViewMeanwhile, a further drop below the 200-week EMA could have BNB eye the 0.786 Fib line near $160 as its support, down by 40% from today’s price.Conversely, if BNB manages to hold strong above $274, it could rebound toward the area defined by its 0.5 Fib line around $355 and its 50-week EMA (the red wave) near $380, up over 20% from the current price level.The views and opinions expressed here are solely those of the author and do not necessarily reflect the views of Cointelegraph.com. Every investment and trading move involves risk, you should conduct your own research when making a decision.

Čítaj viac

Avalanche price eyes 30% jump in June with AVAX's classic bullish reversal pattern

Avalanche (AVAX) shows signs of continuing its ongoing rebound move as it paints a classic bullish reversal pattern.AVAX price to $35?Dubbed as “double bottom,” the pattern appears when the price establishes a support level, rebounds, corrects after finding a resistance level, pulls back toward the previous support and bounces back toward the resistance level to pursue a breakout.Since May 27, AVAX’s price trends appear like those typically witnessed during the double bottom formation. Specifically, the AVAX/USD pair on the four-hour chart has bounced twice after testing the same support level near $22.25, and now eyes a breakout above its resistance level — also called “neckline” — near $27.50.AVAX/USD four-hour price chart with “double bottom'”setup. Source: TradingViewIf AVAX breaks above $27.50 decisively, and preferably in trading volumes, then the upside target would be at length equal to the maximum distance between the double bottom’s support and neckline levels.That would put the Avalanche token en route toward $35, up 30% from Jun’s price.Conflicting bearish scenarioAvalanche currently trades almost 82% below its record peak of around $151, established in November 2021. During its correction, the AVAX/USD pair formed multiple consolidation channels but broke out of them to extend its downtrend further, which could spoil the bullish scenario outlined above. Zooming out to the daily timeframe, and AVAX has been consolidating inside a similar channel since May 2022, fluctuating between falling trendline resistance and horizontal trendline support. When placed together, these trendlines form a “descending triangle,” which traditional analysts consider a continuation pattern.AVAX/USD daily price chart. Source: TradingViewTherefore, AVAX risks breaking out of the descending triangle in the coming days, with its bias skewed to the downside. Meanwhile, in a “perfect” scenario, the token will fall by as much as the descending triangle’s height, when measured from the breakout point.Related: The crypto market dropped in May, but June has a silver liningThat puts AVAX’s descending triangle near $13.25, almost 50% below June 6’s price.The views and opinions expressed here are solely those of the author and do not necessarily reflect the views of Cointelegraph.com. Every investment and trading move involves risk, you should conduct your own research when making a decision.

Čítaj viac

Získaj BONUS 8 € v Bitcoinoch

nakup bitcoin z karty

Registrácia Binance

Burza Binance

Aktuálne kurzy