Autor Cointelegraph By Yashu Gola

Ethereum sell-off resumes with ETH price risking another 25% decline in June

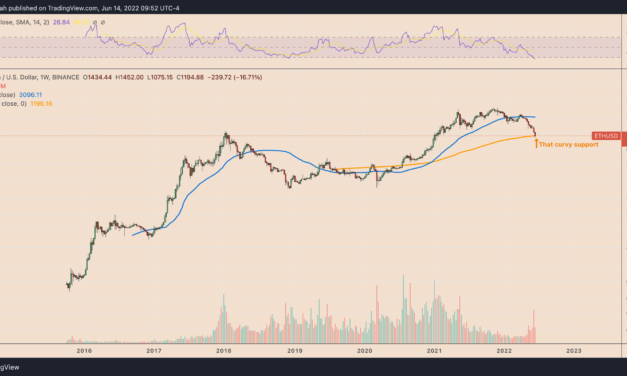
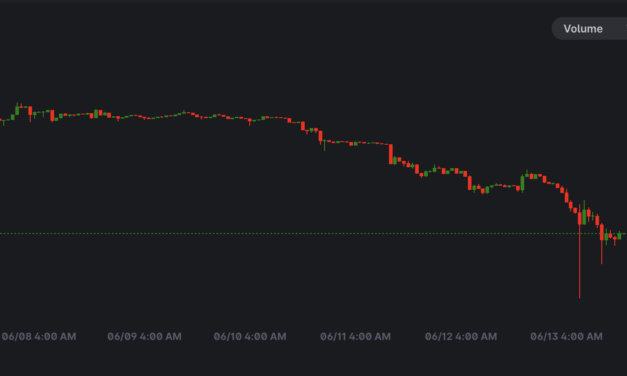
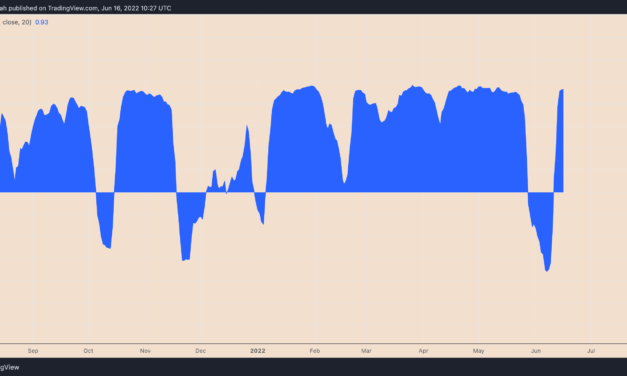
Ethereum’s native token Ether (ETH) slumped on June 16, suggesting that its relief rally coinciding with the Federal Reserve announcing it will hike the benchmark rate by 0.75%, is at risk.Ether bulls trapped?Ether’s price slipped by 9.2% to around $1,120 per token a day after it rebounded by 23% after dropping to almost $1,000, its worst level since January 2021. The ETH/USD pair’s upside move, followed by a sharp correction, appeared in tandem with U.S. stocks, confirming that it traded like a risk-asset.ETH/USD and Nasdaq daily correlation coefficient. Source: TradingViewThe decline means that Ether has shed 77% of its value since November 2021 and is now trading below its “realized price” of $1,740, data from Glassnode shows. Ethereum realized price (USD). Source: GlassnodeIn addition, a higher interest rate environment adds more selling pressure, with investors leaving high-risk trades and seeking safety in traditional hedging assets, such as cash. Investors’ faith in cryptocurrencies has also eroded following the collapse of Terra, a $40 billion algorithmic stablecoin project, and lending platform Celsius Network’s decision to halt withdrawals. Atop that, Three Arrow Capital, a crypto hedge fund that oversaw nearly $10 billion in May 2022, reportedly faces insolvency risks. Fears about systemic risks have further limited the crypto market’s recovery bias, hurting Ether.ALERT: 3AC $250 Million $ETH Position Will Be Liquidated at ≈1000— Market Meditations (@MrktMeditations) June 15, 2022From a technical perspective, Ether’s recent gains look like a bear market rally, which could be due to investors covering their short trades.In detail, investors close their short positions by buying the underlying asset back on the market—typically at a price lesser than the one at the time of borrowing—and returning them to the lender. That prompts the asset to rally between large downside moves, but it does not signify a bullish reversal. Related: Bitcoin is the ‘Amazon of crypto’ and everything else are bets, says Blocktower founderThese minor rallies could be a bull trap for investors that mistakenly see the rebound as a sign of bottoming out. On the other hand, experienced bears utilize the pump to open new short positions at the local price top, knowing that nothing has fundamentally changed about the market.ETH “bear pennant” hints at more losses aheadEther’s “bear pennant” on shorter-timeframe charts also supports a bull trap scenario.Bear pennants are bearish continuation patterns that form as the price consolidates inside a triangle-shaped structure after a strong downside move. As a rule of technical analysis, traders measure a bear pennant’s profit target by subtracting the breakdow point from the height of the previous decline (called “flagpole”), as shown below.ETH/USD four-hour price chart featuring “bear pennant.” Source: TradingViewThi puts the next bear target for ETH price at $850, down almost 25% from today’s price.The views and opinions expressed here are solely those of the author and do not necessarily reflect the views of Cointelegraph.com. Every investment and trading move involves risk, you should conduct your own research when making a decision.

Čítaj viac

NEXO price drops 40% in three days on rumors of ties to 'insolvent' crypto fund

The price of Nexo (NEXO) continued to fall on June 15 as crypto lending firms continue to be shaken by the falling cryptocurrency market.Meanwhile, Nexo has denied rumors of exposure to Three Arrows Capital (3AC), a Dubai-based crypto fund facing insolvency risks.NEXO price suffers on DeFi contagion fears NEXO, which serves as a security token at a cryptocurrency lending platform of the same name, fell nearly 25% to $0.61 a unit, its lowest price reading since January 2021. The massive intraday decline came as a part of a broader downside move this week, which stretched NEXO’s losses to 40%.NEXO/USDT weekly price chart. Source: TradingViewAn ongoing contagion in the crypto lending sector contributed to NEXO’s underperformance. Traders fear that most DeFi/CeFi firms, which offer high yields to clients on their cryptocurrency deposits, will default on their debts due to the wipeout of nearly $1.5 trillion from the crypto market in 2022. The concerns continue to mount after the collapse of Terra, a $40 billion algorithmic stablecoin project, in May.A month later, Celsius Network, which offers clients up to 18% yields, paused withdrawals due to “extreme market conditions.” Its clients have pulled almost half of their assets out of the platform since October 2021, thus leaving it about $12 billion as of May 17 to meet debt obligations.I am definitely rooting for Celsius not to get liquidated. That is customer money. And fuck the funds who are hunting this stop loss. I hope they get rekt. #bitcoin— Lark Davis (@TheCryptoLark) June 14, 2022Meanwhile, 3AC, a crypto hedge fund, has witnessed liquidations of at least $400 million. In addition, on-chain data reveals that the firm may also have a minimum debt of $183 million against a collateral position of $235 million (derived in Staked Ether).The address uses USDT/USDC to repay the debt and withdraws ETH, and then converts ETH to USDT/USDC through “sinofate.eth” and repays it, and so on. In almost 24 hours, the address has sold about 50kETH. https://t.co/TUzqXBXBwF— Wu Blockchain (@WuBlockchain) June 15, 2022

The fund could transfer the economic risks to its lenders if it becomes insolvent.”The lenders will bear the PnL [profit and loss] difference between how much they are owed versus what they get in liquidating their collateral,” noted Degentrading, a market commentator known for highlighting the Celsius Network’s liquidation issues.He added:”That means defaults will cause SIGNIFICANT EQUITY erosion […] Not all lenders are made equal. Celsius is the worst. It has gone under. Nexo, I don’t know. BlockFi is pretty bad as well.”However, Nexo says it currently has no exposure to 3AC despite partnering with the fund over a nonfungible token (NFT) lending product in December 2021. The firm asserts that the partnership with 3AC did not take off.All Nexo has ever done with Three Arrows Capital is sign a partnership with their NFT fund, but it did not take off and we currently have $0 business and exposure with them.— Nexo (@Nexo) June 15, 2022

What’s next for the NEXO token?Nexo has 100% liquidity to meet its $4.96 billion worth of debt obligations, according to U.S.-based audit firm Armanino. That raises the firm’s potential to avoid a liquidity crisis in the event of a rising withdrawal rate, unlike Celsius.Nonetheless, NEXO price treads ahead under persistent bearish risks, primarily due to the crypto market’s dire state in a high interest rate environment. The NEXO/USD pair now eyes the $0.58-$0.69 range as its interim support due to its historical significance from December 2020-January 2021.NEXO/USD weekly price chart. Source: TradingViewA rebound from the $0.58-0.69 range could have NEXO bulls eye $0.883 as their interim upside target. This level was instrumental as support during the early-May price crash; it now coincides with the 0.786 Fibonacci retracement graph drawn from the $0.11-swing low to the $3.71-swing high.Related: Is the bottom in? Raoul Pal, Scaramucci load up, Novogratz and Hayes weigh inConversely, a decline below the $0.58-$0.69 range could have NEXO watch December 2020’s support level near $0.43, down around 35% from today’s price.The views and opinions expressed here are solely those of the author and do not necessarily reflect the views of Cointelegraph.com. Every investment and trading move involves risk, you should conduct your own research when making a decision.

Čítaj viac

Ethereum crashed by 94% in 2018 — Will history repeat with ETH price bottoming at $375?

Ethereum’s native token Ether (ETH) is showing signs of bottoming out as ETH price bounced off a key support zone. Notably, ETH price is now holding above the key support level of the 200-week simple moving average (SMA) near $1,196. The 200-week SMA support seems purely psychological, partly due to its ability to serve as bottom levels in the previous Bitcoin bear markets. Independent market analyst “Bluntz” argues that the curvy level would also serve as a strong price floor for Ether where accumulation is likely. He notes:”BTC has bottomed 4x at the 200wma dating back to 2014. [Probably] safe to assume it’s a pretty strong level. Sure we can wick below it, but there [are] also six days left in the week.”ETH/USD weekly price chart. Source: TradingViewCurrently, ETH/USD is almost 75% below its record high, seven months after hitting around $4,950. This massive correction has made the Ethereum token an “oversold” asset, per its below-30 relative strength (RSI) readings, another technical indicator showing that ETH is a “buy.”The last time Ether turned oversold was in November 2018, which preceded the end of a 12-month long bear cycle that saw ETH losing 94% of its value. Unfortunately, the same bearish exhaustion cannot be promised in 2022 as Ether continues facing some serious macro headwinds.ETH’s technical bull signals are not enoughEther’s attempt to find a concrete bottom appears against the backdrop of a selling frenzy happening across the crypto and traditional financial markets.At the core of its 75% price correction is a hawkish Federal Reserve with its possibility of raising interest rates by 175 basis points by September’s end, according to interest rate swaps linked to FOMC policy outcome dates. Change in Fed’s interest-rate targets. Source: Bloomberg/CMEIn other words, riskier assets would suffer as lending costs rise. This could hurt Ether’s recovery prospects despite it holding above a so-called “strong” support level.1-2 months as the Ethereum merge would be implemented between August and October. And traders will front-run it. It won’t matter much if the Fed gets more aggressive, but if it doesn’t, then that’s your catalyst.— Alex Krüger (@krugermacro) June 2, 2022Ether price targetsETH’s price has been testing the 0.786 Fib line (near $1,057) as its interim support. This price level serves is a part of the Fibonacci retracement graph, drawn from the $1,323-swing high to the $82-swing low, as shown in the chart below.ETH/USD weekly price chart featuring Fibonacci support/resistance levels. Source: TradingViewA 2018-like 94% price decline would risk bringing ETH to the 0.236 Fib line near $375, down 70% from June 1’s price.Related: This key Ethereum price metric shows ETH traders aren’t as bearish as they appearConversely, if Ether indeed bottoms out near its 200-week SMA, its path of least resistance appears to be toward $2,000. An extended upside retracement above $2,000 would have the Ethereum token test $3,500 as its next bull target. The views and opinions expressed here are solely those of the author and do not necessarily reflect the views of Cointelegraph.com. Every investment and trading move involves risk, you should conduct your own research when making a decision.

Čítaj viac

Ethereum price flash crashes to $950 on Uniswap as whale dumps 93K ETH

Ethereum’s native token Ether (ETH) fell to as low as $950 on Uniswap—a decentralized crypto exchange— this June 13, about 20% lower than its spot rate across other exchanges.ETH/USD hourly price chart. Source: UniswapOver $130M ETH sold in six hoursThe incident happened at around 03:00 UTC after a whale dumped 65,000 ETH for multiple “stablecoins,” including USD Coin (USDC), Tether (USDT), and DAI.A piece of evidence noted that the whale sold its ETH holdings to pay off nearly $73 million worth of debt at Oasis.app, a DeFi lending platform. The duration of the sell-off saw ETH’s liquidation price dropping from $1,200 to $875.not a liquidation, someone selling collateral to pay off debthttps://t.co/tceIla0xuF pic.twitter.com/KwIholu1St— mariano.eth ✨ᕙ༼ຈل͜ຈ༽ᕗ✨ | (@nanexcool) June 13, 2022The Oasis borrower continued the selling spree—dumping another stash of nearly 28,000 ETH five hours after the first selloff—to pay back another $32 million in debt. This time, the liquidation price rose from $892 to $1,200, as shown below.Screenshot of the anonymous borrower’s dashboard. Source: Oasis.appAs a result, the whale dumped around 93,000 ETH within just six hours. The amount equals to roughly $112 million at today’s ETH/USD price. Interestingly, the Oasis borrower’s total outstanding debt was about $120 million (as measured in DAI stablecoin), suggesting that the whale suffered heavy “slippage” losses.wtf… was this a misclick? https://t.co/POURtN4F6s— Jonathan Howard (@staringispolite) June 13, 2022

Ether price eyes $667 — veteran analystEther’s trip to $950 was brief, suggesting adequate demand for the tokens near the level. Nonetheless, one separate analysis from veteran trader Peter Brandt pointed at ETH’s price falling towar $650 in the coming weeks.Brandt’s bearish outlook emerged out of a classic continuation pattern, dubbed the “descending triangle,” which resolves after the price breaks out in the direction of its previous trend. Since Ether was falling before the triangle’s formation, its path of least resistance was skewed to the downside.ETH/USD daily price chart. Source: Peter Brandt/TradeNavigatorBrandt says that ETH had reached the triangle’s first downside target of $1,268 as the price declined 20% on June 13. He anticipates the declines to continue, with ETH dropping almost by another 50% to $667.Nonetheless, Ether’s oversold relative strength index (RSI) could lead to a sharp price reversal. Ethereum picks additional rebound cues from its 200-week simple moving average (200-week SMA; the orange wave in the chart below) near $1,200, now serving as support.ETH/USD weekly price chart. Source: TradingViewIf ETH price undergoes an upside retracement, then the token’s interim bull target could be near $1,450, coinciding with the 1.00 Fib line of the Fibonacci retracement graph drawn from around $1,450-swing high to the $84-swing low.Related: Celsius exodus: $320M in crypto sent to FTX, user withdrawals pausedConversely, a decisive close below the 200-week SMA could have ETH eye $920 as its next downside target.The views and opinions expressed here are solely those of the author and do not necessarily reflect the views of Cointelegraph.com. Every investment and trading move involves risk, you should conduct your own research when making a decision.

Čítaj viac

Old Bitcoin mining rigs risk 'shutdown' after BTC price slips under $24K

Older Bitcoin (BTC) mining rigs are finding it difficult to generate positive revenues during the ongoing crypto market decline.75% drop in Bitcoin mining profitabilityThe profitability of many Application Specific Integrated Circuit (ASIC) machines has dropped into the negative zone after Bitcoin’s fall below $24,000 this June 13, data fetched by F2Pool shows. Those machines include Antminer S11 and AvalonMiner 921, which are now close to their “shutdown price.”For your information, we publish the latest list of the Shutdown Price below which crypto mining machines in this chart will have to be shut down for lack of profitability. pic.twitter.com/qxGtLjJI9l— Bitdeer (@BitdeerOfficial) June 13, 2022Notably, Bitmain’s Antminer S11 offers a maximum hash rate of 20.5 Terra-hash per second (TH/s) for a power consumption of 1,530 watts. The cost of running an Antiminer 211 is 0.13 kilowatts per hour (KW/h) based on the global average electricity cost. As a result, it would consume around $4.5 worth of power every day versus the roughly $2 income in the same period, according to data gathered by ASIC Miner Value.The profitability of Antminer S11 as of June 13, 2022. Source: BitmainSimilarly, the cost of running Canaan’s AvalonMiner 921 comes to be around $5 per day compared to its income of over $2 in the same period. Overall, Bitcoin miners’ earnings have dropped from $0.412 per TH/s/day in October 2021 to $0.11 per TH/s/day in June 2022, according to the “Bitcoin Hashprice Index” — a 75% decline in eight months. Bitcoin Hashprice Index one-year chart. Source: Hashrate IndexThe losses coincided with a sharp decline in the Bitcoin mining hash rate in the last seven days — from an all-time high of 239.15 exa-hash per second (EH/s) on June 6 to 189.72 EH/s on June 13, according to data from CoinWarz.Bitcoin hashrate data in last 12 months. Source: CoinWarzThis suggests that miners are limiting their BTC production capacity by theoretically shutting down unprofitable mining rigs and may continue in the coming weeks if Bitcoin fails to recover above $25,000 and/or the mining difficulty adjusts. Bitcoin mining stocks sufferOn June 13, Bitcoin price hit its lowest levels since December 2020, following a brutal crypto market selloff. BTC’s price reached as low as $23,707 (data from Coinbase) versus its November 2021’s peak of $69,000. The losses came due to the concerns about rising U.S. interest rates.BTC/USD daily price chart. Source: TradingViewBitcoin mining businesses, which remain at the forefront of minting and supplying new BTC tokens, have suffered the brunt of falling prices. For example, Canaan’s stock dropped by more than 90% after topping at $39.10 per share in March 2021.Similarly, VanEck’s Digital Assets Mining ETF (DAM), which opened for business in early March 2022, had lost 63% of its value as of June 10, measured from its record high of $46.05. It looked poised to open June 13 lower, per Nasdaq’s pre-market data.VanEck Digital Asset Mining ETF daily chart. Source: TradingViewNew gen BTC mining rigs still in profitOn a brighter note, some mainstream mining machines still generate profits for miners, hinting their owners would be able to weather the bearish Bitcoin market.Related: Crypto winter survival guide: Community shares game plan for the bear marketThat includes the newly-launched iPollo’s V1, which returns a daily income of around $62 against its $9 power consumption in the same period, and machines from the Antminer’s S-series, which generate daily revenues of $4.75-$18 despite Bitcoin’s below-$25,000 prices.For your information, we publish the latest list of the Shutdown Price below which crypto mining machines in this chart will have to be shut down for lack of profitability. pic.twitter.com/qxGtLjJI9l— Bitdeer (@BitdeerOfficial) June 13, 2022

Nonetheless, some profitable machines are near their shutdown thresholds, including Antminer’s S17+ (73T). It could become unprofitable when BTC’s price drop to $22,000, according to data provided by Bitdeer.The views and opinions expressed here are solely those of the author and do not necessarily reflect the views of Cointelegraph.com. Every investment and trading move involves risk, you should conduct your own research when making a decision.

Čítaj viac

Získaj BONUS 8 € v Bitcoinoch

nakup bitcoin z karty

Registrácia Binance

Burza Binance

Aktuálne kurzy