Autor Cointelegraph By Yashu Gola

More 'forced selling' ahead? Purpose Bitcoin ETF holdings plunge by 51% in biggest outflow ever

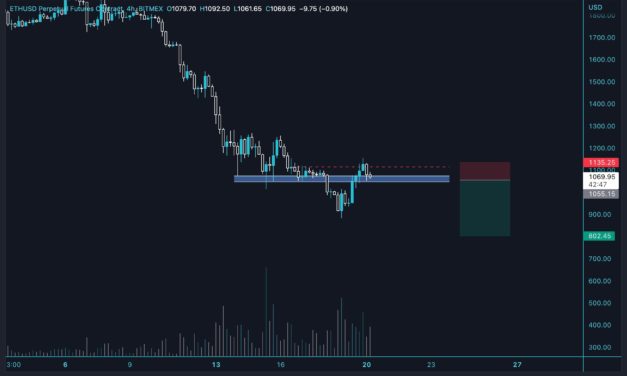
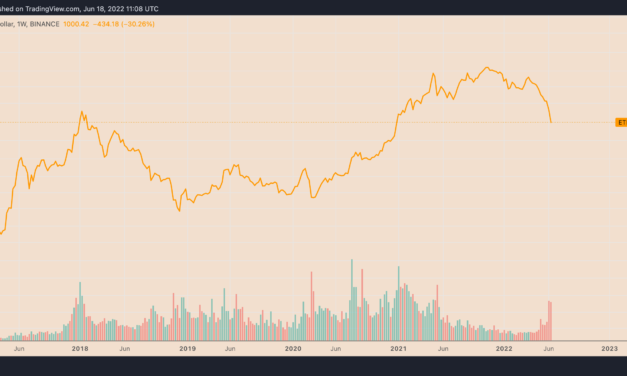
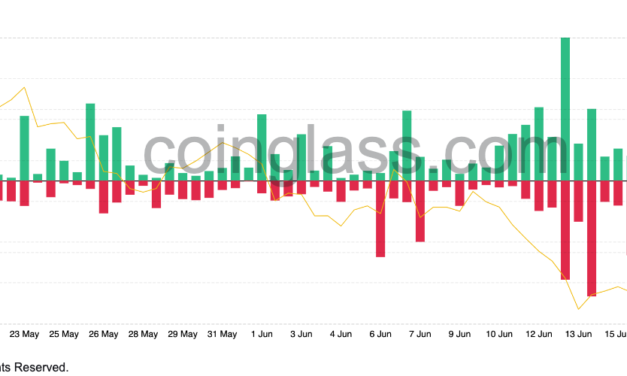
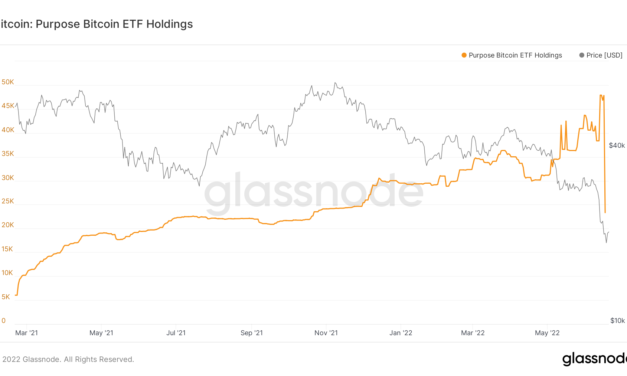
Canada’s Purpose Bitcoin ETF (BTCC) witnessed its Bitcoin (BTC) holdings slashed by half in just one day, suggesting an alarmingly waning buying sentiment among the crypto’s most-experienced investors.Purpose Bitcoin ETF has 51% of AUM slashedThe fund’s holdings dropped from $47,818 BTC to 23,307 BTC between June 16 and 17, its lowest level since October 2021. The 51% drop in BTC holding is also the biggest daily outflow ever.Purpose Bitcoin ETF holdings. Source: GlassnodeInterestingly, another Canadian crypto fund, dubbed 3iQ CoinShares Bitcoin ETF, witnessed similar outflows, dropping from 23,917 BTC on June 1 to 12,668 BTC on June 17, suggesting the Purpose’s massive BTC withdrawal was not an isolated event.3iQ CoinShares Bitcoin ETF holdings. Source: GlassnodeMore “forced selling” of Bitcoin ahead?The outflows came at the cusp of Bitcoin’s brief break below $20,000, a psychological support level that served as the top during the 2017 bull run. Notably, BTC’s price fell to circa $17,570 on June 20, only to reclaim $21,000 two days later.BTC/USD daily price chart. Source: TradingViewNonetheless, the funds’ giant Bitcoin puke left behind evidence of record-high redemption rates by their institutional clients, supposedly invoked by fears that BTC would resume its bear run below $20,000 in 2022.”I’m not sure how they execute redemptions, but that’s a lot of physical BTC to sell in a small time frame,” noted Arthur Hayes, the former CEO of BitMEX crypto exchange, adding:”Given the poor state of risk mgmt by #cryptocurrency lenders and over-generous lending terms, expect more pockets of forced selling of $BTC and $ETH as the mrkt figures out who is swimming naked.”Breaking below $20K is “easier” nowThe Bitcoin ETF outflows are related to waning buying sentiment in riskier assets, led by the Federal Reserve’s ultra-hawkish stance against rising inflation.Notably, Bitcoin has fallen by more than 70% from its record high of $69,000 in November 2021, mainly plagued by the Fed’s benchmark rate hikes and systematic and complete unwinding of a $9 trillion balance sheet.The U.S. central bank slashed rates by 75 basis points on June 15, its highest since 1994. Meanwhile, its “dot plot” reveals aims to push the lending rates to 3.4% by the end of 2022 versus the current 1.5–1.75% range. FOMC assessment of Future Interest Rates. Source: EcoinometricsThat would mean more hikes into the year, which, in turn, could hurt risk appetite further, limiting Bitcoin’s, as well as the stock market’s, recovery potential.Related: How to survive in a bear market? Tips for beginners”The biggest issue I see as for now is a global recession, which is just around the corner,” Paweł Łaskarzewski, co-CEO at decentralized finance (DeFi) launchpad platform Synapse Network, said, adding: “Because of this, retail and institutions are too scared and don’t have the same capital firepower they had a year ago. So due to the shallower market, it’s much easier to break the $20K line as there might not be enough capital to take it back.”BTC levels to watch out forBitcoin’s likelihood of retesting $17,000–$18,000 as support will be all but guaranteed if BTC price breaks below $20,000 again. Meanwhile, continued selling could have BTC fall to $14,000, the May 2019 top. Interesingly, Bitcoin’s Volume Profile Visible Range (VSVR) further indicates the $8,000–$10,000 range as the most dominant based on trading activity.The views and opinions expressed here are solely those of the author and do not necessarily reflect the views of Cointelegraph.com. Every investment and trading move involves risk, you should conduct your own research when making a decision.

Čítaj viac

Ethereum analyst warns of 'clean fakeout' despite 30% ETH price rebound

Ethereum’s native token, Ether (ETH), underwent a sharp relief rally after falling to $880, its lowest level in eighteen months, on June 18.ETH price regains 30% in two daysEther’s price reached above $1,150 this June 19, marking 30%-plus gains in just two days. However, at the beginning of the new weekly session this June 20, the ETH/USD pair hinted at giving up its weekend gains, with its price plunging by almost 9% from the $1,150 high. PostyXBT, an independent market analyst, told his 79,800 followers to be careful about the latest ETH price rally, noting that the move “would make for a clean fakeout.” Excerpts from his statement:”It looks like an opportunity to flip long towards $1,250, but $BTC still hasn’t reclaimed it’s like-for-like level.”ETH/USD 4-hour price chart. Source: PostyXBT/TradingViewNext ETH price bear target: $700-$800The statements appear as Ether, alongside other top cryptocurrencies, including Bitcoin (BTC), Solana (SOL), and Cardano (ADA), have entered a bear market. ETH/USD now trades 77% below its $4,951-record high, but some tokens are down 90% from their 2021 peak levels.Concerns about the Federal Reserve’s hawkish policy to tame inflation has stoked these sell-offs, hurting parts of traditional stock markets in tandem. In detail, the U.S. central bank plans to hike benchmark rates into 2023, which may leave investors with lesser liquidity to buy riskier assets like BTC and ETH.Additionally, forced selling and liquidity troubles led by the so-called decentralized finance, or DeFi, sector have added downside pressure on the crypto market, thus limiting Ether’s prospects of continuing its recovery rally moving forward.Analyst “Capo of Crypto” states that ETH has not bottomed out yet and that its price could fall further toward the $700-$800 range.$ETHMain target reached, bounced from there, but no bottom formation yet.Eyes on $700-800 as new support zone, which would complete the 5th of the 5th wave. https://t.co/ZIWnzMW6bk pic.twitter.com/rT0qnY0Roe— il Capo Of Crypto (@CryptoCapo_) June 20, 2022ETH price bottom signs?Meanwhile, one metric that tracks the differences between Ether’s market value and realized value suggests that ETH/USD is bottoming out.The “MVRV-Z Score,” as it is called, assesses when Ether is overvalued or undervalued relative to its “fair” or realized value. So, when the market value has surpassed realized value, it has historically marked a bull run top.Conversely,  the market value falling below realized value has indicated a bear market bottom (the green zone in the chart below). Ether’s MVRV-Z Score entered the same buying zone in early June and is now consolidating inside it.Ethereum MVRV Z-Score. Source: GlassnodeBut this does not necessarily mean a trend reversal, according to the MVRV-price relation witnessed during the 2018 bear market.Related: 5 indicators traders can use to know when a crypto bear market is endingNotably, Ether’s MVRV Z-Score slipped into the green zone on August 12, 2018, when the price was around $319. But the Ethereum token bottomed out at a much later date, on December 14, 2018, when the price reached near $85.In other words, Ether has entered a bottoming out stage, at best, if the on-chain fractal holds valid in 2022. The views and opinions expressed here are solely those of the author and do not necessarily reflect the views of Cointelegraph.com. Every investment and trading move involves risk, you should conduct your own research when making a decision.

Čítaj viac

Ethereum risks another 60% drop after breaking below $1K to 18-month lows

The price of Ethereum’s native token, Ether (ETH), careened below $1,000 on June 18 as the ongoing sell-off in the crypto market continued despite the weekend.Ether reached $975, its lowest level since January 2021, losing 80% of its value from its record high in November 2021. The decline appeared amid concerns about the Federal Reserve’s 75 basis points rate hike, a move that pushed both cryptocurrencies and stocks into a strong bear market.”The Federal Reserve has barely started raising rates, and for the record, they haven’t sold anything on their balance sheet either,” noted Nick, an analyst at data resource Ecoinometrics, warnings that “there is bound to be more downside coming.”ETH/USD weekly price chart. Source: TradingViewEthereum’s implosion continuesInvestors and traders have been anxiously watching Ether’s price in recent days, fearing a decisive breakdown below $1,000 would trigger the forced liquidations of massively leveraged bets. In turn, that would put more downside pressure on Ethereum.The fears appear due to Babel Finance and Celsius Network, a pair of crypto lending platforms that halted withdrawals citing market volatility. They intensified further after Three Arrow Capital, a crypto hedge fund managing $10 billion worth of assets as of May, failed to shore up its collateral to cover pungent bets. This came less than a month after Terra, a $40 billion “algorithmic stablecoin” project, collapsed.These events have coincided with a massive capital withdrawal from Ethereum’s blockchain ecosystem. The total value locked (TLV) unwind occurred in two parts. First, Ethereum’s TVL across DeFi projects fell by $94 billion after the Terra debacle in May and then by another $30 billion by mid-June.Ethereum total value locked in DeFi. Source: Glassnode”The deleveraging event that is underway is observably painful, and is akin to a form of mini-financial crisis,” noted CheckMate and CryptoVizArt, a pair of analysts at Glassnode, an on-chain analytics platform, adding:”However, with this pain comes the opportunity to flush excessive out leverage, and allow for a healthier rebuild on the other side.”How low can ETH price go?Fed’s hawkish policies and the ongoing DeFi market implosion suggest extended bearish moves in the Ether market.From a technical perspective, ETH’s price must regain $1,000 as its psychological support, which, if broken to the downside, could have the token eye the $830 as its next target. The same level served as resistance in February 2018, which preceded a 90% decline to around $80 in December 2018.ETH/USD weekly price chart. Source: TradingViewMeanwhile, as Cointelegraph covered earlier, ETH/USD can fall to as low as $420 if Ether’s correction turns out to be anything like its 2018 bear cycle when the drawdown reached over 90%.Related: 72 of the top 100 coins have fallen 90% or more: Here are the holdoutsInterestingly, the $420-downside target was instrumental as support in April-July 2018 and resistance in August-September 2020.The views and opinions expressed here are solely those of the author and do not necessarily reflect the views of Cointelegraph.com. Every investment and trading move involves risk, you should conduct your own research when making a decision.

Čítaj viac

XRP price technical breakdown boosts chances of a 40% drop by July

Ripple (XRP) price stares at potential losses in the coming weeks as it breaks out of a “descending triangle” pattern, with its bias skewed toward the downside.Major XRP breakdown underwayTo recap, XRP started forming the technical structure after reaching $1.98 in April 2021, its second-highest level to date. In doing so, the token trended lower inside a range defined by a falling resistance trendline and a horizontal support trendline.On May 16, 2022, XRP broke below the triangle’s support trendline, accompanying a decent increase in trading volumes. The move confirmed the descending triangle as a bearish reversal indicator. Meanwhile, as a rule of technical analysis, XRP now risks extending its downside move by as much as the triangle’s maximum height when measured from the breakdown point, as shown below.XRP/USD weekly price chart featuring ‘descending triangle’ breakdown setup. Source: TradingViewThis could have XRP drop to $0.18 by July 2022, down nearly 40% from June 1’s price. Crypto carnageXRP’s bearish setup appears amid a broader selloff taking place across the crypto market, with some tokens now trading more than 90% below their record highs established last year. The massive tailspin began in May after Terra (LUNA) — now known as Luna Classic (LUNC) — a $40-billion “algorithmic stablecoin” project, collapsed due to the failure of its staking system. This debacle found its match in Celsius Network, one of the largest crypto lending platforms, which unexpectedly paused crypto withdrawals in June over “extreme market conditions.”Related: Finblox withdrawal restrictions trigger concerns from the communitySince then, the crypto market has been facing one piece of bad news after another, from crypto fund giant Three Arrow Capital’s potential insolvency owing to bad debts and risky trades to crypto lender Babel Finance halting withdrawals due to liquidity issues.Babel Finance 也暂停了提现业务 pic.twitter.com/9Nk1gkEmVz— 0xEdson | web3 (@0xEdsonCrypto) June 17, 2022Macro risks also favor XRP’s downside outlook with the Federal Reserve’s 0.75% interest rate hike this June 15, ensuring lower liquidity for investors to speculate on risky assets. Nonetheless, Kevin Cage, who runs Iron Key Capital, a crypto-focused hedge fund, says XRP will “survive” the bear market.I know for a fact that no matter how hard it gets, $XRP will survive future bear markets.XRPL is 10 years old. Tried & true.Ripple expanding, new partners every week, hiring 300 more peopleThey want clarity and will fight until the end.SEC chose the wrong company to fight— Kevin Cage (@Kevin_Cage_) June 14, 2022

Meanwhile, Bleeding Crypto says that XRP could fall toward $0.17 but anticipates that the token would undergo a sharp rebound move after reaching the level. “Looks like it may be going for a full reset of this past bull run,” he wrote, hinting that XRP would reclaim $1.95–$1.98 during its next upside retracement.The views and opinions expressed here are solely those of the author and do not necessarily reflect the views of Cointelegraph.com. Every investment and trading move involves risk, you should conduct your own research when making a decision.

Čítaj viac

SOL price trending toward yearly low as Solana TVL drops $870M in three days

Solana (SOL) tumbled on June 16 amid a broader retreat across the top cryptocurrencies, led by the Federal Reserve’s 0.75% interest rate hike a day before.Solana price rebound fizzlesNotably, SOL/USD plunged nearly 17% to $30 a token, wiping almost all the gains from the day before. The SOL price volatility liquidated almost $10 million worth of contracts in the past 24 hours across multiple crypto exchanges, data from Coinglass shows. SOL liquidation record since May 17. Source: Coinglass The latest declines come as an extension to SOL’s broader correction, where it dropped by more than 90% after peaking out near $267 in November 2021. SOL also fell to its lowest level since July 2021 near $25.In addition, a higher interest rate environment and the collapse of high-profile crypto projects like Terra have strengthened SOL’s downside prospects. SOL paints “ascending triangle”Solana’s pullback move on June 16 began after testing a horizontal trendline resistance near $34 that constitutes what appears to be an “ascending triangle” pattern.Ascending triangles are continuation patterns, i.e., they tend to send the price in the direction of their previous trend. As a rule, breaking out of a triangle pattern in a bearish market, for example, sends the price down by as much as the structure’s maximum height.If SOL breaks below its ascending triangle’s lower trendline then the bearish profit target will come below $22.50, as shown in the chart below.SOL/USD four-hour price chart featuring “ascending triangle” pattern. Source: TradingViewSolana’s downside target is about 25% below today’s price and could be achieved by June. Nonetheless, if SOL bounces after testing the triangle’s lower trendline as support, it would eye the $34-36 range as its interim upside target.Massive SOL exitOver 27 million Solana tokens have exited its smart contract ecosystem since June 13. The total value locked (TVL) inside Solana smart contracts dropped to 74.65 million SOL (~$2.25 billion) on June 16, down 27% in the last three days, according to data tracked by DeFi Llama. That amounts to nearly $840 million of withdrawals from the ninth-largest blockchain ecosystem by market cap.Solana TVL performance since April 2021. Source: DeFi LlamaSolend, a lending platform functioning atop the Solana ledger, witnessed a 26.5% decline in its TVL in the last three days and was holding 9.66 million SOL (~$290 million) as of June 16. Nevertheless, it remains the leading platform by TVL within the Solana ecosystem.Related: Liquidity provider asks platforms to freeze 3AC funds to recover assets after litigationThe outflows indicate that depositors do not want to keep their SOL locked in DeFi protocols, a sentiment common across the sector after Terra, an “algorithmic stablecoin” project, collapsed last month.Contagion, another yield ponzi going down. Seriously get your coins off anything like Celsius and BlockFi before they aren’t your coins anymore. LFG, 3AC, Celcius etc all spread risk to each other and you pay the price for it https://t.co/cemFCvAeAz— Pentoshi Powell Jr (@Pentosh1) June 16, 2022Therefore, Solana’s path of least resistance remains skewed to the downside in the near term, particularly with no improvement in terms of macro and fundamentals. The views and opinions expressed here are solely those of the author and do not necessarily reflect the views of Cointelegraph.com. Every investment and trading move involves risk, you should conduct your own research when making a decision.

Čítaj viac

Získaj BONUS 8 € v Bitcoinoch

nakup bitcoin z karty

Registrácia Binance

Burza Binance

Aktuálne kurzy