Autor Cointelegraph By Yashu Gola

SOL price eyes 75% rally as Solana paints a bullish reversal pattern

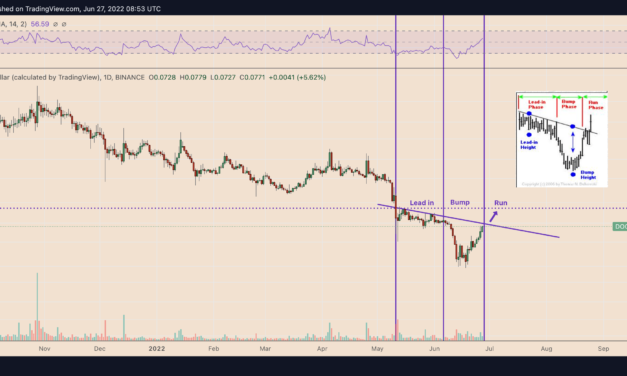
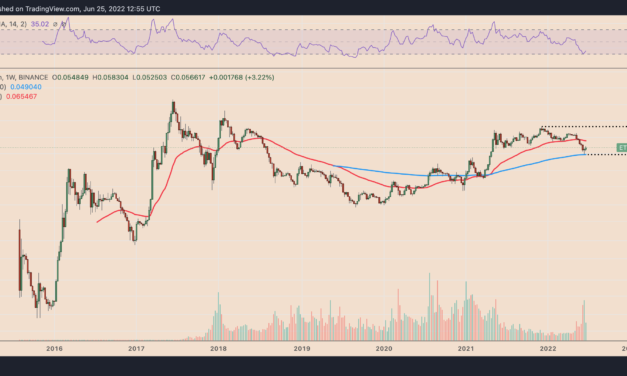
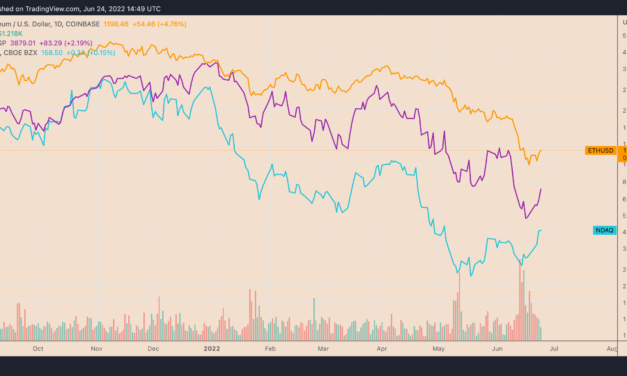
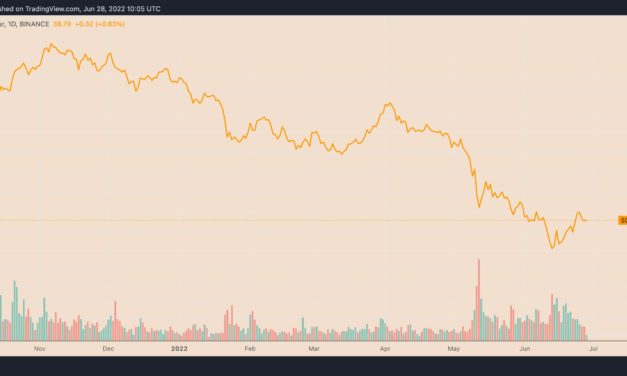
Solana (SOL) continued its recovery trend on June 28 while inching closer to triggering a classic bullish reversal setup.SOL’s price gained 2.42%, reaching an intraday high of $39.40/ The SOL/USD pair is now up 50% as a part of a broader retracement move that began on June 14 after falling to lows of $26. SOL/USD daily price chart. Source: TradingViewSolana price eyes 75% rallyThe latest buying period in the Solana market has been painting what appears to be an “inverse head and shoulders pattern (IH&S)” pattern.The bullish reversal setup appears when the price forms three troughs in a row below a common support trendline called “neckline.” The middle trough, known as “head,” is always deeper than the other two troughs, called shoulders.An IH&S setup resolves after the price breaks above the neckline level. Also, as a rule of technical analysis, the pattern’s profit target comes to be at length equal to the maximum distance between the head’s lowest tip and the neckline.SOL/USD daily price chart featuring IH&S pattern. Source: TradingViewSuppose SOL breaks above its neckline resistance of $41.50. Then, the chances of continuing the bullish retracement stand around 83.5%, with its upside target sitting at over $68, about 75% above today’s price.Interim resistance levelsSolana’s road to $68 could face hurdles in a confluence of technical resistance levels, including its 50-day exponential moving average (50-day EMA; the red wave) and a support-turned-resistance line. Both resistance levels are around $47.SOL remains at risk of exhausting its IH&S breakout, which, in turn, could trigger a “bear flag” setup. A pullback from the $47-resistance-level, coinciding with the flag’s upper trendline, could lead to a breakdown, as shown in the chart below.SOL/USD daily price chart featuring ‘bear flag’ pattern. Source: TradingViewAs a result, SOL’s downside target comes to be approximately inside the $23-$30 range, depending on its breakdown point. In a similar setup, independent market analyst PostyXBT anticipated SOL’s price to reach $47. $SOL idea- Higher low & S/R flip- $BTC still hasn’t pushed higher to $23k- Play the short term trend until invalidated- Declining volume a concernNot rushing into an entry at current price. If I don’t get filled slightly lower, so be it. pic.twitter.com/IgZbeBAq40— Posty (@PostyXBT) June 28, 2022Nonetheless, declining volumes remain a concern, so traders should play the short-term trend until further bullish confirmation, he added. In other words, SOL’s likelihood of returning lower is high after reaching $47.Solana also down 85% from peLike most crypto assets, Solana has lost a significant chunk of its valuation compared to its November 2021 peak, down over 85% now. Related: Institutional crypto asset products saw record weekly outflows of $423MAdditionally, Solana’s “decentralization” has also faced increasing scrutiny amid repeated network outages and a recent attempt to take control of a whale’s wallet via community voting to force liquidation.Absolute comedy. @solendprotocol, a supposed “decentralized” lending protocol built on Solana has “voted” to take over a whales account with emergency powers to eliminate the chance of forced liquidation. “Decentralized” in name only. pic.twitter.com/Vrua3dFoES— Dylan LeClair (@DylanLeClair_) June 19, 2022

On the other hand, some anticipate Solana’s ecosystem to grow just like its top rival Ethereum did after the 2018 bear market. That includes Spencer Noon, the co-founder of crypto-focused Variant Fund, who said:”Solana has a vibrant developer ecosystem and its downtime issues are solvable. This will be obvious in retrospect.”The views and opinions expressed here are solely those of the author and do not necessarily reflect the views of Cointelegraph.com. Every investment and trading move involves risk, you should conduct your own research when making a decision.

Čítaj viac

Terra's LUNA2 skyrockets 70% in nine days despite persistent sell-off risks

The price of Terra (LUNA2) has recovered sharply nine days after falling to its historic lows of $1.62. On June 27, LUNA2’s rate reached $2.77 per token, thus chalking up a 70% recovery when measured from the said low. Still, the token traded 77.35% lower than its record high of $12.24, set on May 30.LUNA2’s recovery mirrored similar retracement moves elsewhere in the crypto industry with top crypto assets Bitcoin (BTC) and Ether (ETH) rising by approximately 25% and 45% in the same period.LUNA2/USD four-hour price chart versus BTC/USD. Source: TradingViewLUNA2 price rally could trap bullsThe recent bout of buying in the LUNA2 market could trap bulls, given it has come as a part of a broader correction trend.In detail, LUNA2 appears to be forming a “bear flag” pattern, a bearish continuation setup that appears as the price consolidates upward inside a parallel ascending channel after undergoing a large move downside.Bear Flags resolve after the price breaks below the channel’s lower trendline. As a rule of technical analysis, their breakdown takes the price to the level at a length equal to the size of the previous downside move (called “flagpole”), as shown in the chart below.LUNA2/USD daily price chart featuring ‘bull flag’ setup. Source: TradingViewLUNA2, now trading near its Bear Flag’s upper trendline (~$2.40), could undergo an imminent pullback toward the pattern’s lower trendline near $2. If accompanied by an increase in volume, an extended price correction would put LUNA2 at risk of crashing to $1.30, down almost 50% from June 2’s price. LUNA2 is riskyLUNA’s depressive technical outlook also takes cues from its controversial history.Notably, LUNA2 came to existence in late May as a means to compensate investors who had suffered losses during the collapse of Terra’s algorithmic stablecoin, now called TerraClassic USD (USTC).Meanwhile, the almost-worthless old version of LUNA2, named LUNA, started trading as an independent token under the revamped brand called “Terra Classic (LUNAC).”LUNA2 opened across major exchanges with a 483% spike to $12.24, only to give up all the gains in a massive correction move later. Mati Greenspan, the founder of crypto research firm Quantum Economics, noted that nobody in their right mind would want to invest in LUNA2 after the LUNAC collapse.LUNA/USD daily price chart. Source: TradingViewThat leaves LUNA2 in the hands of hardcore holders who want to recoup their Terra losses entirely and speculators who want to place excessively leveraged bets on its day-to-day volatile price moves. Related: Bitcoin price dips under $21K while exchanges see record outflow trendInterestingly, such speculations are also leading LUNAC and USTC’s market cap higher.LUNAC and USTC market cap. Source: CoinMarketCapThe market capitalization of LUNAC, despite being dead in theory, has risen by 75% to $594 million on June 27, after reaching as low as $339 million on June 12. Similarly, USTC’s market valuation has rallied from $13 million to $96 million in the same period.The views and opinions expressed here are solely those of the author and do not necessarily reflect the views of Cointelegraph.com. Every investment and trading move involves risk, you should conduct your own research when making a decision.

Čítaj viac

Dogecoin price could rally 20% in July with this bullish reversal pattern

Dogecoin (DOGE) looks ready to extend its rebound move despite the current crypto bear market.79% chances DOGE will extend its rebound moveDOGE’s price appears to have been painting a “bump-and-run-reversal (BARR) bottom” since May 11, a technical pattern that points to extended trend reversals in a bear market. It consists of three successful phases: Lead-In, Bump, and Run.The “Lead-In phase” sees the price consolidating inside a narrow, sideways range, showing an interim bias conflict among investors. That follows the “Bump phase,” wherein the price drops and recovers sharply, leading to a price breakout, defined by the “Run phase.”DOGE/USD daily price chart featuring ‘BARR bottom’ pattern. Source: TradingViewDogecoin appears to be in the Bump Phase while eyeing a breakout above the BARR bottom’s falling trendline resistance. Suppose DOGE breaks above the said price ceiling. Then, as a rule of technical analysis, it would eye a run-up toward the BARR’s origin level.That puts DOGE’s price en route to $0.0941, up over 20% from today’s price. Notably, the upside target also coincides with the token’s 50-week exponential moving average (50-week EMA; the blue line in the chart below). DOGE/USD weekly price chart featuring 50-week EMA. Source: TradingViewBARR bottom has met its profit target 79% of all time, according to a report by veteran investor Thomas Bulkowski. Interestingly, the pattern’s breakout stage typically yields an average 55% rise, meaning DOGE’s potential to hit $0.123 remains on the cards.DOGE price is bottoming out?Dogecoin’s run-up to $0.0941 might not have it escape its bearish trend owing to a flurry of technical and fundamental factors. From the technical perspective, DOGE’s price risks run into a “bull trap” as it trends upward (it has already rallied almost 60% in the last nine days). Notably, the coin’s downside bias emerges due to a “rising wedge” pattern on its lower-timeframe charts.In detail, DOGE has been in an uptrend inside a range defined by two ascending, contracting trendlines, thus making a rising wedge. As a rule, this technical setup leads to a bearish reversal, confirmed when the price breaks below the wedge’s trendline.As it does, the price could fall by as much as the maximum distance between the wedge’s upper and lower trendline.DOGE/USD four-hour price chart featuring ‘rising wedge’ setup. Source: TradingViewDOGE’s rising wedge’s potential breakout points fall within the $0.07-$0.08 range. So, the token could fall toward the $0.05-$0.06 area if the wedge breakdown pans out as intended, down 15%-25% from current price levels.Related: 2022 bear market has been the worst on record — GlassnodeFundamentals, including the Federal Reserve’s rate hikes and reduction of its $9 trillion balance sheet, support the technical downside outlook for the short to medium terms.The views and opinions expressed here are solely those of the author and do not necessarily reflect the views of Cointelegraph.com. Every investment and trading move involves risk, you should conduct your own research when making a decision.

Čítaj viac

How low can Ethereum price drop versus Bitcoin amid the DeFi contagion?

Ethereum’s native token Ether (ETH) has declined by more than 35% against Bitcoin (BTC) since December 2021 with a potential to decline further in the coming months.ETH/BTC weekly price chart. Source: TradingViewETH/BTC dynamicsThe ETH/BTC pair’s bullish trends typically suggest an increasing risk appetite among crypto traders, where speculation is more focused on Ether’s future valuations versus keeping their capital long-term in BTC. Conversely, a bearish ETH/BTC cycle is typically accompanied by a plunge in altcoins and Ethereum’s decline in market share. As a result, traders seek safety in BTC, showcasing their risk-off sentiment within the crypto industry.Ethereum TVL wipe-outInterest in the Ethereum blockchain soared during the pandemic as developers started turning to it to create a wave of so-called decentralized finance projects, including peer-to-peer exchange and lending platforms.That resulted in a boom in the total value locked (TVL) inside the Ethereum blockchain ecosystem, rising from $465 million in March 2020 to as high as $159 billion in November 2021, up more than 34,000%, according to data from DeFi Llama.Ethereum TVL performance since 2019. Source: DeFi LlamaInterestingly, ETH/BTC surged 345% to 0.08, a 2021 peak, in the same period, given an increase in demand for transactions on the Ethereum blockchain. However, the pair has since dropped over 35% and was trading for 0.057 BTC on June 26.ETH/BTC’s drop coincides with a massive plunge in Ethereum TVL, from $159 billion in November 2021 to $48.81 billion in June 2022, led by a contagion fears in the DeFi industry.Also, institutions have withdrawn $458 million this year from Ethereum-based investment funds as of June 17, suggesting that interest in Ethereum’s DeFi boom has been waning.Bitcoin struggling but stronger than EtherBitcoin has faced smaller downsides compared to Ether in the ongoing bear market.BTC’s price has dropped nearly 70% to around $21,500 since November 2021, versus Ether’s 75% drop in the same period. Also, unlike Ethereum, Bitcoin-focused investment funds have seen inflows of $480 million year-to-date, showing that BTC’s drop has done little to curb its demand among institutional investors.Investment flows into/out of crypto funds by assets. Source: CoinSharesETH/BTC downside targetsCapital flows, coupled with an increasing distrust in the DeFi sector, could keep benefiting Bitcoin over Ethereum in 2022, resulting in more downside for ETH/BTC.Related: Swan Bitcoin CEO against crypto lenders: Users are way under-compensated for the riskFrom a technical perspective, the pair has been holding above a support confluence defined by a rising trendline, a Fibonacci retracement level at 0.048 BTC, and its 200-week exponential moving average (200-week EMA; the blue wave in the chart below) near 0.049 BTC.ETH/BTC weekly price chart. Source: TradingViewIn a rebound, ETH/BTC could test the 0.5 Fib line next near 0.062. Conversely, a decisive break below the support confluence could mean a decline toward the 0.786 Fib line at 0.027 in 2022, down more than 50% from today’s price.The ETH/BTC breakdown might coincide with an extended ETH/USD market decline, primarily due to the Federal Reserve’s quantitative tightenig that has recently pressured crypto prices lower against the U.S. dollar. $ETH historical Bear Markets correction depth:• -72% • -94%• -82% (and counting)Read more about #ETH Market Cycles here:https://t.co/5hIo7SC1n6#Crypto #Ethereum pic.twitter.com/7Ol0q3xM9G— Rekt Capital (@rektcapital) June 25, 2022Conversely, weaker economic data could prompt the Fed to cool down on its tightening spree. This could limit Ether and the other crypto assets’ downside bias in the dollar market, per Informa Global Markets.The firm noted:“Macroeconomic conditions need to improve and the Fed’s aggressive approach to monetary policy has to subside before crypto markets see a bottom.”But given Ethereum has never reclaimed its all-time high against Bitcoin since June 2017 despite a strong adoption rate, the ETH/BTC pair could remain under pressure with the 0.027-target in sight.The views and opinions expressed here are solely those of the author and do not necessarily reflect the views of Cointelegraph.com. Every investment and trading move involves risk, you should conduct your own research when making a decision.

Čítaj viac

Ethereum price breaks out as 'bad news is good news' for stocks

Ethereum’s native token, Ether (ETH), gained alongside riskier assets as investors assessed weak U.S. economic data and its potential to cool down rate hike fears.Ether mirrors risk-on recoveryETH’s price climbed up to 8.31% on June 24 to $1,225, six days after falling below $880, its lowest level since January 2021. Overall, the upside retracement brought bulls 40% in gains, raising anticipation about an extended recovery in the future while alleviating fears of a “clean fakeout.”For instance, independent market analyst “PostyXBT” projected ETH’s price to close above $1,300 by the end of June. In contrast, analyst “Wolf” feared that bears would attempt to “push price back to $1,047,” albeit anticipating a run-up toward $1,250 if ETH holds above its diagonal trendline support, as shown below.$ETH 4h. If the trend change is real, then we will soon find out. Bulls must hold this diagonal and see this type of scenario.Bears, instead will try to push price back to 1047 pic.twitter.com/PRG9fD4iRz— Wolf (@IamCryptoWolf) June 21, 2022Ether has come under pressure from the Federal Reserve’s hawkish policy in 2022. But those fears appear to be subsiding after the latest U.S. composite purchasing managers report, which shows the manufacturing activity fell to a five-month-low.”Growth is coming down, maybe even sooner than expected,” Esty Dwek, chief investment officer at FlowBank, told the Wall Street Journal, adding: “That should allow the Fed to soften at some point.”ETH/USD daily chart versus Nasdaq and S&P 500. Source: TradingViewStill, Greg Peters, co-chief investment officer at PGIM Fixed Income, warned that the current rally in the risk-on markets might not last. He is unconvinced that “the central banks will stop tightening if economies slow.”Classic bullish reversal setup in playEther’s rebound on June 24 also had it break above a falling resistance trendline that constitutes an “inverse head-and-shoulders” pattern (IH&S).In detail, Ether has formed the IH&S pattern after forming three troughs below a common support level, called the neckline. Also, the middle trough comes out to be deeper than the other two, which are more or less of the same height.Related: ‘Foolish’ to deny Bitcoin price can go under $10K — AnalysisTraditional analysts see IH&S as a bullish reversal setup, i.e., they resolve after the price breaks above their neckline support. As a rule, the price could rise by as much as the IH&S’s maximum height after the breakout.ETH/USD four-hour price chart featuring IH&S setup. Source: TradingViewAs a result, Ether eyes an extended upside retracement toward $1,560 after breaking above its IH&S neckline, up nearly 33% from the current price. Interestingly, the IH&S profit target coincides with ETH’s 200-4H exponential moving average (200-4H EMA; the blue wave) near $1,537.The views and opinions expressed here are solely those of the author and do not necessarily reflect the views of Cointelegraph.com. Every investment and trading move involves risk, you should conduct your own research when making a decision.

Čítaj viac

Získaj BONUS 8 € v Bitcoinoch

nakup bitcoin z karty

Registrácia Binance

Burza Binance

Aktuálne kurzy