Autor Cointelegraph By Yashu Gola

What bear market? This token is quietly making new highs, up 300% against Bitcoin in 2022

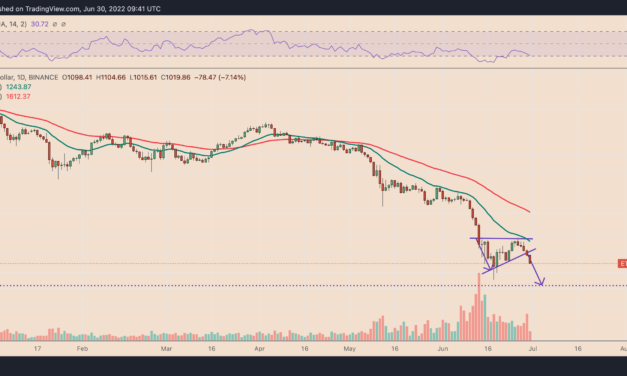
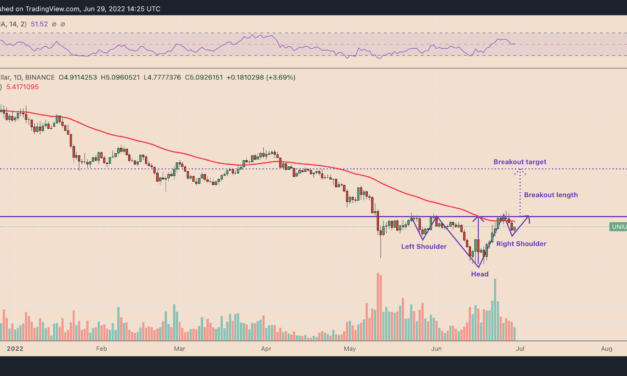
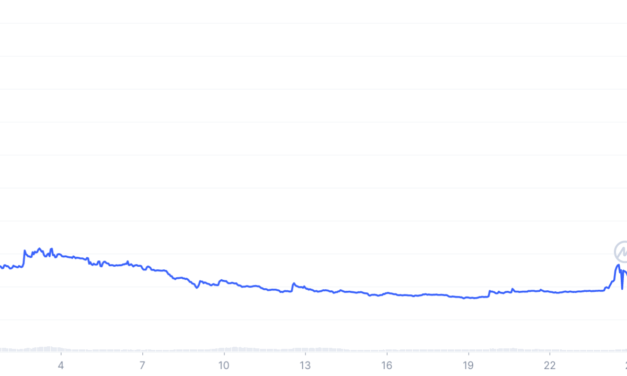
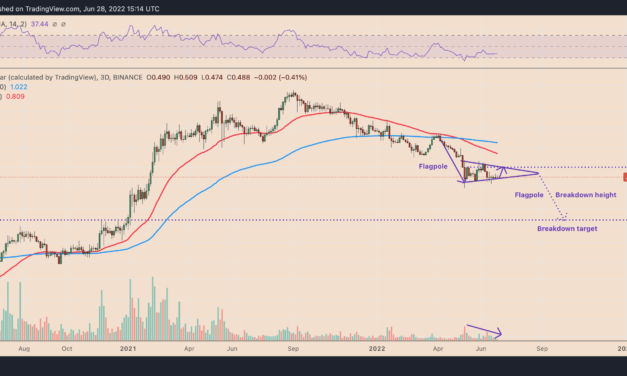
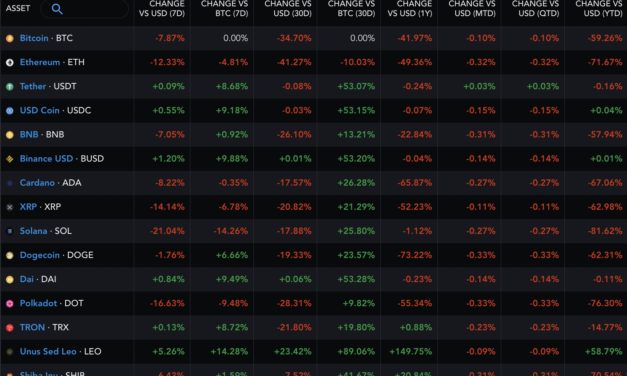
Unus Sed Leo (LEO) has not only survived the crypto market bloodbath in the first half of 2022 but has actually posted major gains, bucking the big crypto crash.LEO beats crypto kingpin BitcoinLEO, a utility token used across the iFinex ecosystem, finished the first half of 2022 against Bitcoin at 32,793 satoshis, up almost 300%. The token also rallied 55% against the U.S. dollar in the same period, hitting $5.80 for the first time since February 2022. In contrast, Bitcoin (BTC) and Ether (ETH), the top two crypto assets by market cap, fell by over 60% and 70%, respectively.Top-ranking crypto assets and their performances per timeframes. Source: MessariThat has made it the best-performing crypto asset in the top ranks so far into 2022.What’s driving LEO price higher?The crypto market wiped more than $2 trillion off its valuation in the first half of 2022, led by rate hikes, the collapse of Terra (LUNA) — now officially Terra Classic (LUNC), and systemic insolvency troubles across leading cryptocurrency lending platforms and hedge funds.LEO/BTC daily price chart. Source: TradingViewLEO’s price also suffered a 25% decline after hitting its all-time high of $8.14 in February 2022. Nevertheless, it fared better than the rest of the crypto market, which fell nearly 60% in the same period.The reason behind this outlier token could be its starkly different attributes compared to other digital assets.IFinex, the parent company of Bitfinex, launched LEO in 2018 in a private sale round to raise $1 billion. In return, the firm committed to employing 27% of its revenues from the previous month to buy back LEO until all tokens are removed from circulation.Also, iFinex pledged to buy back LEO tokens using funds it had lost during the August 2016 Bitfinex hack. In February 2022, the U.S. Department of Justice recovered 94,000 BTC out of 119,754 BTC. That coincided with LEO rallying to its record highs in both Bitcoin and the dollar-based markets.Overheated rally?LEO’s run-up against Bitcoin risks exhaustion due to its price’s growing divergence with momentum.In detail, LEO’s price has been making higher lows while its daily relative strength index (RSI) prints lower highs. As a rule of technical analysis, this divergence shows a lack of upside conviction among traders.LEO/BTC daily price chart. Source: TradingViewThe RSI is also above 70, a traditionally “overbought” area and a sell indicator. LEO now maintains its bullish bias while holding above its interim support level at 26,220 sats, coinciding with the 0.236 Fib line of the Fibonacci retracement graph drawn from 4,382-swing low to 32,965-swing high. A decisive close below 26,220 sats could have LEO eye a run-down toward the 38.2 Fib line near 22,046 sats, down 25% from Jul’s price. Interestingly, the level is near another support level — the 50-day exponential moving average (50-day EMA; the red wave in the chart above).LEO/USD bearish rejectionLEO’s ongoing price run-up had it briefly close above a critical resistance level at around $6.24, as shown in the chart below.LEO/USD daily price chart. Source: TradingViewThe level was instrumental in capping the token’s upside attempts between February and April earlier this year. It again prompted traders to secure profits on July 1, leaving LEO with a large upside wick and thus hinting at bearish rejection.LEO’s recent price trends are full of bearish rejection candles, including its 57% intraday price rally on Feb. 8 that preceded a 28.5% correction by the end of that quarter. Conversely, the token’s bullish rejection candle on June 18 resulted in a 50% price recovery, as discussed above.Related: On the brink of recession: Can Bitcoin survive its first global economic crisis?If the given fractal plays out, then LEO will risk a price reversal to its interim support level of $5.52, which, coincides with the token’s 50-day exponential moving average (50-day EMA; the red wave). That would mean a modest 9%-10% decline from July 1’s price.But if the support fails to hold, as it had in late April, LEO price then risks testing its 200-day EMA (the blue wave) near $5, a 17% decline overall.The views and opinions expressed here are solely those of the author and do not necessarily reflect the views of Cointelegraph.com. Every investment and trading move involves risk, you should conduct your own research when making a decision.

Čítaj viac

Ethereum $1K price support in danger as Q2 comes to a close

Ethereum’s native token Ether (ETH) fell on the final trading day of Q2/2022, trading in sync with riskier assets amid persistent fears of higher inflation and rising interest rates. And it could result in further declines heading into Q3.ETH price breakdown underwayETH’s price plunged nearly 5% this June 30 to $1,044 following a four-day losing streak. The ETH/USD pair has also broke below its interim rising trendline support, which in conjugation with a horizontal trendline resistance to the upside, constitutes an “ascending triangle” pattern.Ascending triangles are bearish continuation patterns when they occur after a sharp downtrend. Therefore, a breakdown out of an ascending triangle typically results in the price falling further lower, typically by as much as the structure’s maximum height.Ether had been trending inside an ascending triangle since June 13, breaking below the triangle’s lower trendline on June 29 — a move that accompanied a spike in trading volumes, confirming traders’ conviction about a further downtrend.ETH/USD daily price chart featuring “ascending triangle” setup. Source: TradingViewAs a result, ETH’s downside target in Q3, led by the ascending triangle setup, comes to be near $835, almost 20% lower than today’s price.Exchange reserves are risingThe bearish technical outlook is also boosted by an uptrend in the number of ETH on exchanges.Notably, investors have deposited around 1 million Ether tokens across all crypto trading platforms since May 2022, according to data from CryptoQuant. As the amount of ETH rises in exchanges’ wallets, it indicates a growing selling pressure in the Ether market.Ethereum exchange reserves. Source: CryptoQuantInstitutional investors have also been limiting their exposure in Ether by withdrawing capital from the dedicated investment funds, CoinShares noted in its weekly report.Ether-focused investment products have witnessed $136.9 million worth of outflows in June. In 2022 so far, they have processed circa $450 million in withdrawals, confirming that traditional investors are very bearish on ETH.Net flow into/out of crypto funds by assets. Source: CoinSharesETH sharks and whales buy the dipOn the bright side, the decline in Ether’s prices across June has provided some of its richest investors the opportunity to “buy the dip.”Related: ‘Can’t stop, won’t stop’ — Bitcoin hodlers buy the dip at $20K BTC”Ethereum shark and whale addresses (holding between 100 to 100K $ETH) have collectively added 1.1% more of the coin’s supply to their bags on this -39% dip [since June 7],” noted Santiment, a crypto-focused data analytics platform, adding:”Historical evidence points to this tier group having alpha on future price movement.”Ethereum ‘whale’ holdings. Source: SantimentETH number of addresses holding 100+ coins. Source: Glassnode.Additionally, smaller investors have also been showing a similar dip-buying sentiment, with a consistent increase in addresses holding at least 0.1, 1, and 10 ETH since the end of last year, data from Coinglass shows.Ether’s price is currently down nearly 75% year-to-date.The views and opinions expressed here are solely those of the author and do not necessarily reflect the views of Cointelegraph.com. Every investment and trading move involves risk, you should conduct your own research when making a decision.

Čítaj viac

Uniswap analysis: UNI price can double based on a classic technical pattern

Uniswap (UNI) market valuation could grow by 100% in the second half of 2022 as it paints a classic bearish reversal pattern.UNI price bullish setupDubbed “inverse head and shoulders (IH&S),” the technical setup takes shape when the price forms three troughs in a row below a common support level (neckline), with the middle one (head) deeper than the other two (shoulders). Additionally, it resolves after the price breaks above the support level.The UNI price trend since May 23 checks all the boxes for forming an IH&S pattern, except the right shoulder. A retest of its neckline near $5.71 would form the right shoulder, increasing the possibility of an iH&S breakout scenario, as shown below.UNI/USD daily price chart featuring IH&S setup. Source: TradingViewAs a rule of technical analysis, the price breaking out of an IH&S structure can rally by as much as the maximum distance between its head’s lowest point and the neckline. So, UNI’s IH&S’s upside target comes to be around $9.78, up over 100% from June 2’s price.Conflicting Uniswap price signalsUniswap’s longer-timeframe charts bring attention to resistance levels that could keep UNI from touching their IH&S target.That includes an interim resistance level of around $6 that has rejected UNI’s price lower at least thrice since May. A successful break above the $6-level could have UNI face the February 2022 support of around $7.52 whose test preceded a 75% price rally to $12.48.23.The $7.52-level also coincides with UNI’s 20-week exponential moving average (20-week EMA; the green wave in the chart below), now near $7.90.UNI/USD 1-week candle chart. Source: TradingviewConversely, a decisive pullback from the $6-resistance level could trigger a result in a bearish technical setup, dubbed as a “bear flag.”Related: Finance Redefined: Uniswap goes against the bearish trends, overtakes EthereumUNI has already been returning lower after testing levels around $6, which coincides with the flag’s upper trendline. That leaves the UNI/USD pair two potential scenarios: decline toward the flag’s lower trendline near $3.92, or rebound for a potential breakout above the upper trendline.UNI/USD three-day price chart featuring ‘bear flag’ setup. Source: TradingViewUNI’s move toward $3.92 would risk triggering the bear flag breakdown scenario, meaning a 45%-plus decline to $2.75 when measured from June 2’s price. On the other hand, a break above the upper trendline would invalidate the flag setup altogether.The views and opinions expressed here are solely those of the author and do not necessarily reflect the views of Cointelegraph.com. Every investment and trading move involves risk, you should conduct your own research when making a decision.

Čítaj viac

Double bubble? Terra's defunct 'unstablecoin' suddenly climbs 800% in one week

Terra’s $40-billion experiment to create a functional “algorithmic stablecoin” project has failed drastically following its collapse in May. Nonetheless, its native stablecoin TerraClassicUSD (USTC), earlier called TerraUSD (UST), has been thriving in the past week.Dead stablecoin walkingTo recap, UST lost its U.S. dollar peg in May following mass withdrawals from Anchor Protocol, a lending and borrowing platform offering up to 20% yield to clients on their UST deposits. As of June 15, the token was almost worthless, trading at $0.005 at the Kraken crypto exchange.But USTC started recovering afterward, insomuch that its value per token almost reached $0.10 on June 29. Simultaneously, its capitalization surged from $65 million to $767 million in the same period, according to data from CoinMarketCap.USTC market cap. Source: CoinMarketCapThat is despite USTC operating as an abandoned token after Terra launched a new blockchain with a new native asset LUNA 2.0, following a “hard fork” in May.Interestingly, LUNA 2.0’s older version, called LUNA, which now operates under the name “Terra Classic (LUNC), has also witnessed a spike in its market valuation like USTC, surging from around $160 million to $767 million in June.LUNC market cap. Source: CoinMarketCapMassive concentrated Terra pumpAccording to CoinMarketCap, more than 45% of trading volume behind USTC and LUNC’s surprising price boom has originated from KuCoin, a centralized exchange platform reportedly operating from Seychelles.KuCoin’s lead backer is NEO Global Capital, a Singapore-based venture capital firm also exposed to financial platforms like Babel Finance and CoinFLEX. Both platforms have been facing liquidity troubles due to the ongoing crypto market decline.”This isn’t a boom, bust and boom again cycle,” warned InvestmentU, a financial analytics group in its June 28 note, saying that LUNC could decline massively because “the tech behind it is dead.””Its (LUNC) raison d’etre has been vanquished. And so has its price. While we can appreciate investors’ natural desires for outsized gains, there are better ways to go about it than this.”Related: Terra’s LUNA2 skyrockets 70% in nine days despite persistent sell-off risksThe outlook appears the same for USTC, which has failed to perform its main function, i.e. providing clients a digital, stable version of the U.S. dollar.This is a game for whales Dump Next Time ☝️ all newcomers Lose Money — Crypto Bull (@_Crypto_Bull) June 29, 2022The views and opinions expressed here are solely those of the author and do not necessarily reflect the views of Cointelegraph.com. Every investment and trading move involves risk, you should conduct your own research when making a decision.

Čítaj viac

Can Cardano's July hard fork prevent ADA price from plunging 60%?

Cardano (ADA) has started painting a bearish continuation pattern on its longer-timeframe charts, raising its likelihood of undergoing a major price crash by August.ADA price in danger of a 60% plungeDubbed the “bear pennant,” the pattern forms when the price consolidates inside a range defined by a falling trendline resistance and rising trendline support after a strong move downside. Additionally, the consolidation moves accompany a decrease in trading volumes. Bear pennants typically resolve after the price breaks below their trendline support and, as a rule, could fall by as much as the height of the previous big downtrend, called a “flagpole,” as illustrated in the chart below. ADA/USD three-day price chart featuring “bear pennant'”setup. Source: TradingViewAs a result, a decisive breakdown below ADA’s bear pennant structure could mean extended declines to the level at length equal to the flagpole. In other words, the target for Cardano’s price will be $0.20, down over 60% from June 28’s price.In the meantime, ADA shows signs of consolidating inside the pennant’s range with its imminent bias looking skewed toward bulls. This opens the door for ADA/USD to rebound from the pennant’s rising trendline support near $0.46 to rally toward its falling trendline resistance around $0.60 by July. Cardano’s Vasil hard forkDespite the interim bearish outlook, Cardano could get a boost from its upcoming “Vasil” hard fork.The upgrade, originally scheduled for June end, will now go live sometime in July and aims to improve the Cardano network’s speed and scalability. Related: Institutional crypto asset products saw record weekly outflows of $423MIn addition, Vasil is expected to make Cardano more developer-friendly, which proponents argue could even attract projects from rivaling layer-one blockchains, leading to a higher demand for ADA.ADA’s price has a history of rising in the days leading up to Cardano hard forks, which should boost its chances at a rally alongside favorable technicals, as shown below.ADA/USD three-day price chart featuring ‘bear pennant’ setup. Source: TradingViewWhat’s more, ADA also has a history of plunging hard after its hard forks in a sell-the-news fashion. Thus, Cardano could be setting up to resume its downtrend after Vasil goes live in July, which would fall in line with the bear pennant discussed above.ADA/USD and Nasdaq’s weekly correlation coefficient. Source: TradingViewAt the same time, Cardano’s price remains almost in lockstep with U.S. equities amid the Federal Reserve’s interest rate hiking, which should continue to put downward pressure on its price in the short to medium term. The views and opinions expressed here are solely those of the author and do not necessarily reflect the views of Cointelegraph.com. Every investment and trading move involves risk, you should conduct your own research when making a decision.

Čítaj viac

Získaj BONUS 8 € v Bitcoinoch

nakup bitcoin z karty

Registrácia Binance

Burza Binance

Aktuálne kurzy