Autor Cointelegraph By Yashu Gola

DOGE days of summer: Shiba Inu gains 40% on Dogecoin two months after record lows

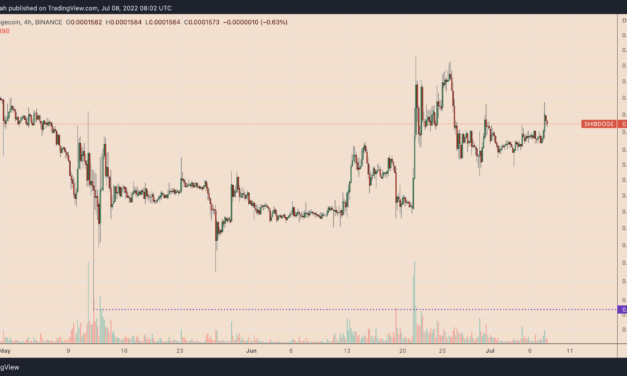
Shiba Inu (SHIB) has grown stronger against its top “memecoin” rival Dogecoin (DOGE) in the last two months, in part due to the token’s periodic token burning events and a flurry of project announcements that promises to boost its utility.Why is the SHIB price rallying?In detail, SHIB/DOGE gained a little over 40% after bouncing from 0.0001120 on May 12, its lowest level on record. SHIB/USD four-hour price chart. Source: TradingViewCoin burn is the most logical explanation behind SHIB’s recent rally against DOGE. The process involves sending SHIB tokens to a wallet without a master, i.e., removing them out of circulation permanently against the total one quadrillion supply (half of which were sent to Ethereum’s co-founder Vitalik Buterin.The Shiba Inu network has burnt more than 410 trillion SHIB tokens (~$4.5 billion at today’s price) from its initial supply, according to data tracking portal ShibBurn.com.Shiba Inu supply. Source: ShibBurn.comDogecoin does not boast a coin burn feature and comes with an uncapped supply. That could give traders a reason to accumulate SHIB over DOGE, primarily during a crypto bear market when almost all digital assets fall against the U.S. dollar.JUST IN: $SHIB @Shibtoken is back on top 10 purchased tokens among 1000 biggest #ETH whales in the last 24hrs Peep the top 100 whales here: https://t.co/jFn1zIOq03(and hodl $BBW to see data for the top 1000!)#SHIB #whalestats #babywhale #BBW pic.twitter.com/2o5A0yhHy4— WhaleStats – BabyWhale ($BBW) (@WhaleStats) July 5, 2022As a result, SHIB’s losses against the U.S. dollar since May 12 stand around -7.5% versus DOGE’s 17.5% losses in the same period.SHIB/USD versus DOGE/USD daily price chart. Source: TradingViewThe Shiba Inu ecosystem growsShiba Inu’s launch came with a promise that it would be a better version of Dogecoin.The project attempted so by offering some potential applications, such as smart contracts and an exclusive decentralized exchange called ShibaSwap that enables users to stake SHIB for “BONE” and “LEASH,” two other tokens within the Shiba Inu ecosystem. ShibaSwap trading volume. Source: Nomics.comOn July 6, Shiba Inu’s pseudonymous developer Shytoshi Kusama (not to be confused with the blockchain project Kusama), teased followers with the launch of an “algorithmic stablecoin” called SHI, coupled with a reward token “TREAT” and a collectible card game for its metaverse.On the other hand, Dogecoin has Elon Musk, the CEO of Tesla and SpaceX, who has already enabled DOGE payments at the companies’ online merchandise stores and is playing with the idea of doing the same on Twitter. Earlier this week, Musk’s Boring Company also enabled Dogecoin payments for its Las Vegas transit system “Loop.”What’s next for SHIB/DOGESHIB’s ongoing rally against DOGE risks exhaustion due to a classic bearish reversal pattern.Notably, SHIB/DOGE has been fluctuating inside a rising wedge, defined by two ascending, converging trendlines. Rising wedges typically resolves after the price breaks below their lower trendlines, accompanied by a rise in trading volume. Related: Bitcoin price surges to $21.8K, but analysts warn that the move could be a fakeoutIn theory, the breakdown move could pull the price to the level whose length is equal to the maximum distance between the wedge’s upper and lower trendlines. The chart below shows SHIB/DOGE in a similar setup.SHIB/DOGE daily price chart featuring ‘rising wedge’ breakdown setup. Source: TradingViewAs a result, the pair risks falling to the 0.0001233-0.0001348 range depending on its breakdown point, a 15-20% drop from current price levels.The views and opinions expressed here are solely those of the author and do not necessarily reflect the views of Cointelegraph.com. Every investment and trading move involves risk, you should conduct your own research when making a decision.

Čítaj viac

Ethereum 2.0 stakers face a 36.5% larger loss than ETH spot investors — report

Ethereum investors who staked millions of dollars worth of Ether (ETH) tokens to become validators on its soon-to-launch proof-of-stake (PoS) network are now facing heavy paper losses.Ether spot traders outperform stakers by 36.5%In detail, investors have locked a little over 13 million ETH into the so-called Ethereum 2.0 smart contract since it went live in December 2020. However, there is no date when these investors can redeem their tokens alongside the 10% yield.Interestingly, around 62% of Ether tokens were deposited before the price peaked at around $4,930 in November 2021. Meanwhile, the other 38% were deposited after the record high, according to Glassnode’s latest report.Ethereum 2.0 total value staked. Source: GlassnodeAs a result, the total value locked inside the Ethereum 2.0 smart contract peaked at $39.7 billion in November 2021, led by 263,918 network validators. But now, the value has dropped to $14.85 billion as of July 7, despite an additional inflow of 5 million ETH in the last eight months.Ethereum 2.0 stakers deposited ETH to the network’s PoS contract at an average price of $2,390. So, ETH stakers are now holding an average loss of 55% as a result of ETH’s 75% crash since November 2021, Glassnode noted.Excerpts from its report:”If we compare this to the Realized Price for the entire ETH supply, 2.0 stakers are currently shouldering 36.5% larger losses compared to the general Ethereum market.”ETH 2.0 total value staked realized price versus market price. Source: GlassnodePossible bullish and bearish scenariosEther’s bear market has also affected Ethereum 2.0 contract inflows.Notably, the weekly average of 32 ETH deposits into the Ethereum 2.0 contract has fallen to 122 a day compared to 500 to 1,000 per day in 2021. This suggest investors’ reluctance to lock their ETH holdings away amid a bear market.Ethereum 2.0 number of new deposits. Source: GlassnodeFrom a technical perspective, investors’ fears seem to be legitimate.Ether risks undergoing a major breakdown in Q3/2022 since it has been painting a classic continuation pattern called the ascending triangle, as illustrated in the chart below. Therefore, ETH’s price could decline to nearly $800, almost 32% lower than today’s price.ETH/USD daily price chart featuring ascending triangle setup. Source: TradingViewConversely, Ethereum’s switch to PoS is almost near after a successful trial on July 6, as Cointelegraph covered here. That could have ETH hold above its interim support of around $1,070, as shown in the chart below.ETH/USD weekly price chart. Source: TradingViewCoupled with an “oversold” relative strength index (RSI) reading (below 30), ETH could rebound toward its 200-week exponential moving average (the blue wave) near $1,600. That would mark a 35%-plus rally from today’s price.Related: What does a bear-market ‘cleanse’ actually mean?A similar setup appears in the ETH/BTC instrument, which tracks Ether’s strength against Bitcoin (BTC). Ethereum’s successful switch to PoS could have ETH hold above 0.057 BTC, followed by a move upside toward 0.06 BTC, according to Fibonacci retracement graph levels shown below.ETH/BTC weekly price chart. Source: TradingViewMeanwhile, macro risks remain the main danger for ETH price, namely the Federal Reserve’s potential 75 basis point rate hike in July.The views and opinions expressed here are solely those of the author and do not necessarily reflect the views of Cointelegraph.com. Every investment and trading move involves risk, you should conduct your own research when making a decision.

Čítaj viac

Bitcoin mining stocks rebound sharply despite a 70% drop in BTC miners' revenue

Bitcoin (BTC) mining companies have suffered in 2022 due to the crypto bear market. Nonetheless, their stocks collectively saw a sharp rebound on July 6, raising hopes that investors have started to buy the dips.One of the intraday winners was Bitfarms (TSE: BITF), which surged by over 24% to close at $1.29. Similarly, Marathon Digital Asset Holdings (NASDAQ: MARA), Core Scientific (NASDAQ: CORZ), and Cathedra Bitcoin (CVE: CBIT) rose by over/around 12.5%, 16.22%, and 15%, respectively.MARA, CORZ, BITF, and CBIT daily price chart. Source: TradingViewBitcoin miners’ revenue down 70% from peakThe rallies come as a breather in what has been a bad year for mining stocks. A nearly 60% year-to-date plunge in the BTC price and a rise in “mining difficulty” have pushed the miners’ daily revenues lower by over 70% from their November 2021 peak of $62 million.Bitcoin daily miner revenue versus difficulty. Source: CoinMetrics/Arcane ResearchThe outcome is bad for all the mining stocks, including the ones mentioned above. For instance, BITF is still down 86% from its peak in pre-market trading on July 6 despite a 24% rebound in the previous session.Similarly, MARA, CORZ, and CBIT have been trading 80%–93% below their record highs in November 2021, showing a far deeper drawdown than Bitcoin, whose price has dropped 67% in the same timeframe.Mining stocks vs. BTC/USD (blue) daily price chart. Source: TradingView”Short covering” to trap bulls? Bitcoin mining stocks risk further downside, however, given a potentially lengthy bear market led by macro risks.Thus, the sharp rebound witnessed across the Bitcoin mining stocks could be due to “short covering” or investors buying the dip, according to Balmy Investor, a pseudonymous analyst.#Bitcoin mining stocks bounced strong today, with very little change in #BTC price. Likely some short covering, and some investors moving in to buy oversold levels.Quick June observations. Working on Q2 report with @hashrateindex. ☘️— Balmy_investor ⛏️ (@balmy_investor) July 6, 2022Covering shorts involves buying back the borrowed underlying asset to close a short position at a profit or loss. That typically leads to frequent rebound moves, especially during a bear market, where bulls are at risk of being trapped.Related: Core Scientific sold $167M worth of Bitcoin holdings in JuneFor instance, the MARA stock chart below shows several cases of short-lived upside runs during an overall bearish cycle.MARA/USD daily price chart. Source: TradingViewMeanwhile, “oversold” bounces are typically triggered when an asset’s relative strength index (RSI) slips below 30, which many traditional technical analysts consider a buy signal.The RSI readings of Marathon Digital Asset Holdings, Core Scientific, Cathedra Bitcoin, and Bitfarms were below 30 as of July 6.The views and opinions expressed here are solely those of the author and do not necessarily reflect the views of Cointelegraph.com. Every investment and trading move involves risk, you should conduct your own research when making a decision.

Čítaj viac

Circle's USDC on track to topple Tether USDT as the top stablecoin in 2022

The growth of Circle’s native stablecoin USD Coin (USDC) in the last two months compared to its $66-billion rival giant Tether (USDT) is nothing short of spectacular.USDT, USDC market cap ratio hits the lowest on recordNotably, USDC’s market capitalization has grown by 8.27% since May, reaching its highest level of $55.9 billion on July 2. In contrast, USDT has suffered an over 19% drop in its market valuation, currently treading around $66.14 billion.USDT circulating market cap. Source: MessariThis is the closest USDC has come to challenging USDT’s supremacy in the stablecoin sector based on the diminishing gap between their market caps.In detail, the USDT to USDC market cap ratio was above “9” in August 2020. However, in July, it dropped to 1.20, the lowest on record, as shown in the chart below.USDT to USDC market cap ratio. Source: TradingViewAt the current rate — and with less than $10 billion now separating the two stablecoins — USDC can surpass USDT by market capitalization in a few months, if not weeks. Interestingly, USDC has already flipped USDT regarding “real volume” atop the Ethereum blockchain.USDT sails through doubtsCrypto investors have turned cautious since the collapse of Terra’s $40 billion “algorithmic stablecoin” project in May, fearing that the same could happen to USDT. That is primarily due to speculations that Tether’s USDT tokens are not 100% backed by cash and other traditional assets as it claims.As a result, short sellers have boosted their bets on the possibility that USDT would soon fall below its $1-peg, with the Wall Street Journal reporting that these bearish positions could be worth “hundreds of millions” of dollars.Related: Tether is an ‘instrument of freedom’ and ‘Bitcoin onramp,’ says Tether CTOThese bets anticipate that Tether would not be able to redeem all its USDT for a dollar in a “bank run” like scenario. As a result, people would start selling their stablecoin at a discount, breakin the peg.USDT has a history of going below or above its $1-peg during extreme market volatility, though this was more pronounced in its earlier days. For instance, in October 2018, the token’s value dropped to as low as $0.85 (on Kraken) amid rumors that one of its sister companies (crypto exchange Bitfinex) is insolvent.USDT price chart since 2015. Source: CoinMarketCapThe same happened after the Terra collapse in May, with USDT’s value briefly plummeting to as low as $0.97. Nonetheless, the stablecoin recovered its dollar peg every time.In contrast, USD Coin has slipped below the usual $0.99-1 only twice since its launch in 2018. It dropped to $0.97 during the “Covid crash” in March 2020, only to recover to $1 and fall again to $0.98 in the same month.USDC price chart since 2019. Source: CoinMarketCapCrypto investors have strengthened their trust in USDC primarily due to Circle functioning as a money service business, registered with FinCEN and other 46 state regulators in the U.S. As a result, the firm reports its reserves to the authorities in line with money transmission laws. Also, Circle is audited by Grant Thornton, a leading global accounting firm.Related: USD stablecoin premiums surge in Argentina following economy minister’s resignationPaolo Ardoino, the chief technical officer at Tether, committed in June that they would have their reserves fully audited by one of the top 12 accounting firms. For now, accounting company MHA provides quarterly attestations of Tether reserves.Everyone is talking about bearish things, but most of them haven’t left the crypto market. They’re just waiting for the bottom.#Bitcoin marketcap decreased by -70% from the top while stablecoin went down by just -11%. pic.twitter.com/dhgDzi9g2A— Ki Young Ju (@ki_young_ju) June 30, 2022Until that happens, USDC is on track to close the gap with USDT for a potential flippening event, particularly as stablecoin demand remains high amid global economic turmoil.The views and opinions expressed here are solely those of the author and do not necessarily reflect the views of Cointelegraph.com. Every investment and trading move involves risk, you should conduct your own research when making a decision.

Čítaj viac

Bitcoin's inverse correlation with US dollar hits 17-month highs — what's next for BTC?

Bitcoin (BTC) has been moving in the opposite direction of the U.S. dollar since the beginning of 2022 — and now that inverse relationship is more extreme than ever.Bitcoin and the dollar go in opposite waysNotably, the weekly correlation coefficient between BTC and the dollar dropped to 0.77 below zero in the week ending July 3, its lowest in seventeen months. Meanwhile, Bitcoin’s correlation with the tech-heavy Nasdaq Composite reached 0.78 above zero in the same weekly session, data from TradingView shows.BTC/USD and U.S. dollar correlation coefficient. Source: TradingViewThat is primarily because of these markets’ year-to-date performances amid the fears of recession, led by the Federal Reserve’s benchmark rate hikes to curb rising inflation. Bitcoin, for example, has lost over 60% in 2022, while Nasdaq’s returns in the same period stand around minus 29.72%.On the other hand, the dollar has excelled, with its U.S. dollar index (DXY), a metric that measures its strength against a basket of top foreign currencies, hovering around its January 2003 highs of 105.78.BTC/USD vs. DXY vs. NDAQ weekly price chart. Source: TradingViewWill dollar rise further?The Fed appears compelled to increase benchmark rates based on how traders have priced the front-end derivative contracts. Notably, traders anticipate the Fed to raise the rates by 75 basis points (bps) in July. They also bet Fed won’t raise rates beyond 3.3% by this year’s end from the current 1.25%-1.5% range.However, a push to 3.4% by the first quarter of 2023 could have the central bank dial back its aggressive tightening. That could result in a 50 basis point cut by the end of next year, as shown in the chart below.Changes in Fed’s interest rate target. Source: TradingViewAn early rate cut could happen if the inflation data cools down, thus limiting investors’ appetite for the dollar, according to Wall Street analysts surveyed by JPMorgan. Notably, around 40% see the dollar ending 2022 at its current price levels — around 105.Meanwhile, another 36% bet that the greenback would correct ahead of the year’s close.”Foreign exchange is not a linear world. At some point, things flip,” noted Ugo Lancioni, head of global currency at Neuberger Berman, adding: “I personally have a bias to short the dollar at some point.”Bitcoin to bottom out in 2022?In addition, the dollar’s ability to continue its rally for the rest of 2022 could be hampered by a classic technical pattern.First spotted by independent market analyst Agres, the DXY’s “double top” pattern is partially confirmed due to its two consecutive highs and a common support level of 103.81. As a rule of technical analysis, the double top pattern could resolve when the price breaks below the support and falls by as much as the structure’s maximum height, as shown in the chart below.DXY daily price chart. Source: TradingViewAs a result, DXY’s double top profit target comes to be near 101.8, down over 3.25% from today’s price.”The dollar is extremely overbought and overheated,” explained Agres, adding that its correction in the coming sessions could benefit stocks and cryptocurrencies.”Finally, looking like it [DXY] will topple down hard. In perfect confluence for a melt-up scenario. When [the] dollar goes down, stocks and crypto rally.”Related: Bitcoin trader says expect more chop, downside, then sideways price action for BTC this summerMeanwhile, Bitcoin’s “MVRV-Z Score” has also fallen into a range that has historically preceded sharp, long-term upside retracement. This on-chain indicator predicts that Bitcoin could bottom around $15,600 in 2022.The views and opinions expressed here are solely those of the author and do not necessarily reflect the views of Cointelegraph.com. Every investment and trading move involves risk, you should conduct your own research when making a decision.

Čítaj viac

Získaj BONUS 8 € v Bitcoinoch

nakup bitcoin z karty

Registrácia Binance

Burza Binance

Aktuálne kurzy