Autor Cointelegraph By Yashu Gola

Ethereum price risks 'bear flag' breakdown, 20% drop against Bitcoin

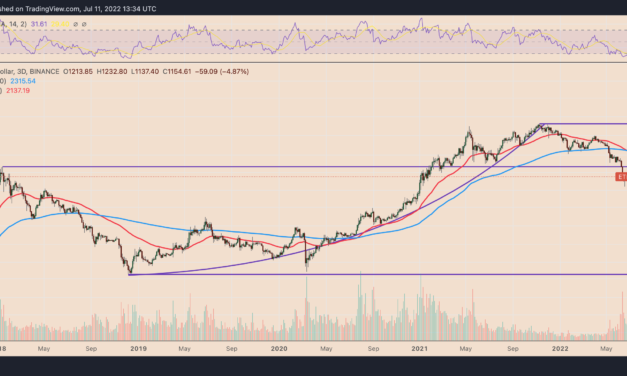
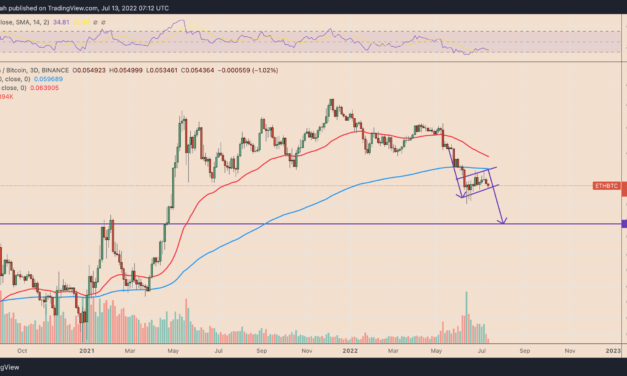
Ethereum’s native token, Ether (ETH), is down nearly 40% against Bitcoin (BTC) since December 2021. But even more pain is possible for the ETH/BTC pair in the coming weeks, based on a classic technical indicator.Ethereum price risks technical breakdownThe ETH/BTC chart has been forming a bear flag since early June 2022 on the three-day timeframe. In detail, bear flags are considered bearish continuation patterns that form as the price consolidates higher inside a range defined by two ascending, parallel trendlines after a sharp decline. They resolve after the price breaks below the lower trendline, i.e., in the direction of its previous downtrend.As a rule of technical analysis, a bear flag’s downside target comes to be at the length equal to the size of the previous downside move. Lately, ETH/BTC has been eyeing a similar breakdown, with its profit target sitting around 0.0439, down almost 20% from today’s price.ETH/BTC three-day price chart featuring “bear flag” pattern. Source: TradingViewNonetheless, bear flags have an average success rate of around 67% when it comes to meeting its profit targets, according to Samurai Trading Academy’s study. Additionally, veteran analyst Tom Bulkowski sees the bear flag meeting its target only 46 times out of 100 attempts.Looks like “actual death”A separate technical setup shared by analyst Pentoshi shows Ether facing the possibility of falling much lower than bear flag’s profit target.Pentoshi suggests that ETH/BTC could dip toward an ascending trendline that has been serving as its support since September 2019 — the level comes near 0.036, down 30% from today’s price.$ETH / $BTC looks like actual death is at the doorstep https://t.co/giJJgUDdzJ pic.twitter.com/NBEzWDx2Ks— Pentoshi (@Pentosh1) July 12, 2022Ethereum funds witness modest inflowsThe bearish setups for ETH/BTC appears in contrast with a potential recovery across Ethereum-based investment funds.Related: 3 key metrics suggest Bitcoin and the wider crypto market have further to fallIn detail, Ethereum funds amassed $7.6 million in the week ending July 8, according to CoinShares’ latest report.Net U.S. dollar flows into/out of crypto-based funds (by asset). Source: CoinShares/Bloomberg”The inflows suggest a modest turnaround in sentiment, having endured 11 consecutive weeks of outflows that brought 2022 outflows to a peak of $460 million,” the report notes, adding: “This improvement in sentiment is may be due to the increasing probability of the Merge, where Ethereum moves from proof-of-work to proof-of-stake, happening later this year.”The views and opinions expressed here are solely those of the author and do not necessarily reflect the views of Cointelegraph.com. Every investment and trading move involves risk, you should conduct your own research when making a decision.

Čítaj viac

Bitcoin price indicator that marked 2015 and 2018 bottoms is flashing

Bitcoin (BTC) could undergo a massive price recovery in the coming months, based on an indicator that marked the 2015 and 2018 bear market bottoms.What’s the Bitcoin Pi Cycle bottom indicator? Dubbed “Pi Cycle bottom,” the indicator comprises a 471-day simple moving average (SMA) and a 150-period exponential moving average (EMA). Furthermore, the 471-day SMA is multiplied by 0.745; the outcome is pitted against the 150-day EMA to predict the underlying market’s bottom.Notably, each time the 150-period EMA has fallen below the 471-period SMA, it has marked the end of a Bitcoin bear market. For instance, in 2015, the crossover coincided with Bitcoin bottoming out near $160 in January 2015, followed by an almost 12,000% bull run toward $20,000 in December 2017.BTC/USD weekly price chart featuring ‘pi cycle bottom’ indicator. Source: TradingViewSimilarly, the second 150-471 MA crossover in history marked the end of the 2018 bear cycle. It also followed a 2,000% price rally — from nearly $3,200 in December 2018 to $69,000 in November 2021.Only the third time in historyThis week, Bitcoin’s 150-day EMA (at $32,332 as of July 12) is set to close below its 471-day EMA (at $32,208), thus logging the third Pi Cycle bottom in its history.BTC/USD weekly price chart featuring the next potential  cycle bottom. Source: TradingViewThe crossover appears as Bitcoin wobbles around $20,000, after a 75%-plus price correction from its peak level of $69,000. Related: Bitcoin price may bottom at $15.5K if it retests this lifetime historical support levelThe BTC/USD pair has been flirting with the level for almost a month, with the latest MLIV Pulse survey noting that its price has more possibility to fall toward $10,000 than rebound toward $30,000. The fears emerge due to an ongoing crypto market carnage led by the failure of several high-profile companies.MLIV Pulse Survey results on Bitcoin’s next trend. Source: BloombergMeanwhile, hawkish central bank policies that focus on removing excess cash from the economy have also spooked investors. Nevertheless, Bitcoin could rebound to at least $30,000 if the given bottom fractal plays out. The interim upside target coincides with the 0.236 Fib line of the Fibonacci retracement graph drawn from the $69,000-swing high to the $17,000-swing low, as shown in the chart above.The views and opinions expressed here are solely those of the author and do not necessarily reflect the views of Cointelegraph.com. Every investment and trading move involves risk, you should conduct your own research when making a decision.

Čítaj viac

3 reasons why Solana can repeat Ethereum's 2018 fractal to 5,000% gains

Solana (SOL) still has room to fall in the near term, but SOL/USD can rally 5,000% if it follows in the footsteps of its top rival Ethereum. That Ethereum 2018 fractalSOL risks dropping to $15 on anticipations it would behave like Ethereum during the market crash in 2018.Notably, Ethereum’s native token Ether (ETH) price fell to nearly $79 in December 2018 after undergoing a 95% correction earlier that year from its peak of $1,529. Afterward, it underwent a long recovery, rising nearly 6,000% over the next four years and thus hitting a record high of around $4,950 in November 2022.ETH/USD three-day price chart. Source: TradingViewSolana, which rivals Ethereum for its top spot in the smart contracts sector, has fallen by over 85% after peaking out in November 2021 at nearly $267. That leaves the token with the room to fall by another 10% when measured from its said record high.Popular analyst PostyXBT says SOL could decline to $15, thus mirroring Ethereum’s bear cycle in 2018. What’s more, the Solana token could see an Ethereum-like recovery in the coming years that could take SOL price to over $750, he adds.$ETH did a ~60x from the 2018 lows despite many people calling for it to hit zero…If $SOL drops to $15 I think a ~50x is on the cards whilst people call for it to nuke to zero.For those who question the functionality issues and outages, remember that hype always wins.— Posty (@PostyXBT) July 11, 2022Meanwhile, another popular analyst, Spencer Noon, thinks on the same lines, albeit without sharing a clear upside target. Noon argues that Solana has been going through a “disillusionment” phase that plagued the Ethereum market in 2018, noting that the project would eventually overcome its difficulties.”Solana has a vibrant developer ecosystem, and its downtime issues are solvable. This will be obvious in retrospect,” he said.Solana funds attract $110M in 2022Solana-based investment funds have attracted over $110 million in inflows in 2022 as of July 1, compared to $450.9 million that exited Ethereum funds, according to a recent weekly report by CoinShares. Net inflows into/out of crypto funds by assets. Source: CoinSharesThe fund inflows appear as Solana’s market capitalization gradually creeps toward Ethereum’s following its launch in March 2020.The Ethereum/Solana market cap ratio is currently around 32.5 versus the December 2020 peak of 525.3, according to data tracked by TradingView.ETH/USD to SOL/USD market cap ratio. Source: TradingViewThe metrics suggests a strong capital shift into the Solana ecosystem, a trend that may continue in the coming years. NFT volumeSolana is also posing a serious challenge to Ethereum based on other key metrics. Related: Traders debate whether Solana (SOL) is a buy now that it’s down 87% from its all-time highFor instance, according to Nansen, Solana’s weekly volumes across major nonfungible token (NFT) marketplaces, including OpenSea and MagicEden, have been in a constant uptrend, whereas Ethereum’s have tapered off in recent months.Ethereum NFT volume (left) versus Solana’s (right). Source: NansenSolana fees vs. EthereumAdditionally, cheaper fees are the primary reason why NFT volumes on the Solana blockchain have risen compared to Ethereum, according to Arcane Research’s latest weekly report. “The pace of the Ethereum blockchain network has decreased while transaction costs have increased, making way for Solana-based NFT marketplaces to pick up steam,” the report noted, adding:”The average transaction fee on Ethereum was $6.5 in June, in contrast to the few cents users currently pay for block space on Solana.Similar to NFT volume, the amount of gas fees paid has also seen a strong uptrend since summer 2021 with a smaller drawdown from its peak. Daily Gas Paid Ethereum vs Solana$ETH $SOL pic.twitter.com/FJTibaEkVG— Whis (@whisz7) July 11, 2022

The views and opinions expressed here are solely those of the author and do not necessarily reflect the views of Cointelegraph.com. Every investment and trading move involves risk, you should conduct your own research when making a decision.

Čítaj viac

Cardano 'sharks' scoop up 79.1 million ADA ahead of Vasil hard fork

The decline in Cardano (ADA) price this year has prompted some of its richest investors to accumulate the token.Cardano sharks in buying spreeNotably, addresses holding between 10,000 and 100,000 ADA, also called “sharks,” have added 79.1 million tokens (~ $37.7 million as of July 9) to their reserves since June 9, according to data from Santiment. Cardano shark addresses. Source: SantimentMeanwhile, Cardano “whales” that hold between 100,000 and 1 million ADA have stopped selling.Holding a larger amount of ADA makes sharks and whales powerful enough to determine the token’s upcoming trends via increased volatility or decreased liquidity. Additionally, they can force “fishes,” or investors holding fewer ADA tokens, to copy their trades.The recent buying spree among the Cardano sharks hints that they have been positioning themselves for a sharp price rebound, especially as ADA trades nearly 85% below its September 2021 record high of $3.16. ADA/USD daily price chart. Source: TradingViewAnother potentially bullish catalyst is a major technical upgrade slated for the end of this month, following a successful testnet implementation on July 4. Related: What does a bear-market ‘cleanse’ actually mean?Dubbed “Vasil,” the hard fork could allow faster block creation and improve scalability for Cardano’s decentralized application ecosystem. It will also introduce interoperability between Cardano’s sidechains.ADA price “descending triangle” could spoil the partyCardano’s supportive whales and sharks sentiment contrasts with technical indicators suggesting more pain ahead.Notably, ADA’s price has been painting a “descending triangle” pattern since May 8. Descending triangles typically resolve after the price breaks out in the direction of their previous trend.ADA/USD daily price chart featuring ‘descending triangle’ setup. Source: TradingViewThus, the Cardano token could risk falling to as low as $0.31, as illustrated in the chart above.The views and opinions expressed here are solely those of the author and do not necessarily reflect the views of Cointelegraph.com. Every investment and trading move involves risk, you should conduct your own research when making a decision.

Čítaj viac

This 'biblical' Bitcoin pattern suggests BTC price can rise 30% by October

Bitcoin (BTC) may be down 70% from its November 2021 peak, but its rebound move in the past three weeks is raising the possibility of more upside in Q3.Bitcoin eyes 30% price rallyAt the core of the bullish argument is a technical pattern called the “Adam-and-Eve double bottom.” Notably, the structure appears when the price forms two bottom-and-recovery cycles. The first cycle, called “Adam,” features a pointed bottom, while the other, called the “Eve,” is round-shaped. Also, the peaks of both cycles form a common resistance line. The Adam-and-Eve pattern resolves after the price breaks above the resistance line, accompanied by a rise in trading volume. As a rule of technical analysis, the breakout’s target typically comes at a length equal to the maximum distance between the pattern’s lowest point and resistance line.BTC/USD four-hour price chart featuring Adam-and-Eve pattern. Source: TradingViewGiven the technical descriptions, BTC/USD has been nearing an Adam-and-Even pattern breakout. Suppose the price closes above the structure’s resistance line. Then, its likelihood of continuing its rally toward $28,000-$28,500 will be higher.That amounts to over 30% rally in Q3/2022 when measured from current price level.Conflicting price signal targets $16KOn larger timeframes, however, the Adam-and-Even bullish structure appears in conflict with another technical setup that suggests more pain for Bitcoin in the days ahead.Dubbed “ascending triangle,” the continuation pattern forms when the price consolidates inside a horizontal trendline resistance and rising trendline support, following a sharp move higher or lower. Related: Bitcoin price builds best weekly candle since March despite new DXY peakInterestingly, it appears to be forming on the daily-candle chart after Bitcoin’s downtrend, suggesting more downside is likely as price meets overhead resistance, as shown in the chart below.BTC/USD daily price chart featuring ascending triangle pattern. Source: TradingViewThe ascending triangle’s bearish scenario eyes the $16,000-$20,000 range depending on the breakdown point.The views and opinions expressed here are solely those of the author and do not necessarily reflect the views of Cointelegraph.com. Every investment and trading move involves risk, you should conduct your own research when making a decision.

Čítaj viac

Získaj BONUS 8 € v Bitcoinoch

nakup bitcoin z karty

Registrácia Binance

Burza Binance

Aktuálne kurzy