Autor Cointelegraph By Yashu Gola

Uniswap price risks 45% crash by September despite Robinhood listing

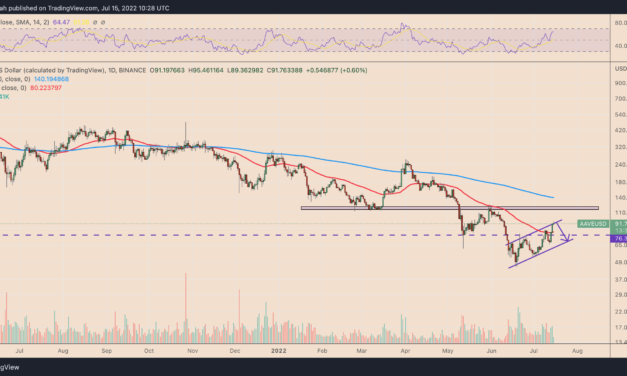
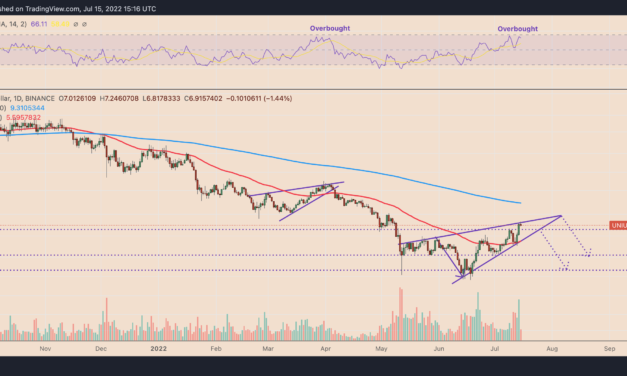
The latest Uniswap (UNI) chart pattern suggests that investors should be prepared for a correction after gaining nearly 20% over the past week.A 45% UNI price crash ahead?UNI’s price has been trending upward since mid-June inside what appears to be a “rising wedge,” which traditional analysts view as a bearish reversal pattern due to its history of luring bulls into buying fake-out bounces.Therefore, rising wedges resolve after the price breaks below the lower trendline. Traders typically calculate a rising wedge’s downside target by subtracting the distance between its upper and lower trendline from the breakdown point.UNI/USD daily price chart featuring ‘rising wedge’ setup. Source: TradingViewThat puts UNI’s downside target at $3.8 by September 2022, down 45% from July 15’s price if the breakdown begins near $6.52. However, the target would shift upward to $4.65 if the breakdown originates at the apex, i.e., where the wedge’s trendlines converge, resulting in a drop of 32.25% from July 15’s priceInterestingly, a rising wedge also formed between February and April. The pattern snapped a 65% upside move, with a broader 70% price slump that took UNI’s value to $3.56 per unit from around $12.50.UNI price bullish catalystsSimultaneously, Uniswap has also been painting an inverse head and shoulders (IH&S) pattern with an upside target sitting around $9.50, up 40% from current price levels.UNI/USD daily price chart featuring IH&S setup. Source: TradingViewThe bullish setup has one fundamental backing: Robinhood.Related: Crypto exchange FTX is looking into acquiring Robinhood: ReportNotably, the U.S.-based zero-fee trading app announced on July 14 that it had added Uniswap to its portfolio of cryptocurrencies for its 22.8 million retail investors. UNI is now on Robinhood @Uniswap #CryptoListing https://t.co/KBoYMziAyc— Robinhood (@RobinhoodApp) July 14, 2022Robinhood’s listing doesn’t guarantee an extended bull run, however, as the market has witnessed in Shiba Inu’s (SHIB) case. Notably, the firm’s decision to list SHIB assisted the token in rising by almost 20% on April 12 but couldn’t help it hold on to its gains. SHIB’s price has crashed by nearly 60% since its Robinhood’s listing.The views and opinions expressed here are solely those of the author and do not necessarily reflect the views of Cointelegraph.com. Every investment and trading move involves risk, you should conduct your own research when making a decision.

Čítaj viac

DeFi token AAVE faces major correction after soaring 100% in a month

The price of Aave (AAVE) has more than doubled in a month, but its bullish momentum could be reaching a point of exhaustion.AAVE price tests key inflection levelNotably, AAVE has surged by over 103% after bottoming out locally at $45.60 on June 18, hitting almost $95.50 this July 15. Nevertheless, the token’s sharp upside retracement move has brought its price closer to the level that triggered equally sharp pullbacks since early June.In other words, AAVE has been testing an ascending trendline resistance that constitutes a “bear flag,” a bearish continuation pattern. For example, the trendline’s previous test on July 9 ended up in a 20% downside move. Similarly, a similar attempt on June 24 pushed AAVE price lower by nearly 30%.AAVE/USD daily price chart. Source: TradingViewAs a result of this distribution behavior, AAVE’s ongoing attempt to break above the flag trendline could meet with extreme selling pressure. A pullback could then see AAVE/USD retest the flag’s lower trendline near $67.75 as its downside target by September, down almost 30% from July 15’s price. Meanwhile, the $76.30-level serves as interim support, primarily due to its history as a price floor in May that preceded a 60% rebound move.Bear flag breakdown scenarioAs a rule of technical analysis, the breakdown below $67.75 could see AAVE plunging by as much as the height of the “flagpole” that formed before the bear flag. That would have the token eye $35.50 as its bear flag profit target, down over 60% from the current price.AAVE/USD daily price chart featuring ‘bear flag’ breakdown setup. Source: TradingViewConversely, a continued rebound move above the bear flag’s upper trendline would invalidate the breakdown setup. In this case, the bullish target for AAVE will likely be the $115–$120 range that served as resistance in June.GHO stablecoinMore than half of the gains during AAVE’s price rally have come after its proposal to launch a U.S. dollar-pegged stablecoin called GHO.1/ Calling all GHOsts  We have created an ARC for a new decentralized, collateral-backed stablecoin, native to the Aave ecosystem, known as GHO.Read more below and discuss your thoughts for the snapshot (coming soon)!https://t.co/P7tHl9LbBe— Aave (@AaveAave) July 7, 2022Related: UNI, MATIC and AAVE surge after Bitcoin price bounces back above $20KOn July 7, Aave Companies, a centralized entity that backs Aave’s lending protocol, requested its community to vote on their “overcollateralized” stablecoin proposal. AAVE’s price surged by over 53% afterward, led by speculations that GHO would boost the DeFi token’s adoption.However, any further gains would risk pushing AAVE into “overbought” territory with its daily relative strength index (RSI) treading just five points below 70 as of July 15AAVE/USD daily relative strength index. Source: TradingViewRising above the 70 threshold could push AAVE’s price into a correction phase, likely triggering the bear flag scenario as discussed above.   The views and opinions expressed here are solely those of the author and do not necessarily reflect the views of Cointelegraph.com. Every investment and trading move involves risk, you should conduct your own research when making a decision.

Čítaj viac

Two Bitcoin price prediction polls, same outcome: $10K BTC is coming

Bitcoin (BTC) investors in China plan to buy the dip despite an ongoing market correction and a nationwide crypto ban, a new survey shows.Consensus sees Bitcoin at $10KA survey of 2,200 people conducted on China-based social media platform Weibo found that 8% of would buy Bitcoin when its price hits $18,000, according to Wu Blockchain. While 26% of the respondents prefer to wait until BTC reaches $15,000.But a majority anticipated the price to fall even further with 40% saying they would buy BTC at $10,000. In a survey of more than 2,200 people conducted in Chinese crypto community on Weibo, 8% of the voters believed that Bitcoin and Ethereum could be buy the dip when the price reached $18000/1000; 26% will buy in $15000/800; 40% will buy in $10000/500. pic.twitter.com/L2HsetMSk7— Wu Blockchain (@WuBlockchain) July 14, 2022Chinese investors more cautious on Bitcoin than U.S.Interestingly, another survey conducted by Bloomberg MLIV Pulse earlier in July yielded a similar outcome: 60% of the net 950 respondents on Wall Street calling for a $10,000 Bitcoin price.The two polls show a striking similarity in bearish sentiments of crypto speculators in the U.S. and China. Nonetheless, on-chain activity shows that investors in the U.S. have been more bullish on Bitcoin versus their Asian counterparts since June 2022. Related: Bitcoin fights key trendline near $20K as US dollar index hits new 20-year highIn particula, Bitcoin’s month-to-month price change, which tracks the 30-day change in the regional BTC price, has been positive only during U.S. sessions. Conversely, the metric has only been negative during Asian trading hours, data from Glassnode shows.Bitcoin month-over-month price change. Source: GlassnodeTechnical indicator hints at BTC price below $13KSimultaneously, weakening technicals are also starting to support further downside, particularly on the larger three-day timeframe.BTC/USD three-day price chart featuring “bear flag'”setup. Source: TradingViewBitcoin has been forming a potential “bear flag” pattern that could result in a drop below $13,000 by September, as illustrated above.As Cointelegraph reported, persistent macroeconomic headwinds for BTC/USD continue to fuel bearish arguments against increasing evidence of a possible price bottom. The views and opinions expressed here are solely those of the author and do not necessarily reflect the views of Cointelegraph.com. Every investment and trading move involves risk, you should conduct your own research when making a decision.

Čítaj viac

Polygon rallies 22% on Disney invitation euphoria — will MATIC price gains swell in July?

Polygon (MATIC) reached lofty price levels this July 14, a day after getting selected for the Walt Disney Company’s benchmark business development program.MATIC’s price surged 22.5% to $0.657 a token, its highest level in a month. In doing so, the token also climbed above its 50-day exponential moving average (50-day EMA; the red wave), a curvy resistance level that had been capping MATIC’s upside attempts since January 2022.MATIC/USD daily price chart. Source: TradingViewPolygon enters the Disney WorldMATIC’s move upside appeared synchronous with similar intraday recovery actions witnessed elsewhere in the crypto market. Nonetheless, Polygon fared better than most of its top-ranking rivals, including the cryptocurrencies Bitcoin (BTC) and Ether (ETH).And at the core of MATIC’s better performance could be the Walt Disney Company.The multinational mass media and entertainment conglomerate announced six companies that would join its 2022 Disney Accelerator to build augmented reality (AR), nonfungible tokens (NFTs), and artificial intelligence (AI) solutions. Polygon made it to Walt Disney’s list, thus becoming the only blockchain platform to have done so ever. As a result, MATIC, Polygon’s native utility and staking token, rallied better than most of its rival digital assets.HUGE for $MATICEvery day feels like another prominent Web 2 platform embracing what’s coming, and Polygon is always involved, especially when it comes to NFTs. Excited to see what they cook up https://t.co/MDNBkivZDd— N03LVentures (@N03LVentures) July 13, 2022Key MATIC R/S flip aheadPolygon now tests a resistance confluence, defined by a support-turned-resistance range of $0.61-0.67 and a Fibonacci retracement line near $0.63, for a potential breakout in July.MATIC/USD three-day price chart. Source: TradingViewA decisive move above the confluence could have MATIC pursue a run-up toward the 0.618 Fib line near $1.11, providing the token also closes above its 50-3D (red) and 200-3D (blue) EMAs. That would mean almost an 80% jump from today’s price level.#MATIC IS READY FOR A +80% PUMP. Bullish Ascending Triangle. $MATIC #CRYPTO #BTC pic.twitter.com/I3g1x98T2u— TAnalyst (@AurelienOhayon) July 14, 2022

Conversely, a pullback from the confluence would risk crashing MATIC toward the $0.29-$0.35 area, similar to how it retraced downward in June.Related: 3 key metrics suggest Bitcoin and the wider crypto market have further to fallMATIC could also erase its recent gains due to higher inflation. Notably, the crypto markets like their traditional finance counterparts have responded negatively to a persistently rising U.S. consumer price index.MATIC/USD and NASDAQ weekly correlation coefficient. Source: TradingViewOn July 13, the latest inflation data reached its four-decade high of 9.1%. As a result, investors anticipate the Federal Reserve would raise benchmark rates by a full percentage point, with Atlanta Fed President Raphael Bostic saying that the option “is in play.”A 1% rate hike in July would risk putting downward pressure on the entire crypto market, including Polygon.The views and opinions expressed here are solely those of the author and do not necessarily reflect the views of Cointelegraph.com. Every investment and trading move involves risk, you should conduct your own research when making a decision.

Čítaj viac

Dogecoin misses bullish target after Elon Musk snubs Twitter — what's next for DOGE price?

Dogecoin (DOGE) has missed a much-anticipated technical upside target and is down nearly 10% over the past week amid an ongoing spat between Elon Musk and Twitter.Musk hurts DOGE priceTo recap: Musk, whose companies Tesla, SpaceX, and Vegas Loop accept DOGE payments, had suggested introducing the same checkout option on Twitter this April.Bitcoin spoofs a breakout while Dogecoin jumps on Elon Musk’s Twitter takeover news. https://t.co/dlMH5u5jaf— Cointelegraph (@Cointelegraph) April 25, 2022Nonetheless, the Musk-Twitter deal has turned sour after the billionaire attempted to walk away from his $44 billion takeover bid. In response, the platform has sued Musk, alleging that his heart changed after suffering personal losses in the ongoing global market carnage.Some Dogecoin traders had eyed Musk’s Twitter takeover to stay bullish on DOGE/USD, considering the deal would boost the token’s adoption across the platform’s 330 million monthly active users. #Dogecoin | The number of large transactions on the $DOGE network with a value greater than $100,000 just reached a four-month high at 2,400 transactions. Such market behavior can act as a proxy for whales’ activity, suggesting how they may be positioning for a big price move. pic.twitter.com/K49QfXFVYb— Ali Martinez (@ali_charts) April 26, 2022

Dogecoin misses IH&S targetDogecoin dropped by 19.5% after Musk called off the Twitter deal on July 8. In doing so, DOGE also invalidated its prevailing “inverse head and shoulders (IH&S)” pattern that could have pushed its price per token toward $0.112, as shown below.DOGE/USD daily price chart featuring IH&S pattern. Source: TradingViewBias conflict aheadDogecoin now holds above a multi-month “mid-channel support” near $0.06 while remaining indecisive for now, as shown in the chart below.DOGE/USD three-day price chart. Source: TradingViewDOGE’s price eyes $0.09 as the next target if it rallies decisively from the mid-channel support. The upside target coincides with the descending trendline (distribution level) that has been serving as resistance since May 2021.Related: DOGE days of summer: Shiba Inu gains 40% on Dogecoin two months after record lowsConversely, a break below the mid-channel support could have DOGE’s price test $0.04 as its downside target, down 32% from today’s price. This level coincides with another descending trendline (accumulation level) that has acted as support for Dogecoin’s pric since April 2021.The views and opinions expressed here are solely those of the author and do not necessarily reflect the views of Cointelegraph.com. Every investment and trading move involves risk, you should conduct your own research when making a decision.

Čítaj viac

Získaj BONUS 8 € v Bitcoinoch

nakup bitcoin z karty

Registrácia Binance

Burza Binance

Aktuálne kurzy