Autor Cointelegraph By Yashu Gola

Solana price enters correction territory after 80% monthly gains

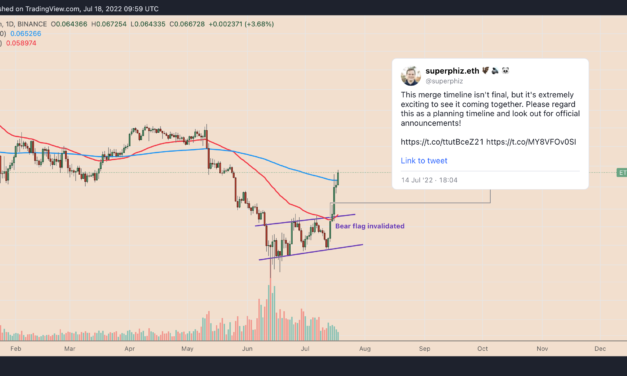
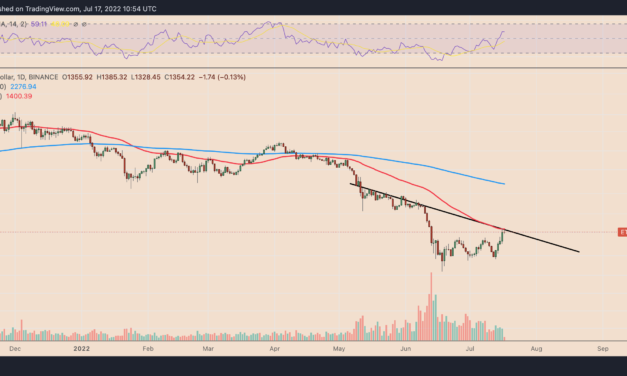
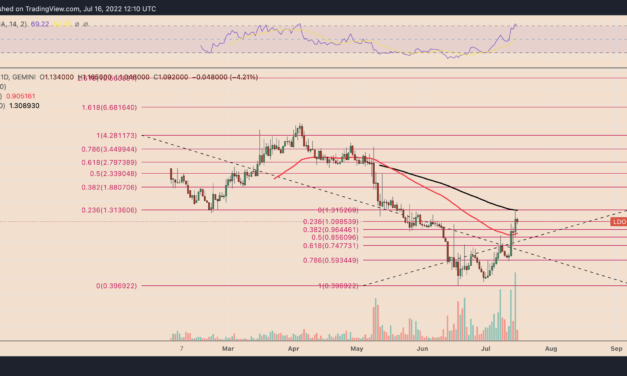
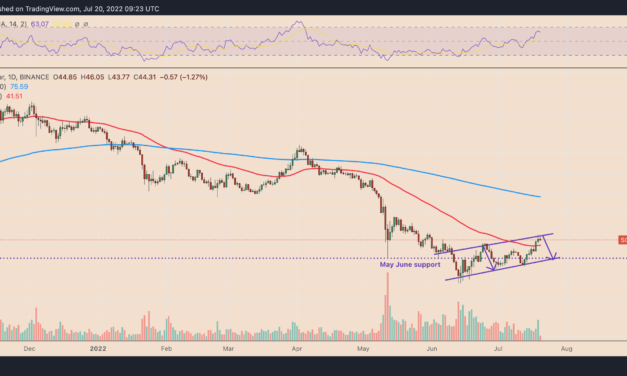
Solana (SOL) ticked modestly lower on July 20 after testing a critical technical resistance, suggesting further pullback moves in the coming weeks.SOL price eyes 50% wipeoutSOL’s price decreased by over 4% to $44 after failing to breach a multi-week ascending trendline resistance. Interestingly, this resistance level comes as a part of what appears to be a bearish continuation pattern dubbed the “bear flag.”A previous test of the same resistance trendline in late June had preceded a 30%-plus price drop, illustrating a higher distribution sentiment among SOL traders near the level. Therefore, the latest pullback from the same range could lead to an extended downside retracement. SOL/USD daily price chart. Source: TradingViewMeanwhile, the bear flag’s lower trendline has been capping SOL’s sharp pullback moves. As a result, SOL’s extended correction scenario could have its price hit the support level, now near $35.40 — a 20% drop from current price levels.Additionally, a decisive close below the lower trendline would risk triggering the bear flag breakdown setup, wherein the price falls by as much as the height of the downtrend (called “flagpole”) that preceded the flag’s formation.SOL/USD daily price chart featuring “bear flag” breakdown scenario. Source: TradingViewThat puts SOL on the road to levels near $21 by September, down over 50% from today’s price.What experts are saying about SolanaThe bear flag setup appears after SOL’s 80%-plus price rally since June 14, primarily driven by a similar recovery across the crypto market.For instance, Ether (ETH), Solana’s top rival in the smart contract space, has risen over 85% more than a month after bottoming out locally at $880. Similarly, Bitcoin (BTC) is up 35% in the same period.SOL/USD and BTC/USD daily correlation coefficient at 0.97. Source: TradingViewIndependent market analyst Altcoin Sherpa sees SOL’s price rising to the $60-$80 area in 2022 if Bitcoin continues to climb. Conversely, Andrey Diyakonov, chief commercial officer at Choise, notes that demand for SOL could drop due to Ethereum’s transition to proof-of-stake in September.”The new Ethereum protocol has the same advantages as Solana, and investors may choose to stick with Ethereum should the high gas fees and scalability woes be solved,” Diyakonov explained.Related: 3 reasons why Solana can repeat Ethereum’s 2018 fractal to 5,000% gainsPaweł Łaskarzewski, co-CEO at Synapse Network, fears SOL’s ongoing price rally could be a bull trap, noting that SOL, alongside the rest of the crypto market, still faces macro hurdles led by higher inflation and rising lending rates.He said:”We might see small ups on the price of Solana but due to the current market state, I would not expect any big changes”Solana funds add $110.8M in 2022Meanwhile, institutional interest in Solana continues to look better compared to Ethereum, according to CoinShares’ latest weekly report.Net flows into crypto funds in 2022 (by assets). Source: CoinSharesNotably, Solana-backed funds have attracted $110.8 million into its coffers since the beginning of this year. In comparison, Ethereum-based investment vehicles have witnessed withdrawals worth $446.1 million from their reserves in the same period, including $2.5 million in the week ending July 15.The views and opinions expressed here are solely those of the author and do not necessarily reflect the views of Cointelegraph.com. Every investment and trading move involves risk, you should conduct your own research when making a decision.

Čítaj viac

ApeCoin price eyes 45% rally following Otherside metaverse demo

ApeCoin (APE) rallied to start the week as traders considered Yuga Labs’ decision to open its Otherside metaverse for selected users. In doing so, the token broke out of a technical pattern that hints at another 45% price rally by September 2022.Otherside metaverse euphoriaAPE’s price surged by almost 23.5% week-to-date to reach $6.12 a token on July 19. The weekly gains came as a part of a rally that started on July 16. Interestingly, Yuga Labs invited 4,300 players of its Otherside gaming metaverse for a demo—and the tour of its Bored Ape avatar online platform—on the day of APE’s rally.APE/USD daily price chart. Source: TradingViewThat suggests traders purchased APE after taking cues from the Otherside update, given it serves as a governance token at ApeCoin DAO. This “decentralized autonomous organization,” or DAO, powers the ecosystem of apps and services deployed by Yuga Labs and third-party brands, including Otherside.APE price eyes 45% rallyThe Otherside euphoria has also prompted APE to exit a technical setup called the “ascending triangle.”Ascending triangles are typically considered continuation patterns. Nonetheless, in rare instances, ascending triangles form at the end of a downtrend, leading to a strong price reversalRelated: Time to accumulate? 5 sectors to watch during crypto winterIt appears APE’s ascending triangle had formed at the end of its downtrend. That is because the token rallied by over 100% after bottoming out locally near $3 on June 15, followed by a break above the triangle’s upper trendline near $5.22 on July 18.APE/USD daily price chart featuring ‘ascending triangle’ reversal setup. Source: TradingViewAs a rule of technical analysis, a breakout originating from an ascending triangle pushes the price north by as much as the maximum height between the triangle’s upper and lower trendline. That puts APE on the road to $8.40, up about 45% from current price levels.Conversely, a close below the triangle’s upper trendline could trigger the prevailing bearish breakdown setup, with the profit target sitting below $3.50.The views and opinions expressed here are solely those of the author and do not necessarily reflect the views of Cointelegraph.com. Every investment and trading move involves risk, you should conduct your own research when making a decision.

Čítaj viac

Ethereum price breaks out, hits 2-month high versus Bitcoin — is the rally sustainable?

Ethereum’s native token Ether (ETH) has successfully avoided a bearish technical setup to reach a two-month high against Bitcoin (BTC).ETH price bear flag invalidatedThe ETH/BTC pair invalidated its prevailing “bear flag” pattern after Ethereum developers announced this July 14 that their long-awaited switch to proof-of-stake (called the Merge) will most likely occur in September.ETH/BTC has rallied by more than 22% since the announcement, reaching 0.067, its highest level since May 25. Furthermore, the pair’s sharp upside move has pushed its net retracement gains to 37% when measured from June 13’s local bottom of 0.049.ETH/BTC daily price chart. Source: TradingViewEther tests key inflection zoneStrong fundamentals led by the Merge launch could have ETH/BTC pursue a run-up toward the 0.072-0.076 area. This range was instrumental as resistance in January and March-May. Therefore, it should serve as the next upside target for Ether bulls.But there’s a catch. Notably, ETH/BTC has been showing signs of a weakening upside momentum near what appears to be a strong resistance confluence. That includes a falling trendline resistance, a Fibonacci retracement line (near 0.066 BTC), and a support-turned-resistance area (the 0.064-0.068 BTC range), as shown below.ETH/BTC daily price chart. Source: TradingViewIn addition, ETH/BTC’s daily relative strength index, a momentum oscillator indicator, has crossed into so-called “overbought” territory, suggesting elevated risks of a sell-off. Related: ETH traders gauge fakeout risks after 40% ETH price rallyIndependent market analyst “Altcoin Sherpa” cited a similar technical setup this July 18, noting that the ongoing ETH/BTC rally could be “unsustainable.”$ETHBTC: This is a weird chart; super strong in the short term but I’m guessing this rally will be unsustainable. Really conflicting thoughts for this being ‘the bottom’; lots of FA factors coming in w. merge. Maybe .075 is next up if this area gets cleared. $ETH #Ethereum pic.twitter.com/UyjsidVuP4— Altcoin Sherpa (@AltcoinSherpa) July 18, 2022In other words, ETH/BTC could see a reversal toward 0.06 by September if the inflection resistance zone holds for a 9.5% decline. The 0.06 BTC level also coincides with the 0.236 Fib line, as shown in the chart above.The views and opinions expressed here are solely those of the author and do not necessarily reflect the views of Cointelegraph.com. Every investment and trading move involves risk, you should conduct your own research when making a decision.

Čítaj viac

Ethereum traders gauge fakeout risks after 40% ETH price rally

Ethereum’s native token Ether (ETH) saw a modest pullback on July 17 after ramming into a critical technical resistance confluence.Merge-led Ethereum price breakoutETH’s price dropped by 1.8% to $1,328 after struggling to move above two strong resistance levels: the 50-day exponential moving average (5-day EMA; the red wave) and a descending trendline (black) serving as a price ceiling since May.ETH/USD daily price chart. Source: TradingViewPreviously, Ether rallied by over 40% from $1,000 on July 13 to over $1,400 on July 16. The jump appeared partly due to euphoria surrounding “the Merge” slated for September.Meanwhile, a golden cross’s appearance on Ethereum’s four-hour chart also boosted Ether’s upside sentiment among technical analysts.#ETH/USD We got a bullish cross between 200 & 50 moving averages on 4hLooking for more upside locally pic.twitter.com/WnGY19khnK— Albert III (@AlbertcryptoN) July 15, 2022ETH price risks fakeoutEther’s 40%-plus price rally since July 13 also had its price break above a critical horizontal resistance that somewhat constitutes an “ascending triangle pattern.”Ascending triangles are typically continuation patterns. But in some cases, ascending triangles can also appear at the end of a downtrend, thus leading to a bullish reversal. Scott Melker, an independent market analyst, considered ETH’s bullish exit out of its prevailing ascending triangle pattern as a sign that it would rally further. He said: “A break above $1,284 should send prices flying, as there’s almost no resistance until the $1,700s.”Ether has already broken above $1,284 and is in a breakout zone. Nonetheless, its close above the ascending triangle’s upper trendline has not accompanied a rise in trading volumes. That suggests a weakening upside momentum, i.e., a fakeout.ETH/USD daily price chart. Source: TradingViewTherefore, ETH’s price risks a reversal toward the triangle’s upper trendline near $1,284 as support. The ETH/USD pair could retain its bullish bias if it rebounds from $1,284 with convincing volumes and breaks above the resistance confluence as discussed above. Related: Lido DAO most ‘overbought’ since April as LDO price rallies 150% in two weeks — what’s next?Conversely, a break below $1,284 would risk re-activating the ascending triangle setup with a bias skewed toward bears. As a result, ETH would risk crashing to $750, according to a rule of technical analysis as illustrated below.ETH/USD daily price chart featuring ascending triangle breakdown setup. Source: TradingViewThat means a 45% decline from current price levels. The views and opinions expressed here are solely those of the author and do not necessarily reflect the views of Cointelegraph.com. Every investment and trading move involves risk, you should conduct your own research when making a decision.

Čítaj viac

Lido DAO most 'overbought' since April as LDO price rallies 150% in two weeks — what's next?

The price of Lido DAO (LDO) dropped heavily a day after its key momentum oscillator crossed into “overbought” territory.LDO undergoes overbought correctionLDO’s price plunged to as low as $1.04 on July 16 from $1.32 on July 15, amounting to a 20%-plus decline. The token’s sharp downside move took its cues from multiple bearish technical indicators, including its daily relative strength index (RSI) and its 100-day exponential moving average (EMA).LDO’s latest plunge came after it rallied over 150% in just two weeks, a move that simultaneously pushed its daily RSI above 70 on July 15, thus turning it overbought. An overbought RSI signals that the rally may be nearing an end while readying for a short-term pullback.Meanwhile, more downside cues for the Lido DAO token came from its 100-day EMA (the black wave in the chart above) near $1.30, which capped LDO from extending its 150% price rally.LDO/USD daily price chart. Source: TradingViewIn its initial stages, the price action looked similar to LDO’s correction in April 2022, after its RSI crossed above 70 for the first time in history. Notably, the Lido DAO token had undergone a 90%-plus price decline to reach $0.39, its record low, by mid-June 2022. Related: What are the top social tokens waiting to take off? | Find out now on The Market ReportThat raises LDO’s potential to repeat the April-June 2022 correction, albeit with no exact bottom in sight. That said, the token’s interim downside target appears near its 50-day EMA (the red wave) at $0.90, down another 20% from today’s price.On the other hand, a break below the 50-day EMA would risk crashing LDO to around $0.75, which coincides with the 0.618 Fib line of the Fibonacci retracement graph drawn from $0.39-swing low to $1.31-swing high.Ethereum 2.0 expected in SeptemberOn July 15, Ethereum developers confirmed that their network’s much-awaited transition to proof-of-stake from proof-of-work, dubbed “the Merge” or “Ethereum 2.0,” would tentatively occur on September 19. LDO surged nearly 25% on the day of the announcement due to its close ties to Ethereum.In particular, LDO serves as a governance token at Lido, a liquid staking platform that has locked over 4.13 million ETH (worth around $5 billion) into Merge’s official smart contract on behalf of its users.Ethereum 2.0 total value staked by provider. Source: GlassnodePost Ethereum’s announcement, the number of Ether deposited into the Merge smart contracts via Lido increased. With Lido currently the biggest provider by total value staked, a successful Merge launch could bring more users to Lido, which, in turn, could boost demand for LDO tokens.Therefore, a technical correction in LDO’s price could follow up with a rebound toward the 100-day EMA if the Ethereum’s plans to become a proof-of-stake chain comes punctually.The views and opinions expressed here are solely those of the author and do not necessarily reflect the views of Cointelegraph.com. Every investment and trading move involves risk, you should conduct your own research when making a decision.

Čítaj viac

Získaj BONUS 8 € v Bitcoinoch

nakup bitcoin z karty

Registrácia Binance

Burza Binance

Aktuálne kurzy