Autor Cointelegraph By Yashu Gola

How high can NEAR price go in June?

NEAR, the native token of the AI- and privacy-focused Near Protocol, has been an outlier in the broader crypto market, outperforming top coins such as Bitcoin (BTC) and Ether (ETH) in recent weeks.As of Tuesday, NEAR traded as high as $2.75, marking a nearly 20% rebound in the last 24 hours. In comparison, the crypto market capitalization dropped by 3.7% in the same period.NEAR/USD four-hour chart. Source: TradingViewKey takeaways:NEAR’s bounce from a multi-year bottom zone raises the odds of its price rising toward $3.77.Fundamentals remain supportive, with NEAR Intents processing $19.69 billion in volume and generating $32.64 million in fees.NEAR fractal targets 40% price gains NEAR’s weekly chart shows the token rebounding from a long-term bottom area near $0.90–$1.10, a zone that also preceded its major rallies in 2021 and 2024.The 2021 rebound from the bottom area delivered 2,375% gains, while the 2024 recovery produced a 900% rally before the top. In each case, the rally exhausted at NEAR’s descending trend line resistance.NEAR/USD weekly chart. Source: TradingViewThe current setup is smaller but structurally similar. As of Tuesday, NEAR had bounced 225% after bottoming inside the $0.90–$1.10 area in February and was approaching its multi-year descending trend line resistance. The primary upside target came around the $3.40–$3.77 range, aligning with NEAR’s 200-week exponential moving average (200-week EMA, the blue line) and the 0.382 Fibonacci retracement level. That would mark an upside of roughly 25%–40% from current prices. Related: NEAR protocol leads AI token rally with a 50% pump: Is $5 NEAR price next?Conversely, NEAR faces strong resistance in the $2.61–$2.72 area, a range coinciding with its 100-week EMA (purple) and 0.236 Fib line. NEAR/USD weekly chart. Source: TradingViewFailing to break this level decisively may result in a pullback toward the 5o-week EMA at around $2, down by roughly 30% from current prices. Also, NEAR’s weekly relative strength index (RSI) is near 68, showing momentum is strong but nearing overheated territory. A move above 70 would put NEAR in the classic overbought zone, increasing the odds of short-term consolidation or a pullback toward $2.NEAR Intents, June upgrade support bullish CaseNEAR’s fundamentals favor the upside. Investor sentiment has improved around the protocol’s AI, privacy, and cross-chain infrastructure push. That includes NEAR Intents, a cross-chain transaction system that lets users move assets across blockchains without manually handling bridges or fragmented liquidity. The product has processed $19.69 billion in volume and generated about $32.64 million in fees, according to DefiLlama data.Near Intents TVL, fees, revenue, and DEX volumes. Source: DefiLlamaThe bullish case has also strengthened ahead of NEAR’s expected June network upgrade, which is set to introduce dynamic resharding. The feature is designed to automatically add network capacity as demand rises, improving scalability without requiring users or developers to manage the underlying infrastructure.BitMEX Co-Founder Arthur Hayes predicted that NEAR’s price will grow 20x in the long term.

Čítaj viac
Hyperliquid's HYPE breakout puts $100 price target in play

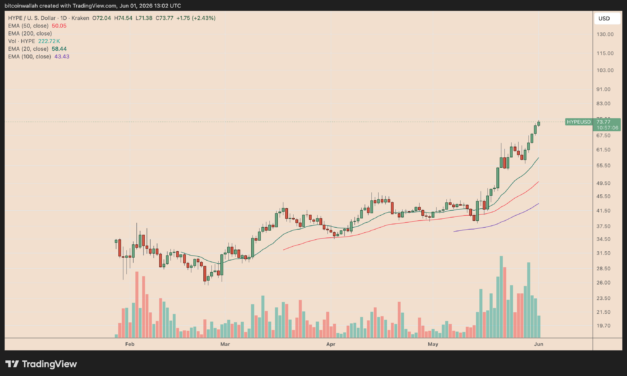
Hyperliquid’s native token, HYPE, has rallied more than 30% in five days to a record high near $74, with a bullish chart breakout now pointing to a potential move above $100.HYPE/USD daily chart. Source: TradingViewKey takeaways:HYPE has broken out of a bull pennant pattern, putting its measured upside target near $105.Hyperliquid has become the second-largest blockchain by app revenue on a 30-day rolling basis.HYPE bull pennant hints at rally toward $105Hyperliquid’s rally may have further room to run after HYPE broke out of a textbook bull pennant pattern.The setup developed after HYPE’s sharp late-May rally formed the pattern’s “flagpole,” followed by a brief consolidation inside a symmetrical triangle. During this pause, the token printed lower highs and higher lows, showing tightening volatility before the next directional move.HYPE/USD daily chart. Source: TradingViewIn technical analysis, bull pennants typically resolve when the price breaks above the upper trend line. Traders then estimate the upside target by adding the flagpole’s height to the breakout point.Over the weekend, HYPE moved above the triangle’s upper boundary on rising volume, suggesting stronger conviction behind the breakout. If the pattern plays out as intended, the price could climb toward its measured target near $105.30 by June or July, about 45% above current levels.However, momentum is becoming stretched. HYPE’s relative strength index was above 77 on Monday, placing it in overbought territory and raising the odds of a brief consolidation or correction.If profit-taking accelerates, HYPE could retest its 20-day exponential moving average near $58.32 in June. A decisive break below that level would weaken the bullish setup and risk invalidating the pennant breakout.Hyperliquid futures show a strong bullish biasDerivatives market data adds another bullish layer to HYPE’s technical breakout.Hyperliquid’s open interest has climbed to a record $3.5 billion, up from about $1.41 billion at the beginning of the year, according to Coinglass data. The sharp rise shows that more leveraged capital is entering HYPE markets as it pushes into price discovery.Hyperliquid open interest. Source: CoinGlassHYPE’s open interest-weighted funding rate stood near 0.0050% every eight hours as of Monday and has remained positive through most of the latest rally.Hyperliquid OI-weighted funding rates. Source: CoinGlassThat means long traders have been paying short traders to keep their perpetual futures positions open, a sign that leveraged demand has leaned bullish. While not extreme, the consistently positive funding rate points to a clear upside bias in HYPE’s derivatives market.Meanwhile, short sellers have taken the bigger hit during the latest rally. Since May 20, HYPE has seen about $126.28 million in short liquidations, compared with $68.85 million in long liquidations. Hyperliquid total liquidation chart. Source: CoinGlassThat imbalance suggests bearish traders have been forced to close positions as the price moved higher, creating a “short squeeze.”Further gains in HYPE could put more shorts at risk of liquidation, forcing more buybacks and potentially accelerating the move toward the $100–$105 target zone.Hyperliquid surpasses Ethereum in monthly app revenueHYPE fundamentals are also leaning bullish.Hyperliquid has overtaken Ethereum to become the second-largest blockchain by app revenue on a 30-day rolling basis, generating $57.9 million, according to DefiLlama.Top revenue-generating protocols. Source: DefiLlamaThe chain routes 99% of its protocol fees to its Assistance Fund, which buys HYPE on the open market. That buyback mechanism has become a core part of the bullish investment case for the token, as higher trading activity can lead to stronger recurring demand for HYPE.The broader backdrop for perpetual futures has also improved. On Friday, the CFTC recognized perps as useful tools for price discovery and risk management, helping legitimize the market that sits at the center of Hyperliquid’s business model, even if the protocol is not a direct beneficiary. HYPE has rallied roughly 25% since the CFTC update.Related: Hyperliquid launches prediction markets for real-world events The launch of US-listed HYPE exchange-traded funds (ETF) may also help fuel the rally. US Spot HYPE ETF net flows. Source: SoSoValueSince their May 12 debut, HYPE funds from Bitwise and 21Shares have attracted a combined $122.2 million in net assets, according to SoSoValue, pointing to early institutional demand for exposure to the digital token.

Čítaj viac

Bitcoin price targets $78K as BTC holders defend 'strongest near-term support'

Bitcoin (BTC) is rebounding from a key on-chain support zone, putting the $78,000 level back in focus for bulls.Key takeaways:BTC is eyeing a rebound to $78,200, the realized price of BTC held for three to six months.A sustained move above this cost basis could put Bitcoin on track for a push above $100,000 by year-end.BTC’s short-term holders defend $71,400 cost basisBitcoin rebounded roughly 2.5% over the weekend to reach $74,000 on Sunday, with the recovery beginning near $72,500.The local low came close to the realized price of BTC held for three to six months (orange), a cohort often used to gauge medium-term investor conviction. BTC realized price by age vs. price. Source: GlassnoderealisedGlassnode data placed that group’s cost basis near $71,400, which analyst Marcus Corvinus described as Bitcoin’s “strongest near-term support.””This cohort is still holding profits, creating a strong incentive to defend the level,” Corvinus said in a Sunday post.The analyst highlighted $78,200 as the next potential upside target for Bitcoin because the level aligns with the realized price of BTC held for three to six months (yellow). Bulls lost the level during the October 2025 market rout.What happens after Bitcoin breaks above 3m-6m cost basis?Bitcoin’s rebound above its three-to-six-month holder cost basis (yellow) has historically preceded stronger returns over longer time frames since 2017.After similar breakouts, BTC has averaged a 2.3% gain over the following 30 days, a 21.9% gain after 90 days, and a 36.6% gain after 180 days.BTC’s 3m-6m cohort realized price vs. price. Source: GlassnodeFrom Bitcoin’s current level near $74,000, that would imply upside targets of roughly $75,700 in one month, $90,200 in three months, and $101,100 in six months.Related: Bitcoin doesn’t need a fresh narrative to reclaim $100K: AnalystThe signal has been more reliable over longer time frames. Bitcoin delivered positive returns in only 54.2% of cases after one month, but that hit rate rose to 66.7% after three months and 79.2% after six months.Bitcoin bear flag can still spoil upside sentimentBitcoin’s rebound is also occurring near the lower boundary of a bear flag, keeping the technical outlook cautious.The pattern has developed after Bitcoin’s sharp decline from its 2026 highs at around $98,000, with the price now stabilizing near the flag’s rising support trend line. BTC/USD daily chart. Source: TradingViewA rebound from this area could push BTC toward the flag’s upper boundary near $90,000, a zone that also sits close to the 0.786 Fibonacci retracement level and the three-to-six-month holder cost basis.That makes $90,000 the key upside target in the coming months if bulls can defend the current support area.Conversely, a daily close below the lower trend line would risk confirming a breakdown, opening the door to a deeper decline toward the $50,000–$60,000 range, depending on the exact breakdown point.In that scenario, the recent bounce from holder cost-basis support would look more like a relief move inside a broader downtrend than the start of a sustained recovery.

Čítaj viac

Why is Stellar's XLM up by over 50% this week?

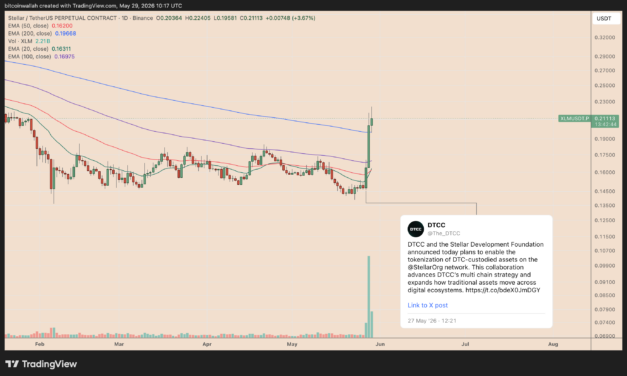
Stellar’s native token, XLM, has rallied more than 50% this week, outperforming the broader crypto market, which has declined by nearly 5% in the same period.Key takeaways:US financial giant DTCC announced it would integrate its tokenized securities platform with the Stellar Network.XLM rallied by over 50% after the announcement, but risks a sharp downside in the coming weeks.DTCC partnership fuels XLM rallyXLM’s price surged after a major institutional partnership announcement by the Depository Trust & Clearing Corporation (DTCC), a US financial giant that clears and settles $10 trillion to $12 trillion in securities transactions daily.In a Wednesday press release, the firm revealed plans to integrate its tokenized securities platform with the Stellar network, targeting a launch in the first half of 2027. XLM/USD daily chart. Source: TradingViewThe move builds on DTCC’s tokenized trades, launched in July 2026, based on its multi-chain strategy for tokenized asset issuance, reporting, corporate actions, and settlement.XLM rallied 51.75% after the DTCC announcement and traded for as high as $0.224 on Friday, its highest level since January. Trading volumes rose sharply alongside the upside move, suggesting that many buyers stepped in.Short squeeze helped fuel XLM price rallyA crowded short trade appears to have also amplified the XLM upside move. Since May 28, Stellar’s short liquidations have reached $12.41 million, compared with $6.82 million in long liquidations, according to CoinGlass.Stellar total liquidations chart vs. XLM price. Source: CoinGlass That means bearish traders suffered nearly 1.8 times more forced closures than bullish traders as XLM surged from around $0.15 to as high as $0.224.XLM open interest nearly doubled during the same period, reaching $292.11 million on Friday. That shows traders added heavy leverage as the rally unfolded, instead of simply closing positions.Stellar open interest vs. XLM price. Source: CoinGlassAt the same time, XLM’s OI-weighted funding rate dropped to around -0.0270%, its deepest level since April, even as the price climbed. Stellar’s OI-weighted funding rate vs. XLM price. Source: CoinGlassNegative funding means short traders paid long traders to keep their positions open, showing that bearish positioning remained crowded during the breakout.When the price rises against heavily leveraged shorts, exchanges force bearish traders to buy back the token to close their trades. That forced buying adds fresh upward pressure, leading to a “short squeeze.”XLM’s PayPal and Trump rallies raise sharp pullback risksStellar’s latest breakout mirrors earlier XLM rallies that ended with steep corrections.In November 2024, XLM surged by roughly 640% after Donald Trump’s re-election as the US president. However, the rally quickly lost momentum, with XLM later dropping by about 68.6% from its local peak.XLM/USD two-week chart. Source: TradingViewA similar pattern played out in July 2025, when PayPal’s stablecoin launch on Stellar and growing excitement around the Protocol 23 upgrade helped XLM rally by around 140%. However, the upside was short-lived, with the XLM/USD pair later correcting by roughly 73.8%. The risk now is that the DTCC-driven rally follows the same pattern.XLM is running hard into long-term resistanceXLM’s latest rally has pushed the token into a major long-term resistance zone, raising the risk of a pullback or consolidation.As of Friday, XLM was trading near the $0.198–$0.224 ceiling area, and a zone that also overlaps with three exponential moving averages (EMA), namely the 50-week EMA (red) near $0.2216, 100-week EMA (purple) near $0.2281 and 200-week EMA (blue) near $0.2083. XLM/USD weekly price chart. Source: TradingViewFailure to break above the resistance confluence, which analyst MAGIC called “too strong for the first test,” risks sending the XLM price toward the $0.112–$0.136 area, down 30%–40% from current levels, by June or July.The downside target area aligns with the lower trendline of XLM’s prevailing descending channel pattern.Related: Altseason is dead, expect shorter cycles and ‘violent’ rotations: Crypto execConversely, a decisive breakout above the resistance area raises the odds of XLM rallying toward the channel’s upper boundary near the $0.28–$0.30 range by June or July. That’s up roughly 40% from the current price levels.

Čítaj viac

Tom Lee’s Ethereum portfolio down $7.35B as ETH price outlook worsens

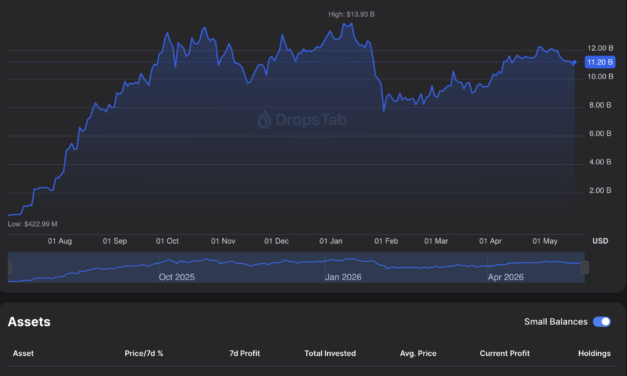
Tom Lee’s BitMine faces about $7.3 billion in paper losses on its Ethereum treasury as Ether (ETH) traders weigh worsening sentiment, ETF outflows and a bearish chart setup pointing toward $1,600.Key takeaways:Bitmine keeps buying ETH even as its losses mount amid the 57% price drawdown from the August 2025 high.ETH price technicals warn of a 25% drop, which would push Bitmine’s losses over $10 billion.Bitmine’s ETH treasury dashboard. Source: DropStab.COM Lee continues buying ETH despite mounting lossesEther has fallen more than 57% from its October 2025 peak near $4,955 on Coinbase, with the sell-off also eroding Ethereum’s market share. ETH’s dominance (ETH.D) has dropped to about 10%, down from roughly 15% in August 2025.ETH.D vs. ETH/USD daily performance chart. Source: TradingViewBitMine began building its Ethereum treasury in July 2025, days after closing a $250 million private placement to fund the strategy. By July 14, the company disclosed holdings of 163,142 ETH, worth about $500 million at the time.As of last week, BitMine held 5.28 million ETH, or about 4.37% of Ethereum’s total supply, making it the world’s largest publicly traded Ether treasury company. That means Tom Lee’s firm kept accumulating ETH through the drawdown, even as its losses widened.Lee has not treated the losses as a reason to retreat. In February, he argued that ETH’s steep drawdown may offer another buying opportunity, citing Ethereum’s history of V-shaped recoveries after 50%-plus declines. Related: Ether pullback was ‘attractive opportunity’ for 71,672 ETH buy: Bitmine’s LeeIn May, BitMine said it would moderate the pace of its ETH purchases, but not abandon the strategy. The company still expects to reach its goal of owning 5% of Ethereum’s total supply by December, signaling that Lee’s strategy remains focused on long-term accumulation despite widening paper losses.Bitmine’s losses may swell to over $10 billion if ETH falls furtherBitMine could see its Ethereum paper losses swell to over $10 billion if ETH’s prevailing bearish setup plays out as intended.As of Sunday, ETH was hovering near the lower trend line of its prevailing rising wedge, a bearish reversal pattern that often signals fading buyer momentum.ETH/USD daily chart. Source: TradingViewA confirmed breakdown below that support could trigger a measured move toward the $1,600 area, down about 25% from current prices, by July or August. The target comes from subtracting the wedge’s maximum height from the breakdown point.Conversely, a decisive rebound from the lower boundary may increase the odds of a 19%–20% rise toward $2,530, aligning with the wedge’s upper boundary and the 200-day exponential moving average (200-day EMA, blue line).The breakdown scenario would raise BitMine’s unrealized losses to nearly $10.1 billion, based on its reported 5.28 million ETH holdings and average purchase price of $3,513.Ethereum traders flip bearishEther’s bearish technical setup overlaps with several other headwinds, such as recent Ethereum Foundation departures, persistent ETH ETF outflows, and weakening social media sentiment.ETH sentiment deteriorated sharply in May, with the bullish-to-bearish comment ratio falling from above 2:1 in late April to nearly 1:1, according to on-chain data platform Santiment. Ethereum social media sentiment. Source: Santiment”Historically, this kind of deterioration tends to happen when traders lose confidence in an asset’s short-term direction,” it said in a Friday report, adding:”Crypto traders tend to become highly emotional during periods of underperformance, and ETH has increasingly become viewed as ‘dead money’ compared to assets that have shown much stronger momentum in 2026.”

Čítaj viac

Získaj BONUS 8 € v Bitcoinoch

nakup bitcoin z karty

Registrácia Binance

Burza Binance

Aktuálne kurzy