Autor Cointelegraph By Yashu Gola

Axie Infinity is painting a giant bearish pattern — will AXS price crash another 95%?

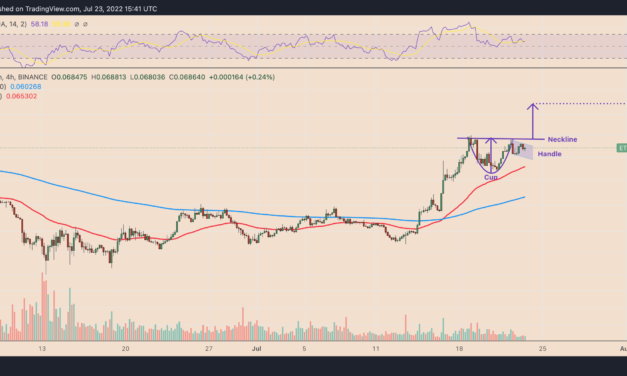
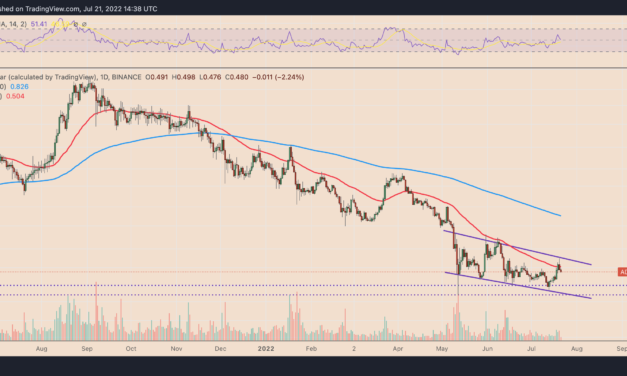
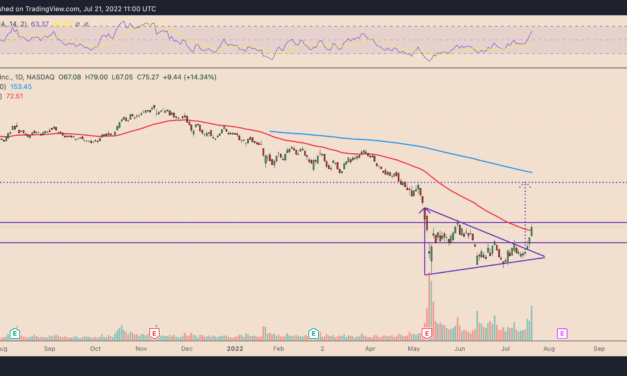
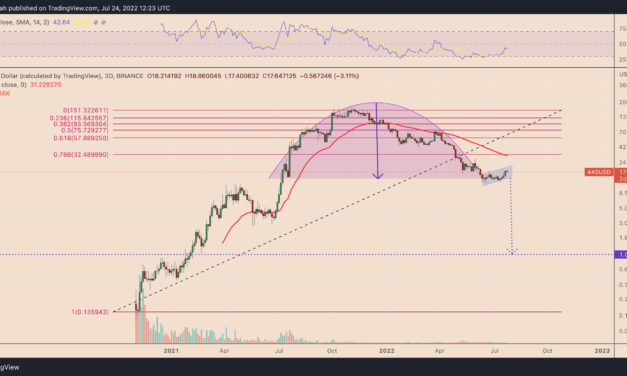
Axie Infinity (AXS) has been forming a giant bearish reversal pattern since July last year, which could send its prices down by another 95% in 2022.AXS risks one big breakdownDubbed the “inverted cup and handle,” the pattern is identified by its large crescent shape followed by a modest upward retracement. It typically resolves after the price breaks out of the rising channel, followed by another break below the cup-and-handle’s neckline support.Meanwhile, as a rule of technical analysis, an inverted cup and handle breakout leads the price to the level at length equal to the maximum distance between the structure’s top and support.AXS’s price rally during the second half of 2021, followed by its complete wipeout in 2022, makes a crescent shape trend, which looks like an inverted cup. Furthermore, the recent 50% price rebound from the June 18’s local bottom of $11.82 forms an inverted handle, as shown below.AXS/USD three-day price chart featuring inverted cup and handle pattern. Source: TradingViewThus, AXS’s technicals appear skewed to the downside, given it breaks below the inverted handle range with a breakdown target of $1, down about 95% from today’s price.Bad press hurt Axie InfinityThe extreme bearish outlook primarily appears in the wake of a depressive trend elsewhere in the crypto market. Nonetheless, AXS also suffers due to Axie Infinity’s crumbling vision of sustaining a gaming platform that pays its user to play.Additionally, bad press including a $600 million hack earlier this year has also dampened the demand for AXS, which serves as a governance token and legal tender within the Axie Infinity ecosystem. Related: Inflation got you down? 5 ways to accumulate crypto with little to no costThat is visible in Axie’s monthly revenue performance, which has dropped over 98% from its August 2021 peak of $364.4 million, according to data tracked by Token Terminal.Axie Infinity monthly revenue. Source: Token TerminalBut Axie Infinity might not disappear altogether, argues Cointelegraph’s Yanto Chandra in his opinion editorial, noting that the project would “reinvent itself and chart a new destiny in the fast-changing GameFi landscape.”The views and opinions expressed here are solely those of the author and do not necessarily reflect the views of Cointelegraph.com. Every investment and trading move involves risk, you should conduct your own research when making a decision.

Čítaj viac

Ethereum price 'cup and handle' pattern hints at potential breakout versus Bitcoin

Ethereum’s native token Ether (ETH) has rebounded 40% against Bitcoin (BTC) after bottoming out locally at 0.049 on June 13. Now, the ETH/BTC pair is at two-month highs and can extend its rally in the coming weeks, according to a classic technical pattern.ETH paints cup and handle patternSpecifically, ETH/BTC has been forming a “cup and handle” on its lower-timeframe charts since July 18. A cup and handle setup typically appears when the price falls and then rebounds in what appears to be a U-shaped recovery, which looks like a “cup.” Meanwhile, the recovery leads to a pullback move, wherein the price trends lower inside a descending channel called the “handle.”The pattern resolves after the price rallies to an approximately equal size to the prior decline. The ETH/BTC chart below illustrates a similar bullish technical setup.ETH/BTC four-hour price chart. Source: TradingViewNotably, the pair now trades lower inside the handle range but could pursue a recovery toward the neckline resistance near 0.071 BTC. Afterward, a decisive cup and handle breakout above the neckline level could lead ETH/BTC to 0.072, up 12.75% from today’s price.The success rate of the cup and handle pattern in reaching its profit target is 61%, according to veteran investor Tom Bulkowski. The Merge factorThe bullish setup for ETH/BTC also takes cues from Ethereum’s network transition from proof-of-work (PoW) to proof-of-stake (PoS) potentially via “the Merge” slated for mid September.Related: Will Ethereum Merge hopium continue, or is it a bull trap?Meanwhile, market analyst Michaël van de Poppe says that Ether could see more upside versus Bitcoin due to the Merge hype as momentum builds in the coming weeks. Basically a few levels on $ETH.Facing resistance at 0.0725 $BTC.Facing support at either 0.0645 $BTC or 0.057 $BTC.Overall, expecting more momentum going towards the merge in September. pic.twitter.com/QpmkyTwjyb— Michaël van de Poppe (@CryptoMichNL) July 23, 2022Van de Poppe anticipates ETH/BTC to test 0.072, the cup-and-handle profit target, as interim resistance while holding either 0.0645 or 0.057 level as support.ETH/BTC weekly price chart. Source: TradingView/Michaël van de PoppeConversely, the range of risks for Ethereum with the Merge update include potential technical issues, delays or even a contentious hard fork. For instance, a bug had split the Ethereum chain during a 2020 network upgrade.The views and opinions expressed here are solely those of the author and do not necessarily reflect the views of Cointelegraph.com. Every investment and trading move involves risk, you should conduct your own research when making a decision.

Čítaj viac

Ethereum Classic soars 100% in nine days outperforming ETH as 'the Merge' approaches

Ethereum Classic (ETC) has been outperforming its arch-rival Ethereum’s native token Ether (ETH) during the current crypto market rebound with the ETC/ETH pairs at 10-month highs.Why is ETC beating ETH?ETC’s price has risen to $27 on July 22, amounting to a 100% gain in nine days after bottoming out at $13.35. Comparatively, ETH’s price has seen a 64% rally in U.S. dollar terms.ETC/USD versus ETH/USD daily price chart. Source: TradingViewEthereum’s rebound has been among the sharpest among the top cryptocurrencies, primarily due to the euphoria surrounding its potential network upgrade in September.Dubbed “the Merge,” the long-awaited technical update will switch Ethereum from proof-of-work (PoW) to proof-of-stake (PoS).Anyone who believes the #Ethereum #Merge is priced in is smoking crack. Nothing is priced-in in crypto, especially an event as convoluted and unprecedented as this.But If I were a betting man, I’d say $ETH goes up prior to Merge, drops on Merge (unlocked coins), then goes — Jeremy Gardner (@Disruptepreneur) July 21, 2022Moreover, it will replace miners with stakers. As a result, the PoS switch could force existing Ethereum miners to switch to PoW chains.Unsurprisingly, Ethereum Classic is the closest to Ethereum in terms of network design and compatibility because Ethereum Classic is the legacy chain split from Ethereum following a contentious hard fork in July 2016. Speculators are thus anticipating Ethereum Classic to become the first choice for miners migrating from Ethereum, and this is likely one of the main reasons ETC’s recent price surge. #ETC is not just pumping. It has a FIXED monetary policy! It is programmable! Yes all Dapps on #ETH can run on $ETC. After the #ETH 2.0 merge, miners like myself will call #EthereumClassic home. Retweet for CodeIsLaw! pic.twitter.com/sABGc72NUk— Patient Money (@MoonTigerSt) July 19, 2022

ETC price technicals lean short-term bearishFrom a technical standpoint, Ethereum Classic has been reeling under the pressure of its 200-day exponential moving average (200-day EMA; the blue wave in the chart below) near $27.35.ETC/USD daily price chart. Source: TradingViewETC/USD has witnessed a strong bearish rejection near the wave resistance on July 19, confirmed by the largest spike in its daily trading volume in almost a year. In addition, the rejection came after testing the 0.382 Fib line at around $27.47 as resistance.Related: All ‘Ethereum killers’ will fail: Blockdaemon’s Freddy ZwanzgerETC now consolidates inside the $22–$25 price range with its interim bias skewed toward the downside due to an “overbought” relative strength index (RSI). ETC eyes a decline toward its 50-day EMA (the red wave) near $19 if it decisively breaks below $22—over 25% lower than July 22’s price.Conversely, a successful break above $25 and the 200-day EMA could have ETC’s price rally over $30.The views and opinions expressed here are solely those of the author and do not necessarily reflect the views of Cointelegraph.com. Every investment and trading move involves risk, you should conduct your own research when making a decision.

Čítaj viac

Sell the news? Cardano price risks 20% drop despite Vasil hard fork euphoria

Cardano (ADA) has dipped this July 21 as the market favors mounting selling pressure around its most reliable resistance levels in 2022 over a major upcoming hard fork.ADA price could plunge 20% by early AugustADA’s price fell 5% intraday to $0.476. The downside move came as a part of a broader retreat that started a day after it briefly climbed above its 50-day exponential moving average (50-day EMA; the red wave in the chart below) near $0.50.The 50-day EMA has been serving as ADA’s curvy resistance level since October 2021. ADA/USD daily price chart. Source: TradingViewAdditionally, the upper trendline resistance of a broader descending channel pattern strengthened the selling sentiment around the ADA’s 50-day EMA wave. Earlier in June, the same resistance confluence had triggered a 35% price drop toward the channel’s lower trendline.Therefore, ADA’s renewed correction move risks leading the price toward $0.384 by July or early August, down about 20% from July 21’s price.2018 fractal suggests $0.20 per ADAHowever, a separate analysis sees ADA falling to deeper levels than $0.384. Penned by TradingShot, the bearish ADA forecast draws comparisons between the ongoing correction and the one witnessed during the 2018 market crash, as shown below.ADA/USD daily price chart 2022 versus 2018. Source: TradingViewIn detail, the 2018 chart above shows ADA undergoing multiple bearish rejections near its 50-day EMA (the orange wave) while trending downward in a descending channel pattern. The token’s downtrend became exhausted after correcting by nearly 93% from its local high.”Based on 1D RSI terms, we also seem to be on the third (3) and final leg below the collapse,” TradingShot wrote, adding: “So if ADA holders want to avoid this, they need to see the price break above the 1D MA50 and sustain trading above it for a week at least. Otherwise, completing a -93% drop from the top is possible at around 0.200.”When hard fork?The latest ADA price correction appears in the days leading up to Cardano’s hard fork.Dubbed “Vasil,” the hard fork was supposed to go live in June but was delayed until the last week of July over several outstanding bugs. Nonetheless, as of July 21, Input Output Hong Kong (IOHK), the firm behind the Cardano blockchain development, has not announced the exact launch date.Vasil is expected to bring significant performance and capability upgrades to the Cardano blockchain, including faster block creation and higher transaction speeds. From a fundamental perspective, the upgrade could boost ADA adoption due to improved network efficiency.But Cardano has a history of logging sharp price corrections after most network upgrades, suggesting a prevailing “sell the news” sentiment in the market. ADA/USD three-day price chart. Source: TradingViewFor instance, the blockchain’s Alonzo upgrade in September 2021 partly prompted ADA to rise by over 200% to its record high of $3.16 before launch. But after the upgrade, the Cardano token fell by more than 85%. ADA has risen by only 25% after bottoming out locally at $0.384 on May 10, suggesting that Vasil’s impact on the market has been limited. But not everyone is convinced. For example, analyst Lark Davis believes the token will “rip” after the hard fork, given it manages to hold 50-day EMA as support. #cardano $ada has broken past its 50 day EMA, now we just need Charles to announce the date of the Vasil hard fork and this puppy will rip! pic.twitter.com/yQTiCiCE6H— Lark Davis (@TheCryptoLark) July 20, 2022Until then, ADA will likely stay under the “sell the news” pressure, pressured further by ongoing macro risks and their negative impact on crypto markets.The views and opinions expressed here are solely those of the author and do not necessarily reflect the views of Cointelegraph.com. Every investment and trading move involves risk, you should conduct your own research when making a decision.

Čítaj viac

Coinbase stock has potential to double in 2022 after plunging 90% from record high

Coinbase stock (COIN) price has nearly doubled since its June lows with a potential for much more upside this year, according to a mix of technical and fundamental indicators.COIN’s symmetrical triangle reversalCOIN has been undergoing a strong bullish reversal after falling by almost 90% from its record high of $368.90 in November 2021.Coinbase stock price was up over 95% to $75.27 as of July 20’s close when measured from its May 12 local bottom of $40.83. Its recovery led to a symmetrical triangle pattern formation with the price forming a sequence of lower highs and higher lows.Symmetrical triangles in downtrend typically turn out to be bearish continuation patterns. They resolve after the price breaks below their lower trendlines to fall further. But in rare instances, a symmetrical triangle could form at the end of a downtrend, leading to sharp bullish reversals.As it seems, COIN has already entered the breakout stage of its symmetrical triangle reversal pattern. Notably, Coinbase stock closed above the structure’s upper trendline on July 28 while accompanying a rise in trading volume, as shown below.COIN daily price chart featuring symmetrical triangle reversal setup. Source: TradingViewCOIN now tests $80 as its interim resistance while eyeing a further upside toward $135. The profit target is measured after calculating the maximum distance between the symmetrical triangle’s upper and lower trendline and adding the outcome to the breakout point.  The triangle’s upside target appears closer to COIN’s 200-day exponential moving average (200-day EMA; the blue wave in the chart above) near $153. That psychologically raises the possibility of COIN forming bullish wicks toward $153 if it reaches $135 this year.  That would mean a 102% rally from today’s price.Coinbase valuation: Q1 earningsCoinbase Q1 earnings were underwhelming due to weaker-than-expected revenue and a substantial drop in monthly transacting users.The firm has not disclosed any cost management plans in the said earnings call, but a report published by the Financial Times this June shows that it would cut nearly a fifth of its workforce. Also, Coinbase ended its popular affiliation program in July, according to Business Insider.”Our target price of [COIN] is around $52 [in 2022],” noted Rumak Research, a group of financial analysts, in their recent Coinbase assessment. The given analysis was based on reactions to past market cycles, coupled with their capital asset pricing model (CAPM), as shown below.Coinbase valuation based on CAPM model. Source: Rumak Research/Seeking AlphaThe stock’s target price comes to be near $160, according to Rumak Research, when considering the current average market risk premium in the United States of 5.6%.Related: Coinbase to shut down Coinbase Pro to merge trading servicesOn similar lines, D.A. Davidson analyst Christopher Brendler noted that Coinbase would survive the crypto bear market despite its “financial situation,” including $3.4 billion in long-term debt. Nevertheless, the company is still sitting on $6.1 billion.”The fact that they have to scale back a little bit, it may not be the best news, but ultimately, I know that they’re not going to be in a situation where they’re struggling to survive,” Brendler told Forbes, adding: “They have been through it before and I’m confident they’ll be able to get through it again.”The views and opinions expressed here are solely those of the author and do not necessarily reflect the views of Cointelegraph.com. Every investment and trading move involves risk, you should conduct your own research when making a decision.

Čítaj viac

Získaj BONUS 8 € v Bitcoinoch

nakup bitcoin z karty

Registrácia Binance

Burza Binance

Aktuálne kurzy