Autor Cointelegraph By Yashu Gola

Ethereum Classic gets 'endorsement' from Vitalik Buterin, but ETC price still risks 50% crash

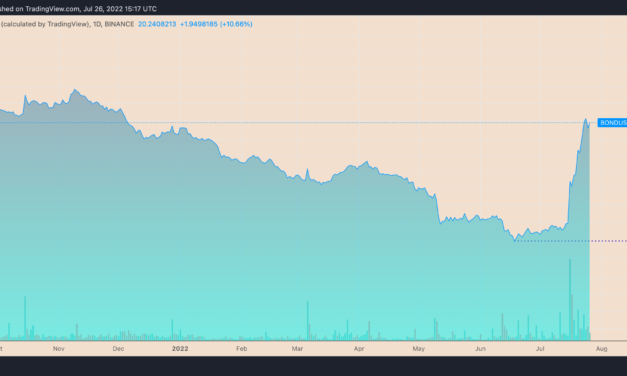
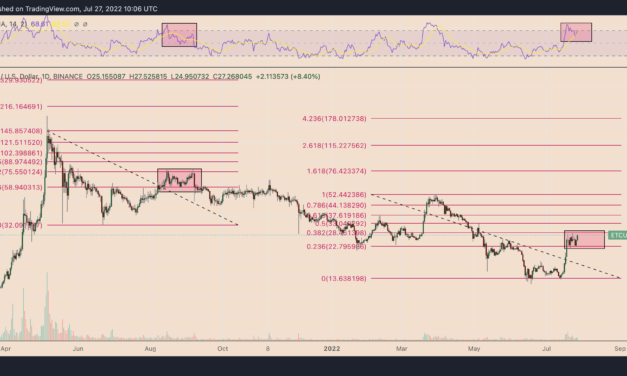
Ethereum Classic (ETC) continues to reap benefits from its blockchain rival Ethereum’s upcoming transition from proof-of-work (PoW) to proof-of-stake (PoS). Vitalik Buterin likes Ethereum ClassicNotably, ETC’s price jumped by a little over 20% to reach $27.50, two days after Ethereum co-founder Vitalik Buterin’s endorsement of Ethereum Classic went viral across social media. In his comments, Buterin presented the chain as a “fine” PoW alternative to Ethereum.[embedded content]The statements appeared amid fears that Ethereum’s potential network upgrade this September will force PoW miners elsewhere. In other words, they would be looking for alternative PoW networks to ensure that their rigs remain functional. That could benefit Ethereum Classic since it’s the original version of Ethereum and could therefore ensure an easy migration for miners.ETC technical outlookImpressively, ETC price has rebounded by over 120% since mid June, making it the standout performer over the past month. Nonetheless, it is still down over 85% versus its May 2021 record high of $185, suggesting that its ongoing retracement move could technically be a bull trap.A convincing piece of evidence comes from ETC’s 150% price rebound between June 2021 and September 2021, which became a false recovery signal. Interestingly, ETC’s ongoing price action appears similar to the one in 2021, as illustrated in the daily chart below.ETC/USD daily price chart. Source: TradingViewLike in 2021, ETC this year has been consolidating inside the range defined by its 0.236 Fib line (~$28.50) as support and 0.382 Fib line (~$22.80) as resistance. Similarly, the token’s daily relative strength has been correcting from its “overbought” area during the price consolidation.Related: This little-known DeFi crypto token has rallied over 800% in a monthTherefore, ETC could continue trending sideways in the $22.80-$28.50 price range, followed by a breakdown toward the 0 Fib line near $13.65. In other words, a 50% price drop from today’s price.The views and opinions expressed here are solely those of the author and do not necessarily reflect the views of Cointelegraph.com. Every investment and trading move involves risk, you should conduct your own research when making a decision.

Čítaj viac

This little-known DeFi crypto token has rallied over 800% in a month

A new and relatively unknown DeFi token called BarnBridge (BOND) has rallied over 800% to reach $20 on July 26.The BOND price surge comes more than a month after bottoming out at around $2.19. In comparison, top coins, Bitcoin (BTC) and Ether (ETH) have only rebounded by 18% and 54% in the same period, respectively.BOND/USD daily price chart. Source: TradingViewAnother pump and dump?BarnBridge is a cross-chain risk management protocol that offers a suite of composable DeFi products for investors to hedge against interest rate fluctuations and price volatility.Examples include SMART Yield — a product that enables investors to secure fixed rate yields from the debt pools of other projects such as Aave, Compound, Cream, or Yearn.finance — and SMART Exposure, which offers investors tools to rebalance portfolios. BarnBridge SMART products explained. Source: Official WebsiteBarnBridge’s latest product, SMART Alpha, allows investors to hedge against price fluctuations and provides them leverage for bullish theses. Meanwhile, BOND serves as a governance token to the Ethereum-based DAO representing BarnBridge.On the surface, the latest BOND price pump should reflect a booming interest in risk-trenching protocols, primarily when many projects in the DeFi sector have failed. But the token’s gains appear largely speculative if one focuses on its trading volume concentration.Notably, more than 50% of BOND volumes have originated at Binance in the past 24 hours, according to data tracked by CoinMarketCap. At the same time, the daily trading activity of the benchmark BOND/USD pair has been declining during the price pump, as shown below.BOND/USD daily price chart featuring price-volume divergence. Source: TradingViewThe price-volume divergence suggests that fewer investors have been behind the BOND price pump, increasing the chances of a sharp correction in the coming days or weeks.Next BOND price targetsDrawing a Fibonacci retracement graph from BOND’s swing high of $37.50 to its swing low of $2.18 churns out a sequence of potential support and resistance levels, as shown in the weekly chart below.BOND/USD weekly price chart. Source: TradingViewBOND has been retreating after testing $24 as its interim resistance, and now anticipates to undergo an extended correction toward $15.60, down 17.5% from July 26’s price. A further breakdown risks crashing the price to $10.50, or a 45% decline.Related: Institutional ETH sentiment turns positive after 11 weeks of outflowsConversely, a rebound above $24 could have BOND test $30 as its next upside target. Another breakout move could shift the target to $37.50, up 95% from current price levels.The views and opinions expressed here are solely those of the author and do not necessarily reflect the views of Cointelegraph.com. Every investment and trading move involves risk, you should conduct your own research when making a decision.

Čítaj viac

Solana eyes 40% jump in August despite long-term bearish signals

Solana (SOL) dipped to a two-week low at around $35.50 on July 26, mirroring downside moves elsewhere in the crypto market. Nonetheless, technicals suggests that Solana’s price flirts with the prospects of rising 40% in August.SOL hits key inflection pointIronically, the bullish setup for Solana emerges out of a classic bearish continuation pattern.On the daily chart, SOL’s price has been consolidating inside what appears to be a “bear flag,” a technical pattern that develops during a downtrend and gets resolved after the instrument exits it with further price drops.The so-called bear flag breakdown has not happened yet. Instead, SOL has been holding the lower trendline as support, raising possibilities of a sharp rebound toward the upper trendline, as illustrated in the chart below.SOL/USD daily price chart featuring ‘bear flag.’ Source: TradingViewThe rebound setup exposes SOL to a potential rally toward $49.50 in August, up 40% from today’s price. The $49-$50 level had served as both support and resistance in May.Solana network performance still a concern — researcherThe potential bear flag rebound will serve as interim relief to Solana bulls, given SOL’s overall bias remains skewed to the downside.Macro forces such as the Fed’s hawkish monetary policies and the collapse of the $40 billion “algorithmic stablecoin” project Terra have sent the crypto market into a tailspin. As a result, Solana, like any other risky asset, has suffered declines across its financial and network usage metrics in 2022.For instance, the average number of daily transactions atop the Solana blockchain plunged by 17.6% in Q2/2022 versus the previous quarter, according to data from Messari. Meanwhile, Solana’s revenue dropped 44.4% quarter-on-quarter (also because of recurring network outages).Solana Financial Overview Q2/2022. Source: Messari”As seen in 2021 and throughout Q1 and Q2, degraded network performance decreases network usage and reduces the network’s continued flow of revenue,” noted James Trautman, a researcher at Messari, adding: “If Solana were to continue to experience degraded performance that lasts for a material amount of time, a resulting drag on fundamental usage may catalyze volatility and drag on network value.”Bear flag breakdown?The mix of macro and network-related concerns risk triggering the bear flag breakdown by September.Related: All ‘Ethereum killers’ will fail: Blockdaemon’s Freddy ZwanzgerSOL’s decisive close below the flag’s lower trendline means more downside is likely to the $21-$23 region, according to the technical setup illustrated below.SOL/USD daily price chart featuring bear flag breakdown setup. Source: TradingViewIn other words, a 35%-38% drop from current price levels.The views and opinions expressed here are solely those of the author and do not necessarily reflect the views of Cointelegraph.com. Every investment and trading move involves risk, you should conduct your own research when making a decision.

Čítaj viac

3 signs Bitcoin price is forming a potential 'macro bottom'

Bitcoin (BTC) could be in the process of bottoming after gaining 25%, based on several market signals. BTC’s price has rallied roughly 25% after dropping to around $17,500 on June 18. The upside retrace came after a 75% correction when measured from its November 2021 high of $69,000.BTC/USD daily price chart. Source: TradingViewThe recovery seems modest, however, and carries bearish continuation risks due to prevailing macroeconomic headwinds (rate hike, inflation, etc.) and the collapse of many high-profile crypto firms such as Three Arrows Capital, Terra and others.But some widely-tracked indicators paint a different scenario, suggesting that Bitcoin’s downside prospects from current price levels are minimal. That big “oversold” bounceThe first sign of Bitcoin’s macro bottom comes from its weekly relative strength index (RSI).Notably, BTC’s weekly RSI became “oversold” after dropping below 30 in the week of June 13. That is the first time the RSI has slipped into the oversold region since December 2018. Interestingly, Bitcoin had ended its bear market rally in the same month and rallied over 340% in the next six months to $14,000.In another instance, Bitcoin’s weekly RSI dropped toward 30 (if not below) in the week beginning March 9. That also coincided with BTC’s price bottoming below $4,000 and thereafter rallying to $69,000 by November 2021, as shown below.BTC/USD weekly price chart featuring RSI-market bottom relationship. Source: TradingViewBitcoin price has rebounded similarly since June 18, opening the door to potentially repeat its history of parabolic rallies after an “oversold” RSI signal.Bitcoin NUPL jumps above zeroAnother sign of a potential Bitcoin macro bottom comes from its net unrealized profit and loss (NUPL) indicator.NUPL is the difference between market cap and realized cap divided by market cap. It is represented as a ratio, wherein a reading above zero means investors are in profit. The higher the number, the more investors are in profit.Related: Bitcoin must close above $21.9K to avoid fresh BTC price crash — traderOn July 21, Bitcoin NUPL climbed above zero when the price wobbled around $22,000. Historically, such a flip has followed up with major BTC price rallies. The chart below illustrates the same.BTC/USD versus NUPL performance since 2009. Source: CryptoQuantMining profitabilityThe third sign of Bitcoin forming a macro bottom comes from another on-chain indicator called the Puell Multiple.The Puell Multiple examines mining profitability and its impact of market prices. The indicator does it by measuring a ratio of daily coin issuance (in USD) and the 365 moving average of daily coin issuance (in USD).Bitcoin Puell Multiple. Source: GlassnodeA strong Puell Multiple reading shows that mining profitability is high compared to the yearly average, suggesting miners would liquidate their Bitcoin treasury to maximize revenue. As a result, a higher Puell Multiple is known for coinciding with macro tops.Conversely, a lower Puell Multiple reading means the miners’ current profitability is below the yearly average. Thus, rigs with break-even or below-zero revenue from mining Bitcoin will risk shutting down, giving up market share to more competitive miners. The ousting of weaker miners from the Bitcoin network has historically reduced selling pressure.Interestingly, the Puelle Multiple reading as of July 25 is in the green box and similar to levels observed during the March 2020 crash, 2018 and 2015 price bottoms.The views and opinions expressed here are solely those of the author and do not necessarily reflect the views of Cointelegraph.com. Every investment and trading move involves risk, you should conduct your own research when making a decision.

Čítaj viac

Ethereum's bearish U-turn? ETH price momentum fades after $1.6K rejection

Ethereum’s native token Ether (ETH) tumbled on July 26, reducing hopes of an extended price recovery. The ETH/USD pair dropped by roughly 5%, followed by a modest rebound to over $1,550.Ethereum gets rejected at $1,650 These overnight moves liquidated over $80 million worth of Ether positions in the last 24 hours, data from CoinGlass reveals.ETH/USD hourly price chart. Source: TradingViewThe seesaw action also revealed an underlying bias conflict among traders who have been stuck between two extremely opposite market fundamentals.The first is the euphoria surrounding Ethereum’s potential transition to proof-of-stake in September, which has helped Ether’s price to recover 45% month-to-date.However, this bullish hype is at odds with macroeconomic headwinds, namely the Federal Reserve’s and European Central Bank’s hawkish stance, which put pressure on risk assets and saw Ether price shed 68% to date from its record high of $4,950.But the short term could provide some upside for ETH price. For instance, analyst PostyXBT anticipates Ether to undergo an interim upside retracement based on the token’s recent swings inside an ascending channel pattern, as shown below.ETH/USD four-hour price chart featuring ascending channel setup. Source: TradingViewIn other words, ETH’s price could hit $1,700 ahead of July’s close if the pattern plays out.Bearish divergenceNonetheless, watching the same recovery trend in conjugation with Ether’s four-hour relative strength index (RSI), a momentum oscillator indicator, shows extreme disparities.Interestingly, Ether’s price has been forming higher highs since July 18, while its RSI has been making lower highs simultaneously. That shows a bearish divergence between ETH’s price and momentum, meaning bulls have been losing their grip on the market, and a downtrend may follow.ETH/USD four-hour price chart featuring bearish divergence. Source: TradingViewEther also risks breaking below its ascending channel’s lower trendline, which coincides with two more price supports: the 50-4H exponential moving average (50-4H EMA; the red wave) at around $1,500 and the 0.5 Fib line near $1,475.  Related: Will Ethereum Merge hopium continue, or is it a bull trap?Losing these key supports would likely push below $1,350 (the $0.382 Fib line and the blue 200-4H EMA wave) in August, down 10%-15% from today’s price, should this bearish scenario play out. The views and opinions expressed here are solely those of the author and do not necessarily reflect the views of Cointelegraph.com. Every investment and trading move involves risk, you should conduct your own research when making a decision.

Čítaj viac

Získaj BONUS 8 € v Bitcoinoch

nakup bitcoin z karty

Registrácia Binance

Burza Binance

Aktuálne kurzy