Autor Cointelegraph By Yashu Gola

Ethereum's L2 solution 'Optimism' rallies 300% in a month — will OP price gains sustain?

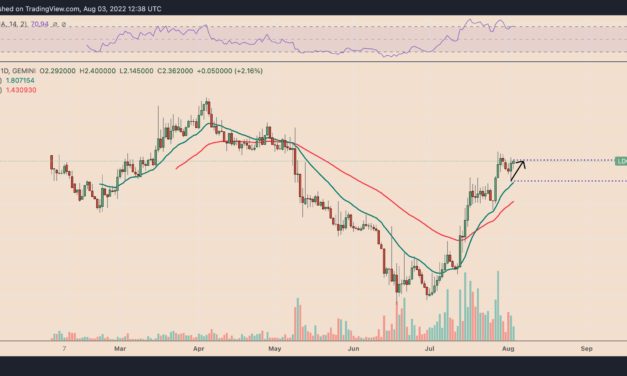
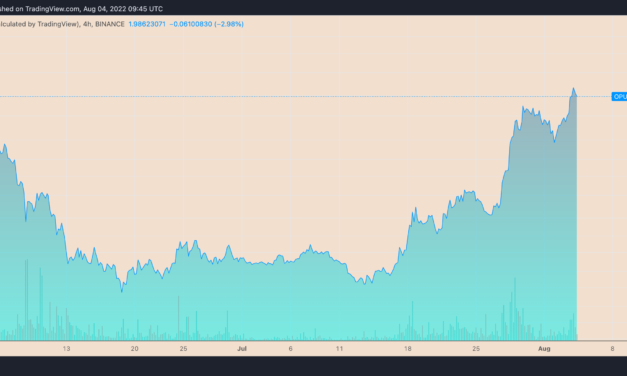
The price of Optimism (OP) has been skyrocketing since the beginning of July due to its proximity to Ethereum.Notably, OP’s price rallied by nearly 300% in over a month to reach $2.31, its second-highest level on record, on Aug. 4. The token received its bullish cues primarily from the euphoria surrounding Ethereum’s potential transition to proof-of-stake in September via an upgrade called “the Merge.”OP/USD four-hour price chart. Source: TradingViewWhy the “Optimism”To recap: Optimism is an Ethereum rollup solution. In other words, the so-called layer-2 solution handles a bundle of Ethereum’s transaction verifications off-chain to boost scalability on the main chain. Optimism could benefit from the Merge due to Ethereum’s “Rollup-Centric Roadmap,” which turns its main chain into a settlement and data availability layer and places scalability in the hands of layer-2 rollups via “danksharding.””Currently, with the combined rollup and Ethereum architecture, the current Ethereum-only transaction throughput of 15–45 TPS could scale to as much as 1,000–4,000 TPS,” noted Ally Zach, a researcher at Messari, adding: “The introduction of shards has expanded the data storage capacity for rollups to increase this throughput to [the] north of 100,000 TPS.”That explains why OP and other layer-2 tokens have responded positively to the Merge announcement on July 15. Ethereum layer-2 tokens and their performances on different timeframes. Source: MessariOP price could drop 30% in AugustDespite strong fundamentals, OP’s technical metrics suggest its rally could exhaust in the coming weeks.On the four-hour chart, OP’s rising price coincides with its falling relative strength index (RSI), indicating “bearish divergence.” Meanwhile, the attempted breakout above the $2-level has faced strong rejection twice since July 29, including its 15% drawdown after peaking out locally at $2.31 on Aug. 4.OP/USD 4-hour price chart. Source: TradingViewTherefore, an extended correction could have OP test its 50-4H exponential moving average (50-4H EMA; the red wave) near $1.54 as its interim downside target. This curvy level has limited OP’s downside attempt on Aug. 2.Related: Ethereum average gas fee falls down to $1.57, the lowest since 2020Moreover, a break below the 50-4H EMA could push OP to $1.36, down 30% from today’s price. Interestingly, the $1.36-level also served as support in August and coincides with a multi-month ascending trendline support.The views and opinions expressed here are solely those of the author and do not necessarily reflect the views of Cointelegraph.com. Every investment and trading move involves risk, you should conduct your own research when making a decision.

Čítaj viac

MicroStrategy stock MSTR hits 3-month high after CEO's exit

MicroStrategy (MSTR) stock opened higher on Aug. 3 as investors digested the news of its CEO Michael Saylor’s exit after a depressive quarterly earnings report.Microstrategy stock up 142% since May lows On the daily chart, MSTR’s price surged by nearly 14.5% to $324.55 per share, the highest level since May 6. The stock’s intraday gains came as a part of a broader recovery that started on May 12 at $134. Since then, MSTR has grown by 142% versus Nasdaq’s 26.81% gains in the same period.MSTR daily price chart. Source: TradingViewBad Q2, Saylor’s resignationThe Aug. 3 MSTR rally came a day after MicroStrategy reported a billion dollar loss in its second quarter (Q2) earnings call. Interestingly, the company’s major Bitcoin exposure was a large reason for its poor quarterly performance.To recap: MicroStrategy is an information technology firm that provides business intelligence, mobile software, and cloud-based services. But one of its primarily corporate strategy is to invest in Bitcoin to hold it long-term.Unfortunately, holding Bitcoin has cost MicroStrategy an impairment loss of $917.84 million from its 129,698 BTC holdings in Q2, primarily due to the crypto’s 50% year-to-date (YTD) price drop. In comparison, MSTR plunged 42% in the same period.BTC/USD daily price chart. Source: TradingViewFurthermore, MicroStrategy’s revenue fell 2.6% year-over-year to $122.07 million. The net quarterly losses prompted Saylor—who has strongly backed the Bitcoin investment strategy since August 2020—to quit as the firm’s CEO and become an executive chairman.MSTR responded positively to Saylor’s resignation and the appointment of Phong Le, President of MicroStrategy, as his replacement, suggesting that investors are comfortable with the change in leadership.What’s next for MSTR?MSTR’s course for the remainder of 2022 depends largely on Bitcoin’s performance, given their consistently positive correlation in recent years. But several metrics are hinting at a correction ahead. The weekly correlation coefficient between MSTR and BTC/USD. Source: TradingViewFor instance, MicroStrategy’s enterprise value-to-revenue (EV/R) ratio was at 10.76 on Aug. 3, or in “overvalued” territory.Similarly, MSTR’s forward price-to-earnings (P/E) ratio has reached 54.95, more than double the market average of 20-25. In other words, the market expects MicroStrategy to show enormous future earnings growth despite its underperformance in recent quarters.MicroStrategy also has amassed $2.4 billion in long-term debts with $46.6 million in interest expense. Therefore, the company could find it unable to meet its debt obligations if it continues to suffer losses at the current pace.MSTR long-term debt table. Source: S&P Capital IQIn other words, MicroStrategy could pledge its nearly $2 billion worth of Bitcoin holdings as collateral or sell them to raise capital. Related: A brief history of Bitcoin crashes and bear markets: 2009–2022″Nonetheless, crypto and MSTR bulls may remain invested,” noted Juxtaposed Ideas, a Seeking Alpha contributor, in its latest analysis, saying that most are willing to “gamble on Bitcoin’s eventual recovery to $40,000” or beyond by 2023 or 2024.”That would be a positive catalyst for its future stock recovery, returning some much-needed capital to the highly volatile investment.”The views and opinions expressed here are solely those of the author and do not necessarily reflect the views of Cointelegraph.com. Every investment and trading move involves risk, you should conduct your own research when making a decision.

Čítaj viac

Lido DAO: Ethereum's biggest Merge staker just jumped 30% — will LDO rally into September?

Lido DAO (LDO) price edged higher on Aug. 3, primarily due to similar upside moves elsewhere in the crypto market and a rising euphoria around Ethereum’s network upgrade in September.On the daily chart, LDO’s price reached an intraday high of $2.40 a day after bottoming out locally at $1.84. The sharp upside reversal amounted to nearly 30% gains in a day, suggesting traders’ strengthening bullish bias for Lido DAO.LDO/USD daily price chart. Source: TradingViewLido DAO is a liquid staking solution for Ethereum by total value deposited. In other words, it allows users to participate in the running of Ethereum’s upcoming proof-of-stake (PoS) chain in exchange for daily rewards. Ethereum’s Ether token (ETH) has rallied by more than 90% since mid-June in part due to buzz around its blockchain’s PoS upgrade called the Merge, expected in September. Lido DAO, the biggest Merge staking serve provider, has benefited from the craze simultaneously, with LDO, its governance token, rallying nearly 500% in the same period.Notably, the total number of Ether staked into the Merge smart contract—also called ETH 2.0—via Lido has surged from 3.38 million on June 13 to 4.16 million on Aug. 3, according to DeFi Llama.Total ETH deposited into Ethereum Merge contract via Lido DAO. Source: DeFi LlamaCharts hint at LDO price rally aheadFurthermore, LDO’s technicals appear skewed to the upside due to its “bull flag.” This technical pattern typically appears during an uptrend, when the price consolidates lower inside a descending channel after a strong upside move.LDO has been forming a similar pattern. On the daily chart, the token’s price has been reversing course after undergoing a strong uptrend that topped at around $2.66 on July 28. LDO/USD daily price chart featuring ‘bull flag’ setup. Source: TradingViewAs a result, the Lido DAO token now eyes a break above its current descending channel range, similar to the upside move that followed its bull pennant formation in July.As a rule, the bull flag’s profit target comes to be at length equal to the size of the previous uptrend, called “flagpole,” or $4 by September, up 65% from today’s price.Bull flag failure scenarioOn the flip side, a bull flag’s potential to reach its upside target stands at around 67%, according to research conducted by Samurai Trading Academy. Therefore, LDO’s bull flag could fail if its price breaks below the pattern’s lower trendline.Related: ETH may consolidate as Merge excitement wears off, says expertThe trendline coincides with a support confluence made up of $1.91‚ which capped LDO’s upside moves in late July, and the 20-day exponential moving average (20-day EMA; the green wave in the chart below) at around $1.80.LDO/USD daily price chart. Source: TradingViewThus, a bear flag breakdown, or a break below the support confluence, could have LDO eye the 50-day EMA (the red wave) near $1.43 as its downside target. This level coincides with the 0.236 Fib line around $1.42, which served as a price floor in February and May.The views and opinions expressed here are solely those of the author and do not necessarily reflect the views of Cointelegraph.com. Every investment and trading move involves risk, you should conduct your own research when making a decision.

Čítaj viac

Polkadot 'cup and handle' setup sees DOT price 50% higher by September

Polkadot (DOT) looks ready to extend its ongoing price recovery due to a classic bullish pattern forming on its daily chart.DOT paints “cup and handle” patternNotably, DOT has been forming a “cup and handle” pattern since mid-June, confirmed by its price crashing and recovering in a rounding, U-shaped trajectory (cup), followed by the development of a trading range on the right-hand side (handle).DOT/USD daily price chart featuring “cup and handle” breakout setup. Source: TradingViewCup and handle patterns are typically bullish continuation setups that form during an uptrend. But in rare cases, they appear at the end of a downtrend, leading to a bullish price reversal. As a result, the possibility of DOT continuing its price recovery seems high.Thus, from the technical perspective, DOT initially eyes a breakout above its cup and handle’s resistance line near $8.50. A decisive close above the resistance line, i.e., a breakout move accompanied by a rise in volume, could have DOT eye approximately $12 as its upside target by September, up more than 50% from Aug. ‘s price.Polkadot price breakdown setupHowever, DOT’s road to $12 risks exhaustion due to the presence of key technical resistance levels midway. For instance, the Polkadot token could run into its 100-day simple moving average (100-day SMA; the purple wave) near $9.50 only to pull back toward $8.50. This outlook takes cues from DOT’s price retreat on July 31 from the same wave resistance (highlighted by a circle sign below).DOT/USD daily price chart. Source: TradingViewMeanwhile, a breakdown below the cup’s curvy support could invalidate the bullish cup and handle setup altogether. As a result, DOT could risk an extended price correction toward $6.25, which has been serving as support since June 13 against multiple downturns. In other words, DOT could drop by nearly 20% from Aug. 2’s price at most by September.Polkadot network metrics show stabilityAlong with the broader market, Polkadot experienced a sharp decline in its market capitalization mainly due to macroeconomic turbulences. As of Aug. 2, the project’s net valuation was $7.92 billion versus its record high of $55.51 billion in November 2021.In comparison, Polkadot’s network metrics are healthier. For example, it saw 145,000 monthly users in Q2/2022 versus 149,000 monthly users in Q1/2022, according to Messari’s quarterly DOT report in July.Polkadot account and transfers. Source: Messari/SubscanSimilarly, DOT transfers remained almost the same quarter over quarter, averaging 293 million per month in Q2 versus 288 million in Q1. Interestingly, the peak accounts and transfers’ readings in November 2021 were due to inaugural parachain auctions.Stable network activity underlines a consistently organic demand for DOT tokens. Nonetheless, it remains substantially down from all-time-highs, meaning Polkadot would need to do more to attract new projects for its parachain-enabled network.XCM launch and grantNicholas Garcia, a researcher at Messari, says that Polkadot could gain more adoption with its Cross-Consensus Message Format (XCM). This recently-launched tool allows parachains to relay messages to one another.Related: Polkadot’s founder announces steps toward full decentralization with new governance model”Developing new functionality and use cases will showcase the power of the network and may reignite user interest and activity,” Garcia noted, adding:”Polkadot must continue onboarding parachains and connecting them with XCM.”The Web3 Foundation, which oversees grants on Polkadot, approved 415 projects in late July, ranging from development tooling and wallets to smart contracts and user interface development. The move ensures further potential demand for DOT.The views and opinions expressed here are solely those of the author and do not necessarily reflect the views of Cointelegraph.com. Every investment and trading move involves risk, you should conduct your own research when making a decision.

Čítaj viac

Ethereum futures backwardation hints at 30% 'airdrop rally' ahead of the Merge

Ether (ETH) bulls like a positive spread between its spot and ETH futures prices because the so-called contango reflects optimism about a higher rate in the future. But as of Aug. 1, the Ethereum futures curve slid in the opposite direction.Ethereum quarterly futures in backwardationOn the daily chart, Ethereum futures quarterly contracts, scheduled to expire in December 2022, have slipped into backwardation, a condition opposite to contango, wherein the futures price becomes lower than the spot price. The spread between Ethereum’s spot and futures price grew to -$8 on Aug. 1. ETH230-ETHUSD daily price chart. Source: TradingViewOne one hand, the current ETH spot price being higher than its year-end outlook appears like a bearish sign. However, the conditions surrounding the current negative spread between the Ether spot and futures price suggests traders may actually be bullish on ETH.For instance, Bitcoin (BTC) has gained 15% since its futures entered backwardation in late June for the first time in a year. ETH could rally on “airdrop” hopesMoreover, a potential chain split will likely be bullish in the run-up to the Merge in September, according to some analysts. Roshun Patel, former vice president of institutional lending at Genesis Trading, noted that the December Ether futures have flipped into backwardation due to Ethereum “fork odds,” which could prompt traders to buy spot ETH ahead of the Merge.Meanwhile, Patel hinted that traders could be offsetting their upside spot risks by taking bearish positions on December futures contracts.dec flipping into backwardation on eth starting to price in fork odds. Back in 2020 the play with the bchabc fork was buy spot and short the quarts pic.twitter.com/Oyde1htnz8— Roshun Patel (@roshunpatel) July 31, 2022The statement came after Galois Capital’s survey on the Merge. In the July 28 Twitter poll, the crypto hedge fund asked its followers whether or not the Merge would end up splitting the Ethereum chain into the proof-of-work (PoW) ETH1 and a proof-of-stake (PoS) ETH2.Of the respondents, 33.1% said ththe upgrade would lead to a hard fork, while 53.7% anticipated a smooth network transition.Question 1: What happens during the merge? If Choice 2 or 3 go to Questions 2-5.— Galois Capital (@Galois_Capital) July 27, 2022

Ethereum’s potential chain split means that ETH holders will have an equal amount of tokens on both chains. In other words, an airdrop that grants ETH holders the same amount of ETH1 tokens, a la Ethereum Classic (ETC) in 2016.ETH price technicals flash “golden cross”Ether now consolidates inside a key $1,650–$1,750 resistance bar that served as support during the May–June 2022 session. Meanwhile, the token’s 20-day (green) and 50-day (red) exponential moving averages (EMA) have also formed a “golden cross,” suggesting an interim bullish outlook.  ETH/USD daily price chart. Source: TradingViewA breakout emerging from the $1,650–$1,750 resistance bar could have ETH eye $2,150 as its next upside target. This level was instrumental as resistance in May and June and support in January. It now coincides with the 200-day EMA (the blue wave) near $2,180, up almost 30% from August 1’s price.Related: Ethereum Merge: How will the PoS transition impact the ETH ecosystem?Conversely, a pullback from the resistance bar could expose ETH toward the 20-day EMA (~$15,250) and the 50-day EMA ($1,500) waves.The views and opinions expressed here are solely those of the author and do not necessarily reflect the views of Cointelegraph.com. Every investment and trading move involves risk, you should conduct your own research when making a decision.

Čítaj viac

Získaj BONUS 8 € v Bitcoinoch

nakup bitcoin z karty

Registrácia Binance

Burza Binance

Aktuálne kurzy