Autor Cointelegraph By Yashu Gola

Shiba Inu eyes 50% rally as SHIB price enters 'cup-and-handle' breakout mode

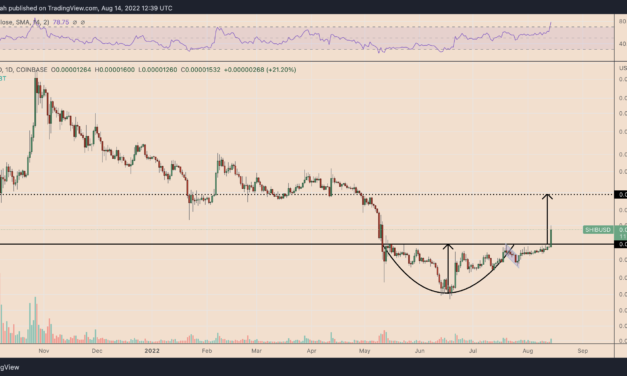
Shiba Inu (SHIB) broke out of its prevailing “cup-and-handle” pattern on Aug. 14, raising its prospects of securing additional gains in the coming weeks.Shiba Inu could soar 50%A cup-and-handle appears when the price falls and rises in a U-shaped trajectory in the first stage, followed by a swift move sideways or downward in the second. Notably, the price trend develops under a common resistance level.Typically, cup-and-handle patterns resolve after the price breaks above the resistance level; SHIB did the same on Aug. 14 after rising 27% to $0.000016, as shown below.SHIB/USD daily price chart. Source: TradingViewPer the rule of technical analysis, a cup-and-handle breakout target is determined by measuring the distance between the pattern’s lowest point and resistance line and adding it to the breakout point. As a result, SHIB could head toward $0.00002253.In other words, a 50% price rally by September.A nonsense rally, nonetheless?Fundamentally, Shiba Inu’s 27% intraday price rally on Aug. 14 had no visible catalysts except a metric showing that SHIB’s burn rate surged by 825% in a day. But the amount of burned SHIB is worth only over $4,500.Shiba Inu burn rate. Source: Shibburn.comOn the whole, however, the Shiba Inu network has burned over $6.36 million worth of SHIB tokens in its lifetime.In addition, the Shiba Inu rally came almost ten days after Binance’s announcement to add SHIB support on its payment cards issued in Europe. In doing so, the crypto exchange raised SHIB’s potential to find new users in the emerging European cryptocurrency space.We are pleased to announce that @binance has added SHIB to the list of supported tokens for the Binance Card issued in Europe.You can now pay with SHIB at 60+ million merchants worldwide. Furthermore, get up to 8% cashback and zero annual or FX fees!https://t.co/0Xj7IXPyt0 pic.twitter.com/FqINtnHFWx— Shib (@Shibtoken) August 5, 2022Weak fundamentals could offset SHIB’s technically bullish bias, however, given tha cup-and-handle setups have only a 61% success rate in meeting their profit targets, according to veteran analyst Tom Bulkowski.Related: 3 cryptocurrencies that stand to outperform ETH price thanks to Ethereum’s MergeTherefore, a failed cup-and-handle breakout—also on a pullback from the 200-day exponential moving average (200-day EMA; the blue wave in the chart below) near $0.00001755—could have SHIB eye an initial correction toward $0.00001306, down 20% from today’s price.SHIB/USD daily price chart. Source: TradingViewShiba Inu’s cup-and-handle setup could fizzle because of the token’s overbought daily relative strength index (RSI). Notably, the RSI has crossed above 70, which typically results in a period of sideways consolidation or correction.The views and opinions expressed here are solely those of the author and do not necessarily reflect the views of Cointelegraph.com. Every investment and trading move involves risk, you should conduct your own research when making a decision.

Čítaj viac

Ominous Solana technicals hint at SOL price crashing 35% by September

Solana (SOL) risks a significant price correction in the coming weeks owing to a classic bearish reversal setup.A 35% SOL price correction ahead?On the three-day chart, SOL’s price has been painting a rising wedge, confirmed by two ascending, converging trendlines and falling trading volumes in parallel.Rising wedges typically result in breakdown, resolving after the asset’s price break below the lower trendline. If the price follows the breakdown scenario, it could fall by as much as the maximum distance between the wedge’s upper and lower trendline.SOL is far from a breakdown but trades within a falling wedge range, as shown in the chart below. The token eyes an immediate pullback from the wedge’s upper trendline with its interim downside target sitting at the lower trendline around $45. SOL/USD three-day price chart. Source: TradingViewIt will risk falling toward $30 if the price breaks below the lower trendline while accompanying a rise in trading volumes. In other words, a 35% price drop by September. Conversely, a bounce from the lower trendline could have SOL eye an immediate rebound toward the wedge’s apex point at around $53.50.A decisive breakout above the upper trendline would invalidate the bearish reversal setup, if SOL rises to the 50-3D exponential moving average (50-3D EMA; the red wave) near $58.$SOL daily close above $45Entered 25% size (bear market size) will stop with close under $42 otherwise targeting $56-60 https://t.co/US0ucViHN6 pic.twitter.com/xo7zfDGMrZ— Pentoshi (leading cattle to butcher) (@Pentosh1) August 13, 2022Battling FUDSolana’s rising wedge breakdown setup appears as it battles a flurry of negative events, including repeated network outages, centralization concerns and a widespread exploit that targeted Solana wallets.Nevertheless, SOL rallied nearly 40% in August, mirroring other crypto assets that gained around 11% month-to-date on average.A part of Solana’s gains also after its team quickly clarified that Slope, a Web3 wallet provider, was solely responsible for the $8 million exploit of crypto wallets, including Solana’s.After an investigation by developers, ecosystem teams, and security auditors, it appears affected addresses were at one point created, imported, or used in Slope mobile wallet applications. 1/2— Solana Status (@SolanaStatus) August 3, 2022

Similarly, Solana released its first “Validator Health Report” on Aug. 10 in response to accusations that its network is heavily centralized. It reported that Solana’s proof-of-history (PoH) blockchain has over 1,900 block-producing nodes worldwide.Nearly 88% of those nodes are operated by independent entities, the report added. SOL/USD daily price chart. Source: TradingViewAdditionally, in May, Solana developers focused on implementing the early stages of their Mainnet Beta v1.10 series, introducing QUIC and Quality of Service (QoS) packets by stake weight and fee prioritization to defend the network against potential outages.Related: Is your SOL safe? What we know about the Solana hack | Find out now on The Market Report”It appears that the network showed signs of stabilization post-v1.10 as lower transaction fees occurred and the daily transaction count reversed the trend between the middle of May and the end of June,” noted James Trautman, a researcher at Messari, in his Solana Q2 report.Solana network usage. Source: Messari/SolscanSolana’s transactions per second (TPS) also improved, from as low as ~700 during network outages to all-time highs above 3,000 after v1.10 began to roll out. Trautman added:”If implementations of v1.10 and subsequent versions continue to drive stability along with successful ecosystem growth strategies, fundamentals will likely move in a positive direction, and network value may too.”The views and opinions expressed here are solely those of the author and do not necessarily reflect the views of Cointelegraph.com. Every investment and trading move involves risk, you should conduct your own research when making a decision.

Čítaj viac

Celsius Network is bankrupt, so why is CEL price up 4,000% in two months?

Crypto lending platform Celsius Network has an approximately $1.2 billion gap in its balance sheet, with most liabilities owed to its users. In addition, the firm has filed for bankruptcy protection, so its future looks bleak.Still, Celsius Network’s native utility token CEL has soared in valuation by over 4,100% in the last two months, reaching around $3.93 on Aug. 13 compared to its mid-June bottom of $0.093. In comparison, top coins Bitcoin (BTC) and Ether (ETH) rallied 40% and 130% in the same period.CEL/USD daily price chart. Source: TradingViewTakeover rumors behind CEL explosion?Technically, the price rally made CEL an excessively valued token in early August when its relative strength index (RSI) crossed above the 70 threshold.Takeover rumors appear to be behind CEL’s upside strength. Notably, Ripple wants to purchase Celsius Network’s assets, according to an anonymous source cited by Reuters on Aug. 10.Reuters reported that Ripple is interested in Celsius assets but there’s no confirmation yet from either companies. Celsius has halted withdrawals from the platform since June and has filed for Chapter 11 bankruptcy which will enable them gradually payback what they owe.— Tajo Crypto (@TajoCrypto) August 10, 2022CEL’s price more than doubled after the piece of news hit the wire.In July, rumors also surfaced about Goldman Sachs’ intention to acquire Celsius Network for $2 billion. CEL was changing hands for as low as $0.39 around that time.CEL price short squeezeAn army of retail traders also appears to be behind the CEL’s giant upside push in the last two months.Some traders have organized a short squeeze to limit CEL’s downside prospects. A short squeeze is when an asset’s price rises suddenly, forcing short sellers to buy back the asset at a higher price to close their positions.Bitcoin & Celsius UpdateBTC is very choppy so my focus is on altcoins & CEL. I’d like btc to hold 22k for bullish bias. Cel wants breakout again, Iam looking to buy more above 2.6 with #CELShortSqueeze army behind it, could CEL pump to $3 next?LIKES/RETWEETS APPRECIATED pic.twitter.com/5axZiwcl1Q— WSB Crypto Mod (@traderrocko) August 12, 2022

It is possible to create a short squeeze because of CEL’s lowering circulating supply, primarily due to the freeze on Celsius Network’s token transfers. Interestingly, FTX had about 5.1 million CEL tokens on Aug. 13, approximately 90% of all the total circulation across exchanges. Meanwhile, the amount of open short positions on the exchange was around 2.66 million CEL versus the monthly high of 2.96 million CEL on Aug. 11.FTX sport short. Source: Legacy SynthesisIn other words, short traders have closed about 300,000 CEL positions in just two days.What’s next for Celsius toke?Short squeezes are hard to sustain over a long period, history shows.Such prospects put CEL at risks of facing extreme correction in the coming weeks or months. As said, the token is already overbought, which further adds up to the downside outlook. CEL/USD three-day price chart. Source: TradingViewDrawing a Fibonacci retracement graph from $6.5-swing high to $0.39-swing low churns out interim support and resistance levels for CEL. Notably, the token now eyes a breakout above its 0.618 Fib line (~$4.21), with its upside target at $5.25, up 45% from today’s price.Related: Crypto markets bounced and sentiment improved, but retail has yet to FOMOConversely, a break below the support level at the 0.5 Fib line (~$3.48) risks crashing CEL toward $2.75, down 25% from the current price level.The views and opinions expressed here are solely those of the author and do not necessarily reflect the views of Cointelegraph.com. Every investment and trading move involves risk, you should conduct your own research when making a decision.

Čítaj viac

3 cryptocurrencies that stand to outperform ETH price thanks to Ethereum's Merge

After years of waiting, Ethereum is finally prepared to become a full-fledged proof-of-stake (PoS) blockchain. Besides Ethereum’s native token Ether (ETH), the valuation of several other tokens have not only benefited greatly, but could also keep outperforming ETH after the Merge. Ethereum steps closer  toward the MergeThe leading smart contract platform completed the last of its three public testnets dubbed “Goerli,” on Aug. 11. Therefore, there should be no delays in Ethereum’s “Merge,” expected to go live on Sep. 19.Ether price jumped 5% to approximately $1,950, its highest level in over two months, after the Goerli update. Meanwhile, certain crypto assets that could benefit from a successful Merge are undergoing upside moves, and have even been outperforming ETH in the past month.ETH/USD daily price chart. Source: TradingViewWill these tokens continue to outperform ETH price into September? Let’s take a closer look.Lido DAO (LDO)The Merge will replace Ethereum’s army of miners with validators, who will be required to front 32 ETH as an economic stake.This major staking requirement has opened up opportunities for middlemen, i.e., platforms that collect Ether from underfunded stakers and put the proceeds together to become validator on the Ethereum blockchain. Lido DAO is one among them.Related: Is it foolish to expect a massive Ethereum price surge pre- and post-Merge?Lido DAO is the leading staking service in terms of value locked inside Merge’s official smart contract. Notably, it has poured 4.15 million ETH into the so-called ETH 2.0 contract, leading Coinbase, which has staked approx. 1.55 million ETH on behalf of its clients.ETH 2.0 total value staked by provider. Source: GlassnodeA successful Merge could boost the demand for Lido DAO services. In turn, it could prove bullish for the platform’s official governance token, LDO, whose value had already soared by more than 200% since July 14, when Ethereum first announced the likelihood of becoming a PoS chain in September. LDO/USD daily price chart. Source: TradingViewTherefore, LDO is one of the primary crypto assets that could benefit the most from Ethereum’s successful transition to POS.Ethereum Classic (ETC)Ethereum Classic (ETC) is another asset that has grabbed the bulls’ attention in recent weeks. That is primarily due to its potential to provide a haven for miners exiting the Ethereum network.Since Ethereum Classic is the split chain from a contentious hard fork in 2016, it exhibits almost all the technical qualities of the current, PoW Ethereum network, making it a natural refuge for ETH miners.Like LDO, ETC has also rallied by over 200% since the Ethereum’s Merge launch announcement on July 14. Therefore, its likelihood of continuing its uptrend is high ahead and after the Merge.ETC/USD daily price chart. Source: TradingViewOptimism (OP)Optimism is an Ethereum rollup service. In other words, it aggregates mass transaction data off-chain into batches and releases results back to the Ethereum mainnet when a consensus is reached.The so-called layer-2 solution could benefit from Ethereum’s “Rollup-Centric Roadmap” after the Merge. Interestingly, OP, Optimism’s governance token, has rallied nearly 250% since the Merge release date announcement.OP/USD daily price chart. Source: TradingViewThe prospects of Ethereum deploying Optimism on its network after the Merge could serve as a bullish catalyst for OP price. The views and opinions expressed here are solely those of the author and do not necessarily reflect the views of Cointelegraph.com. Every investment and trading move involves risk, you should conduct your own research when making a decision.

Čítaj viac

3 signs Ethereum price is on track toward $2.5K by September

Ethereum’s native asset Ether (ETH) has more than doubled in value since bottoming out at around $885 in June 2022. Now, it eyes a decisive move toward $2,500 in August per a slew of technical and fundamental indicators.Ethereum chain split means more tokensA big part of Ether’s ongoing rally has appeared due to “the Merge,” a network upgrade that will switch Ethereum’s underlying blockchain protocol from proof-of-work (PoW) to proof-of-stake (PoS) in September.Simultaneously, switching to PoS will also eliminate the role of miners in the chain by replacing them with validators. This fear has prompted Chandler Guo, a Chinese crypto miner, to resist the Merge by keeping Ethereum’s PoW version alive.A chain split is possible as a result. Guo has already branded his version of the Ethereum PoW chain as “ETHPoW,” alongside its native token “ETHW.” Furthermore, some crypto exchanges have already listed the token for trading with even Binance considering doing the same, if necessary. The Ethereum Merge is approaching. Here’s what you need to know if you hold $ETH on #Binance:Binance will support “The Merge”.In case of newly forked tokens, we will evaluate and consider support for distribution and withdrawal. View details ⤵️https://t.co/iuQSsXZ7fk— Binance (@binance) August 10, 2022A key takeaway from a potential chain split is existing Ether holders will receive an equal amount of tokens from the new chains.In turn, that could boost ETH’s demand in the market, leading its price toward the $2,500 mark in the run-up to the Merge. Bullish flipping underwayDuring its recent price recovery, Ether has confidently rallied toward a critical support-turned-resistance range of $1,625-$1,975.ETH/USD now aims to retake the range as support, thus giving itself a strong price floor to pursue a rally toward and above $2,000. Its nearest upside target is the 50-week exponential moving average (50-week EMA; the red wave in the chart below) at $2,340.ETH/USD weekly price chart. Source: TradingViewThe next range breakout target could be at the Ether’ multi-month descending trendline resistance (the black line) at around $2,500.Institutional inflows gain momentumThe technical upside target of $2,500 receives cues from a recent uptick in capital inflows into Ethereum-based investment funds.Related: Optimism TVL surges nearly 300% M/M ahead of The Merge upgradeNotably, these institutional products attracted $16.3 million from investors in the week ending Aug. 5. Similar funds for Bitcoin witnessed capital outflows worth $8.5 million in the same period, suggesting a strong upside bias for Ether versus the top crypto.Net capital flows in/out of crypto funds. Source: CoinSharesOverall, the buzz around the Merge acts as the main bullish catalyst as mentioned above. However, Ether could see a strong price corrections after the upgrade to PoS occurs in September when traders potentially start to “sell the news.”The views and opinions expressed here are solely those of the author and do not necessarily reflect the views of Cointelegraph.com. Every investment and trading move involves risk, you should conduct your own research when making a decision.

Čítaj viac

Získaj BONUS 8 € v Bitcoinoch

nakup bitcoin z karty

Registrácia Binance

Burza Binance

Aktuálne kurzy