Autor Cointelegraph By Yashu Gola

3 reasons why the Bitcoin price bottom is not in

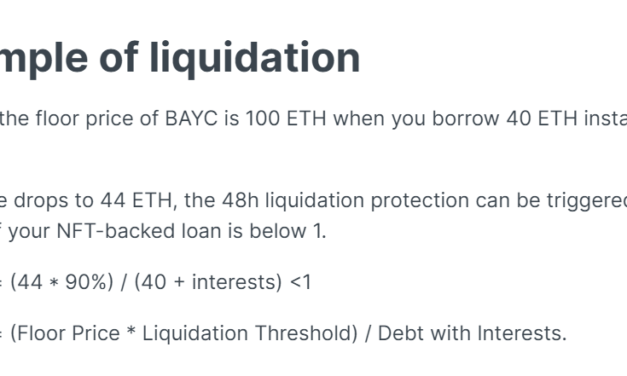
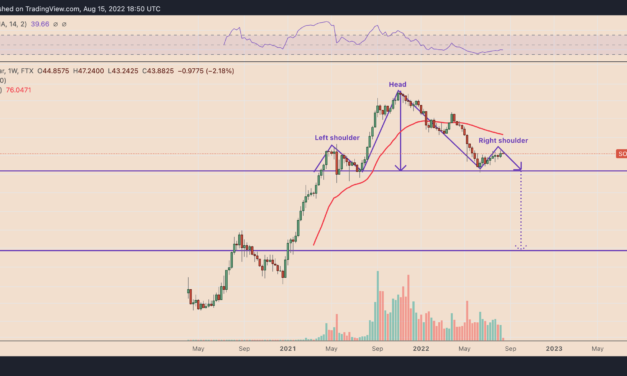
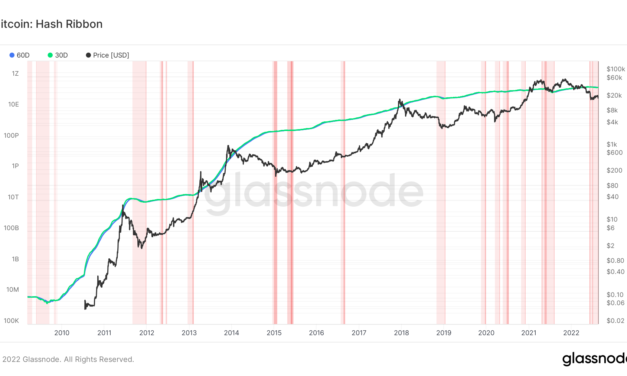
Bitcoin (BTC) recovered modestly on Aug. 20 but remained on course to log its worst weekly performance in the last two months.Bitcoin hash ribbons flash bottom signalOn the daily chart, BTC’s price climbed 2.58% to $21,372 per token but was still down by nearly 14.5% week-to-date, its worst weekly returns since mid August. Nonetheless, some on-chain indicators suggest that Bitcoin’s correction phase could be coming to an end.That includes Hash Ribbons, a metric that tracks Bitcoin’s hash rate to determine whether miners are in accumulation or capitulation mode. As of Aug. 20, the metric is showing that the miners’ capitulation is over for the first time since August 2021, which could result in the price momentum switching from negative to positive.Bitcoin Hash Ribbon. Source: GlassnodeNonetheless, Bitcoin has been unable to shrug off a flurry of prevailing negative indicators, ranging from negative technical setups to its continued exposure to macro risks. Therefore, despite optimistic on-chain metrics, a bearish continuation cannot be ruled out. Here are three reasons why Bitcoin’s market bottom may not be in yet.BTC price rising wedge breaks downBitcoin’s price decline this week has triggered a rising wedge breakdown, suggesting more losses for the crypto in the coming weeks.Rising wedges are bearish reversal patterns that form after the price rises inside a contracting, ascending channel but resolve after the price breaks out of it to the downside, which could result in a drop to as low as the maximum wedge’s height.BTC/USD daily price chart featuring “rising wedge” breakdown setup. Source: TradingViewApplying the technical principles on the BTC chart above presents $17,600 as the rising wedge breakdown target. In other words, the Bitcoin price could fall by approximately 25% by September.Bitcoin bulls are misjudging the FedBitcoin had surged by approximately 45% during its rising wedge formation, after bottoming out locally at around $17,500 in June.Interestingly, the period of Bitcoin’s upside moves coincided with investors’ growing expectations that inflation has peaked—and that the Federal Reserve would start cutting interest rates as soon as March 2023. The expectations emerged from the Fed Chairman Jerome Powell’s FOMC statement from July 27. Powell:”As the stance of monetary policy tightens further, it likely will become appropriate to slow the pace of increases while we assess how our cumulative policy adjustments are affecting the economy and inflation.”Nonetheless, the most recent Fed dot plot shows that most officials anticipate the rates to reach 3.75% by the end of 2023 before sliding back down to 3.4% in 2024. Therefore, the prospects of rate cuts remain speculative.Implied Fed funds target rate. Source: Federal ReserveSt Louis Fed president James Bullard also noted that he would support a third consecutive 75 basis point raise at the central bank’s policy meeting in September. The statement falls in line with the Fed’s commitment to bring inflation down to 2% from its current 8.5% level.Related: Options data shows Bitcoin’s short-term uptrend is at risk if BTC falls below $23KIn other words, Bitcoin and other risk-on assets, which fell into a bear market territory when the Fed began an aggressive tightening cycle in March, should remain under pressure for the next few years.If history is any indicator…The ongoing Bitcoin price recovery risks turning into a false bullish signal given the asset’s similar rebounds during previous bear markets.BTC/USD weekly price chart. Source: TradingViewBTC’s price rebounded by nearly 100%—from around $6,000 to over $11,500—during the 2018 bear market cycle, only to wipe-off the gains entirely and drop toward $3,200. Notably, similar rebounds and corrections also took place in 2019 and 2022.The views and opinions expressed here are solely those of the author and do not necessarily reflect the views of Cointelegraph.com. Every investment and trading move involves risk, you should conduct your own research when making a decision.

Čítaj viac

Nearly $55M worth of Bored Ape, CryptoPunks NFTs risk liquidation amid debt crisis

Many owners of precious Bored Ape Yacht Club (BAYC) and CryptoPunks NFTs, who used them as collateral to take out loans in Ether (ETH), have failed to repay their debts. The situation could lead up to the NFT sector’s first massive liquidation event.gm.As a result of the floor dropping to 72, the first BAYC liquidation auction on BendDAO has begunStarting price of 68.4e…Any takers or is this going to be the first bad-debt domino that falls for the platform? pic.twitter.com/7qxsIi661e— Cirrus (@CirrusNFT) August 18, 2022BAYC “death spiral” incoming?DoubleQ, the founder of web3 launchpad Double Studio, says lending service BendDAO could liquidate up to $55 million worth of NFTs to recover its loans, fearing the so-called “health factor” of these debts could fall below 1.Notably, an NFT collection’s floor price is important in determining the health factor. BendDAO offers 30%-40% of the NFT’s floor price as loans. But the protocol sells the NFT if its floor price falls too close to the amount borrowed—a liquidation threshold, as explained below.BendDAO’s NFT liquidation protocol. Source: Official WebsiteMeanwhile, the floor price of BAYC has fallen from 153.7 ETH in May to 69.69 ETH in August—a nearly 55% plunge in three months. Simultaneously, the health factor of at least 20 loans with BAYC as collateral has fallen to 1.1 as of Aug. 19, data on BendDAO shows.4/ Why is this a problem?There are currently 20 BAYCs with under 1.1 health factorAnd wayyyy more under 1.2Meaning, all of those apes WILL get liquidated, soon. pic.twitter.com/5jwoZZXHRT— doubleQ (@xDoubleQ) August 19, 2022

Borrowers have 48 hours to repay the loan or their NFT collateral will be liquidated. According to doubleQ, these liquidations could lead to “a death spiral for the BAYC ecosystem and NFT market as a whole,” given BendDAO’s exposure to other NFT projects, including CryptoPunks and Doodles.”OpenSea volume is at the lowest point ever in the last 12 months,” the analyst warned, adding: “There’s simply not enough volume to save these liquidations.. It’s inevitable.”BendDAO NFT holdings distribution. Source: doubleQOpenSea is the leading NFT marketplace by volume.To buy the dip or not?Nevertheless, doubleQ believes the incoming BAYC liquidation could offer an opportunity to buy the NFTs at cheaper rates. 7/ So what can you do to take advantage (or at least protect yourself) from the situation?Two options:- Bidding on loans and go for a flip- Waiting for the mass liquidation to have one of the best entry points ever— doubleQ (@xDoubleQ) August 19, 2022

On the other hand, Naimish Sanghvi, CEO of India-based crypto news outlet Coin Crunch, wonders if there would be any buyers due to a lack of arbitrage opportunities. “Your bid has to be more than 95% of the floor value and higher than the debt amount,” explained Sanghvi, noting that there could no room for making money from arbitrage between these values.”The auctions don’t begin until the first bid is placed, so there may be several NFTs in limbo at a given point in time if the prices are unfavorable. And that should scare the Liquidity providers.”This scenario would have BendDAO wait for borrowers to repay their loans—or to wait for the re-emergence of liquidators after a market recovery—to subside its “temporary floating loss.”The views and opinions expressed here are solely those of the author and do not necessarily reflect the views of Cointelegraph.com. Every investment and trading move involves risk, you should conduct your own research when making a decision.

Čítaj viac

Fake Manchester United token soars 3,000% after Elon Musk jokes about buying team

Manchester United Fan Token (MUFC) is a dead coin and not related to the sports franchise, but one Elon Musk tweet was enough to revive it on Aug. 17.Also, I’m buying Manchester United ur welcome— Elon Musk (@elonmusk) August 17, 2022Fake Man U token pumps after Elon Musk’s tweetTo clarify, MUFC is not an official Manchester United crypto token. It came to life in August 2021 after a team of programmers, who are said to be hardcore Manchester United fans, falsely claimed that holding MUFC would give buye influence on the football club’s decisions.The team later conducted an “airdrop” round of 10,000,000,000 MUFC in November 2021, promising to provide 10,000 MUFC to users who followed its official social media handles. The prospects of getting free MUFC tokens helped its price rally to as high as $1.But the project turned out to be vaporware, eventually leading MUFC down by 100% after November. It was deemed extinct until a tweet from billionaire entrepreneur Elon Musk on Aug. 17 revived it from oblivion.The Tesla CEO tweeted that he would buy the Manchester United football club, which he later admitted was a “long-running joke.”No, this is a long-running joke on Twitter. I’m not buying any sports teams.— Elon Musk (@elonmusk) August 17, 2022

Nonetheless, the message sent the financial assets related to Manchester United soaring, including its stock MANU, which rose 1.97% in pre-market trading, and Tezos (XTZ), the club’s official blockchain and training partner, whose market valuation surged by $138.85 million.Even Manchester City’s official crypto token, CITY, popped higher by nearly 14% to reach $7 per piece after Musk’s tweet, despite Manchester City being a different football club.CITY/USD daily price chart. Source: TradingViewOn the other hand, MUFC surged by over 3,000% hours after Musk’s tweet about buying Manchester United, according to data fetched by CoinPaprika.com. MUFC price and volume performance (last seven days). Source: CoinPaprika.com”Manchester United fan token” has zero liquidityHowever, the MUFC rally appears to be price manipulation due to extremely poor liquidity and volume. Notably, in the last 24 hours, MUFC had been trading only against two crypto assets: WBNB and USDT. While the liquidity for the WBNB/MUFC pair was mere $106.84, it was even lower for the USDT/MUFC pair at around $10, according to data from PancakeSwap, a decentralized exchange.MUFC pools statistics as of Aug. 17. Source: PancakeSwapMeanwhile, the net volume that backed MUFC’s 3,000% rally was approximately $39,000 in the last 24 hours, suggesting fewer traders behind the major upside move.MUFC volume record. Source: PancakeSwapThus, a small number of speculators likely used MUFC’s poor liquidity to artificially pump the token. The number of traders who bought the false upside narrative remains unclear, but given thatMUFC has already dropped by 50% from its local top, the prospect that its rate would return to zero is high.Related: Crypto scams fall 65% after gullible noobs exit the market: ChainalysisMeanwhile, the incident reasserts Musk’s strong influence on the crypto market, especially on memecoins like Dogecoin.The views and opinions expressed here are solely those of the author and do not necessarily reflect the views of Cointelegraph.com. Every investment and trading move involves risk, you should conduct your own research when making a decision.

Čítaj viac

EOS price jumps 20% for biggest gain in 15 months — What’s fueling the uptrend?

EOS rose approximately 20% to reach $1.66 on Aug. 17 and was on track to log its best daily performance since May 2021.Initially, the EOS rally came in the wake of its positive correlation with top-ranking cryptocurrencies like Bitcoin (BTC) and Ether (ETH), which gained over 2% and 3.75%, respectively. But, the upside move was also driven by a flurry of uplifting updates emerging from the EOS ecosystem.EOS/USD daily price chart. Source: TradingViewEOS incentive program launchOn Aug. 14, the EOS Network Foundation (ENF), a nonprofit organization that oversees the growth and development of the EOS blockchain, opened registrations for its upcoming Yield+ incentive program.The Yield+ is a liquidity incentive and reward program to attract decentralized finance (DeFi) applications that generate returns for their users. In doing so, the service attempts to compete with its top blockchain rivals in the DeFi space, namely Ether, Cardano (ADA), and Solana (SOL).Since the beginning of Yield+ registration, the total value locked (TVL) inside the EOS pools has increased from 94.71 EOS to 102.18 EOS, showing a temporary spike in demand for the tokens. The TVL will likely increase in the days leading up to the reward activation on Aug. 28. The Yield+ Launch Is Imminent!Designed to build economic activity on $EOS through incentivizing DeFi dApps that increase TVL and generate yield.August 14th — Registration opensAugust 28th — Rewards for TVL beginGet all the details here:➡️ https://t.co/fFOZCOEG4y ⬅️ https://t.co/b6q4Xmlay7 pic.twitter.com/ePZPkEiu4I— EOS Network Foundation (@EosNFoundation) August 10, 2022EOS hard fork in SeptemberIn addition, EOS will rebrand to EOSIO later this week, followed by a v3.1 consensus upgrade called Mandel in September, according to Yves La Rose, the CEO of ENF.The rebranding and upgrade serve as EOS’s symbolic divorce from Block.One, the company that originally designed the network, nine months after the EOS community elected to stop the issuance of 67 million EOS, or around $108 million, to it on malpractice concerns.La Rose noted that the upgrade would occur via a hard fork, meaning that the new version (EOSIO) will not be backward compatible with the original chain and will follow new consensus rules. Rebranding EOSIO and hardforking #EOS is a necessary part of the comeback, and represents the start of a new chapter: #TheNewEOS Under the leadership of the @EOSNFoundation, $EOS can finally break through its glass ceiling and reach its full potential!— Yves La Rose (@BigBeardSamurai) August 15, 2022

A hard fork also means that in the event of a possible chain split, all the existing EOS holders will receive an equal amount of tokens on both chains. In theory, that could increase EOS demand among speculators in the days leading up to the hard fork as witnessed in the case of Ethereum.Technicals hint at more upsideFrom a technical perspective, EOS’s price eyes an extended bull trend in the coming weeksThe first major hint comes from a cup-and-handle formation on the EOS daily chart, confirmed by a U-shaped price trajectory followed by a downward channel trend. As a rule of technical analysis, a cup-and-handle breakout should send the price higher by as much as the pattern’s maximum height.EOS/USD daily price chart featuring cup-and-handle breakout setup. Source: TradingViewAs a result, EOS’s upside target comes to be near $2.45, up almost 50% from the price on Aug. 17.Related: Is Ethereum really the best blockchain to form a DAO?Nevertheless, as a note of caution, the breakout risks losing its momentum near EOS’s 200-day exponential moving average (200-day EMA; the blue wave) at $1.79. Such a pullback could have EOS test the 50-day EMA (the red wave) at $1.21 as its next downside target, almost 25% below the current price.The views and opinions expressed here are solely those of the author and do not necessarily reflect the views of Cointelegraph.com. Every investment and trading move involves risk, you should conduct your own research when making a decision.

Čítaj viac

Solana (SOL) price is poised for a potential 95% crash — Here’s why

Solana (SOL) price rallied by approximately 75% two months after bottoming out locally near $25.75, but the token’s splendid upside move is at risk of a complete wipeout due to an ominous bearish technical indicator.A major SOL crash setup surfacesDubbed a “head-and-shoulders (H&S),” the pattern appears when the price forms three consecutive peaks atop a common resistance level (called the neckline). Notably, the middle peak (head) comes to be higher than the other two shoulders, which are of almost equal height.Head and shoulders patterns resolve after the price breaks below their neckline. In doing so, the price falls by as much as the distance between the head’s peak and the neckline when measured from the breakdown point, per a rule of technical analysis.It appears SOL has been forming a similar bearish setup on its longer-timeframe charts.  SOL/USD weekly price chart featuring H&S breakdown. Source: TradingViewOn the weekly chart, the token has been forming the right shoulder of the overall pattern, suggesting a correction toward the neckline at $27 during the second half of 2022. Meanwhile, a breakdown below $27 could result in an extended correction toward $2.80.In other words, a 95% price decline by the end of 2022 or early 2023, a setup also projected by pseudonymous analyst “PROFIT BLUE.”I will leave this here, now that it looks better.. #Solana pic.twitter.com/w03Y4Ffl8o— PROFIT BLUE (@profit8lue) August 14, 2022Is this a bear market rally?Solana’s extremely eerie bearish setup appears as it closely tails trends across risk-on markets, mainly driven by the Federal Reserve’s hawkish response to inflationary pressures.For instance, SOL closed the week ending Aug. 14 at a 10.5% profit, similar to Bitcoin (BTC) and the benchmark S&P 500 index. These markets reacted to a softer-than-anticipated U.S. consumer price index (CPI), raising possibilities that the Fed would slow the pace of its interest rate hikes.SOL/USD and S&P 500 daily correlation coefficient. Source: TradingViewBut many analysts have warned about these ongoing price rallies in the risky corners of the market, citing pieces of historical evidence of similar bear market bounces. So, SOL’s 75% rebound risks turn into a fakeout if its correlation with riskier assets remains positive.From a fundamental perspective, Solana also faces extreme FUD due to its recurring network outages and rumored centralization. However, the project’s backers have introduced new upgrades to fix these issues, as Cointelegraph discussed.But even then, a 95% price crash is too “wild,” suggests market analyst IncomeSharks, saying that it would mean Solana is a rug pull project like Terra (LUNA) — now Terra Classic (LUNC).Related: Fallout from crypto contagion subsides but no market reversal just yetThe next big drop could have SOL explore bounce opportunities near a multi-year ascending support trendline, as shown below.SOL/USD daily price chart. Source: TradingViewIn other words, SOL’s bearish continuation could last until its price hits $20, down over 55% from August 16’s price.The views and opinions expressed here are solely those of the author and do not necessarily reflect the views of Cointelegraph.com. Every investment and trading move involves risk, you should conduct your own research when making a decision.

Čítaj viac

Získaj BONUS 8 € v Bitcoinoch

nakup bitcoin z karty

Registrácia Binance

Burza Binance

Aktuálne kurzy