Autor Cointelegraph By Yashu Gola

Looks bare: OpenSea turns into NFT ghost-town after volume plunges 99% in 90 days

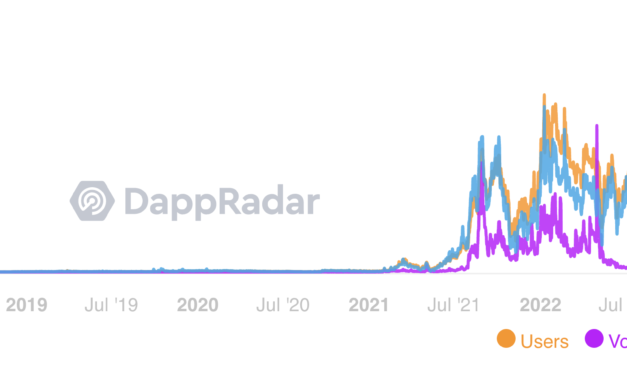
OpenSea, the world’s largest nonfungible token (NFT) marketplace, has witnessed a substantial drop in daily volumes as fears about a potential market bubble grow.OpenSea volume plummets to yearly lowsNotably, the marketplace processed nearly $5 million worth of NFT transactions on Aug. 28 — approximately 99% lower than its record high of $405.75 million on May 1, according to DappRadar.OpenSea users, volume, and transactions statistics. Source: DappRadarThe massive declines in daily volumes coincided with equally drastic drops in OpenSea users and their transactions, suggesting that the value and interest in the blockchain-based collectibles have diminished in the recent months.That is further visible in the falling floor prices — the minimum amount one is ready to pay for an NFT — of leading digital collectible projects. For instance, the floor price of the Bored Ape Yacht Club has dropped by 53% to 72.5 ETH on Aug. 28 versus a high of 153.7 ETH on May 1. BAYC floor price throughout history. Source: CoinGeckoSimilarly, the floor price of CryptoPunks, another top NFT collection, dropped almost 20% from its July high of 83.72 ETH.NFT bubble is burstingNFT prices are quoted in the native currency of the blockchain on which they are launched. So a digital collectible created on Ethereum will be purchased using Ether (ETH), which also means that NFT’s prices will fall if ETH’s market valuation plummets.A bearish ETH market appears to be one of the primary drivers behind the poor NFT statistics. Notably, the price of one Ether has fallen from $4,950 in November 2021 to below $1,500 in August 2022.ETH/USD three-day price chart. Source: TradingViewBendDAO votes to improve NFT liquidityLast week, BendDAO, a decentralized autonomous organization that enables NFT owners to collateralize their digital collectibles to take loans (in ETH) worth 30%-40% of the NFT’s floor price, voted to change its protocol’s code to make its NFT collateral more liquid.The vote occurred after a rise in Ether price increased the value of ETH-denominated loans in dollar terms. Meanwhile, on the other hand, NFT prices plummeted, reducing the value of the collateral held by BendDAO.As a result, BendDAO is now facing its own debt crisis moment, where borrowers cannot pay their dollar-denominated loans due to falling ETH prices, and lenders are finding it difficult to recover their loaned amount due to falling collateral valuations.Related: Prosecutors want to claim NFTs as securities, alleges legal team of former OpenSea employeeBendDAO’s latest vote has changed its NFT liquidation threshold from 95% to 70%. It has also reduced the time offered to borrowers to avoid liquidation from 48 hours to 4 hours to attract more bids for their NFT collaterals.In other words, the floor price of NFTs, including BAYC, risks plunging further if the market’s liquidity continues to dry u.agreed, 2020-2021 was crazy get-rich-in-months & the DeFi-NFT-Web3 bubble is going bust now, turns out founders & VCs were scammers only in for the $$$.But pipl said its over in 2018 too after ICOs.The next bubble will come 100%, you just need to survive.play the long game. https://t.co/5f17JfdFfY— doncrypto (@DonCryptoDraper) August 29, 2022The views and opinions expressed here are solely those of the author and do not necessarily reflect the views of Cointelegraph.com. Every investment and trading move involves risk, you should conduct your own research when making a decision.

Čítaj viac

XRP price pumps and dumps amid mysterious $51M whale transfers — what's next?

Ripple (XRP) price saw a major spike on Aug. 26, hinting at a possible effect from some big traders.Large XRP transfers, Ripple Swell Global eventNotably, XRP’s price jumped 6% to $0.37, a two-week high, during the early London hours. The token’s upside move occurred hours after its network processed three massive transfers worth $51 million involving crypto exchanges Bitso and FTX, as highlighted by Whale Alert.XRP/USD hourly price chart. Source: TradingViewXRP’s gains also came as a part of a broader upside move that started on Aug. 25, a day after Ripple announced its flagship event, “Ripple Swell Global,” to be held in London in November 2022. The market has seen similar reactions around the Swell event in the past.Bearish reversal setup in playXRP’s intraday spike left behind a “Graveyard Doji,” a bearish reversal candlestick with open, close and low prices near each other with a long upper wick. This candlestick suggests that the price rally witnessed at the beginning of the session was overwhelmed by bears by the end of it.XRP/USD four-hour price chart. Source: TradingViewXRP now trades nearly 4% below its intraday high, testing a support confluence. The confluence comprises the upper trendline of XRP’s previous “ascending triangle” (at $0.35) and the 50-4H exponential moving average (50-4H EMA; the red wave in the chart above) near $0.343.From a technical perspective, a break below the support confluence risks re-triggering the ascending triangle setup, with its profit target at around $0.33. In other words, a 7% price decline by September when measured from today’s price.Related: Ripple CTO lashes back at Vitalik Buterin for his dig at XRPConversely, a rebound after testing the support confluence could have XRP eye a recovery rally toward the $0.36-$0.38 range (marked in red in the chart above). This area served as XRP’s consolidation range in recent months.The views and opinions expressed here are solely those of the author and do not necessarily reflect the views of Cointelegraph.com. Every investment and trading move involves risk, you should conduct your own research when making a decision.

Čítaj viac

Why September is shaping up to be a potentially ugly month for Bitcoin price

Bitcoin (BTC) bulls should not get excited about the recovery from the June lows of $17,500 just yet as BTC heads into its riskiest month in the coming days.The psychology behind the “September effect”Historic data shows September being Bitcoin’s most worst month between 2013 and 2021, except in 2015 and 2016. At the same time, the average Bitcoin price decline in the month is a modest -6%.Bitcoin monthly returns. Source: CoinGlassInterestingly, Bitcoin’s poor track record across the previous September months coincides with similar downturns in the stock market. For instance, the average decline of the U.S. benchmark S&P 500 in September is 0.7% in the last 25 years.S&P 500 performance in August and September since 1998. Source: BloombergTraditional chart analysts have dubbed this annual drop-off as the “September effect.”Analysts argue that investors exit their market positions after returning from their summer vacations in September to lock gains, or even tax losses, ahead of the year’s close. Meanwhile, they also note that individual investors liquidate their assets in September to pay for their children’s annual school costs.Bitcoin’s correlation with the stock market has been largely positive during and after the coronavirus pandemic. Therefore, in addition to the September effect, these mirroring price trends could also increase BTC’s likelihood of dropping high in the ominous month.So expect low volume, chop & random violent moves in either direction. The point of this post isn’t to fearmonger anyone. Always a green markets somewhere. I’m sharing insight on what to expect to save newer retail traders from excruciating pain. Be patient and embrace the suck— Seven V. Matos (@Sevenvmx) August 22, 2022Fed eyes 75bps rate hikeBitcoin’s losses in 2022 were drawn from fears of the Federal Reserve’s rate hikes and the complete unwinding of its $120 billion monthly bond-buying plan to tackle rising inflation.But the market’s narrative shifted to hopes that inflation had peaked. The belief strengthened after the July U.S. consumer price index (CPI) came at 8.5% versus 9.1% in the month prior, leading to speculations that the Fed would tone down its tightening plans. It coincided with Bitcoin and S&P 500 recouping small portions of their yearly losses, as illustrated below.BTC/USD versus S&P 500 (SPX) daily price chart. Source: TradingViewBut several analysts believe that Bitcoin’s recovery could be a bull trap, a “relief rally” that will trap investors who think the market has bottomed.The psychology of a relief rally Price gets just bullish enough to fool you that this rally is the real deal. There could be an end to the pain. Then BLAMO, the market rugs you shattering your hopes. Expect this a few more times during the bear!#bitcoin #crypto— Lark Davis (@TheCryptoLark) August 22, 2022

Moreover, most Fed officials still favor raising by 75 basis points at their next meeting in September, given their pledge to bring inflation down to 2%.Related: Wen moon? Probably not soon: Why Bitcoin traders should make friends with the trendAs a result, Bitcoin and S&P 500 risk continuing their prevailing correction trend in September, eyeing more yearly lows.Bitcoin technicals hint at drop to $17.6KFrom a technical perspective, Bitcoin will decline toward $19,250 by September if it breaks out of its current “bear flag” pattern. The bearish continuation setup is illustrated in the four-hour chart below.BTC/USD four-hour candle price chart featuring “bear flag” setup. Source: TradingViewMeanwhile, on the daily chart, BTC has been breaking down from its rising wedge pattern since Aug. 19. The bearish reversal setup’s profit target comes to be near $17,600, as illustrated in the chart below. BTC/USD daily price chart featuring rising wedge breakdown setup. Source: TradingViewOverall, September looks like it could once again be a red month for Bitcoin based on technical, fundamental and macro factors.The views and opinions expressed here are solely those of the author and do not necessarily reflect the views of Cointelegraph.com. Every investment and trading move involves risk, you should conduct your own research when making a decision.

Čítaj viac

3 reasons why Chiliz is up 35% this week — and where is CHZ price heading next?

The price of Chiliz (CHZ) has surged by approximately 35% week-to-date (WTD) to reach $0.26 per token on Aug. 24. In doing so, the token has outperformed Bitcoin (BTC) and Ether (ETH), which have been wobbling between gains and losses in the same period.CHZ/USD versus BTC/USD and ETH/USD daily price chart. Source: TradingViewHere are the key catalysts that could be behind Chiliz’s breakaway rally.CHZ 2.0On Aug. 22, Chiliz founder Alexandre Dreyfus announced their intentions to stop utilizing the Ethereum blockchain to launch their fungible and nonfungible tokens and replace it with its own native chain, CHZ 2.0.”We don’t have to rely forever only on ERC20 or ERC721 equivalent,” said Dreyfus, adding: “At @chiliz we think we can bring some innovation on top of fungible token formats. As we work with 100+ of the biggest brands in the world, it is easier to deploy and scale.”The announcement coincided with CHZ undergoing a 19% intraday price rally on Aug. 22, accompanied by a spike in trading volume. From a technical perspective, the move showed traders’ conviction in the CHZ 2.0 announcementCHZ/USD daily price chart. Source: TradingViewThe return of Chiliz whalesCHZ’s price boom this week further coincided with the rise in whale activities.Notably, the number of CHZ transactions whose value exceeds $100,000 reached 105 on Aug. 23, its highest since Mar. 29, according to data provided by Santiment. Moreover, CHZ’s price rallied nearly 12.5% on the same day.Chiliz price versus whale activity. Source: SantimentThe parallel rise in CHZ’s whale activity, volume, and price suggest that most rich investors have been buying the token after the CHZ 2.0 announcement.Technical breakout underwayChiliz’s ongoing price rally comes as a part of a technical breakout move that started mid August.On the daily chart, CHZ broke out of its prevailing cup and handle setup on Aug. 14 after closing above the pattern’s neckline range (the red bar), as shown below. A cup and handle pattern is considered a bullish reversal setup by traditional chart analysts.The technical setup, coupled with the CHZ 2.0 announcement, could have influenced traders to remain bullish on CHZ. It could also mean that the token would keep rallying until it hits the cup and handle pattern’s profit target at around $0.32, up another 35% from today’s price.Related: Blockchain, crypto set to take sports industry beyond NFT collectiblesThe target is determined by measuring the cup and handle’s maximum height and adding the outcome to the neckline. In other words, CHZ price could reach it by September, given it current upside momentum.The views and opinions expressed here are solely those of the author and do not necessarily reflect the views of Cointelegraph.com. Every investment and trading move involves risk, you should conduct your own research when making a decision.

Čítaj viac

Warren Buffett pivots to U.S. Treasuries — a bad omen for Bitcoin's price?

Warren Buffett has put most of Berkshire Hathaway’s cash in short-term U.S. Treasury bills now that they offer as much as 3.27% in yields. But while the news does not concern Bitcoin (BTC) directly, it may still be a clue to the downside potential for BTC price in the near term.Berkshire Hathaway seeks safety in T-billsTreasury bills, or T-Bills, are U.S. government-backed securities that mature in less than a year. Investors prefer them over money-market funds and certificates of deposits (COD) because of their tax benefits.Related: Stablecoin issuers hold more US debt than Berkshire Hathaway: ReportBerkshire’s net cash position was $105 billion as of June 30, out of which $75 billion, or 60%, was held in T-bills, up from $58.53 billion at the beginning of 2022 out of its $144 billion total cash reserves.The move is likely a response to bond yields jumping massively since August 2021 in the wake of the Federal Reserve’s hawkish policies aimed at curbing inflation, which was running at 8.4% in July. For instance, the three-month U.S. T-bill returned a 2.8% yield on Aug. 22 compared to a near-zero yield a year ago. Similarly, the yield on U.S. one-year T-bill climbe from zero to 3.35% in the same period.U.S. 3-month and 1-year bond yield versus BTC/USD daily timeframe chart. Source: TradingViewMeanwhile, non-yielding assets like gold and Bitcoin have dropped roughly by 2.5% and 57% since August 2021. The U.S. stock market benchmark S&P 500 likewise saw a decline, losing nearly 7.5% in the same period.Related: BTC to lose $21K despite miners’ capitulation exit? 5 things to know in Bitcoin this weekSuch a difference in performance presents T-bills as an ultra-safe alternative for investors when compared to gold, Bitcoin and stocks. Buffett’s T-bill strategy suggests the same, namely a bet on more downside for risk-on assets in the near term — particularly as the Fed gears up for more rate hikes.”Buffett is a value investor, so he won’t allocate much when the equity markets are as overvalued as they have been for the last five years,” said Charles Edwards, founder of quantitative crypto fund Capriole Investments.Meanwhile, Andrew Bary, an associate editor at Barron’s, underscored the market’s potential to tail Buffett’s strategy, saying:”Individual investors may want to consider following Buffett’s lead now that they are yielding as much as 3%.”Bitcoin: safe-haven or risk-on?Positive-yielding debts risk are dampening the demand for other potential safe-havens, Bitcoin included. In other words, increasingly risk-averse investors could be opting for assets that offer fixed yields over those that don’t.The performance of Bitcoin-focused investment funds in August supports this argument with capital outflows for three weeks in a row, including a $15.3 million exit in the week ending Aug. 19.Overall, these funds have lost $44.7 million on a month-to-date basis, according to CoinShares’ weekly report. In total, digital asset investment products, including BTC, have witnessed month-to-dat outflows totaling $22.2 million.Flows by asset. Source: CoinSharesDoes that mean Bitcoin will continue to lose its sheen against positive-yielding U.S. government debts? Edwards does not agree. “Allocation to treasuries and other low-yield cash products is really a decision that needs to be made case-by-case depending on an individual’s goals and risk appetite,” he explained, adding:”In the short-term, there are times it makes sense to hedge against Bitcoins volatility with cash, the best cash being the US Dollar. But, in the long-term, I think all fiat currencies tend towards zero against Bitcoin.Edwards also points out that Buffett’s long-term strategy remains largely risk-on. Notably, Berkshire deployed 34% of its cash holdings to buy equities in May and that over 70% of its portfolio is still made up of risk-on assets.”Looking at Buffett’s 75% risk allocation; and knowing that Bitcoin has been the best performing asset of all asset classes in the last decade, having the highest risk-adjusted returns, I know where I would be putting my money,” he add.Buffett’s portfolio, however, will likely continue to eschew direct BTC investment as the “oracle of Omaha” remains a fierce critic. In February 2020, he said that it “does not create anything,” adding:“I don’t own any cryptocurrency. I never will… You can’t do anything with it except sell it to somebody else.”Earlier this year, however, Buffett’s Berkshire Hathaway increased exposure in a Bitcoin-friendly neobank while reducing its stake in Visa and Mastercard.The views and opinions expressed here are solely those of the author and do not necessarily reflect the views of Cointelegraph.com. Every investment and trading move involves risk, you should conduct your own research when making a decision.

Čítaj viac

Získaj BONUS 8 € v Bitcoinoch

nakup bitcoin z karty

Registrácia Binance

Burza Binance

Aktuálne kurzy