Autor Cointelegraph By Yashu Gola

Cardano gets listed on Robinhood but ADA bulls are running out of steam, risking 40% drop

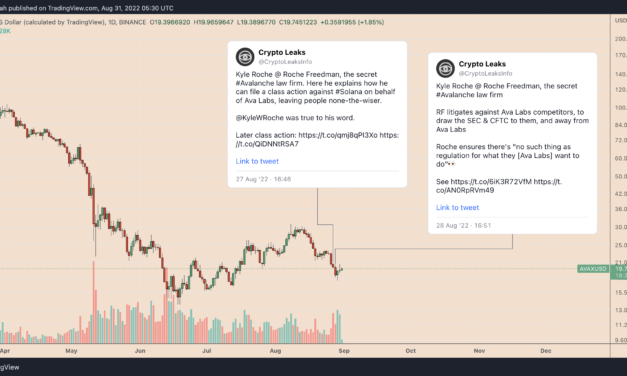
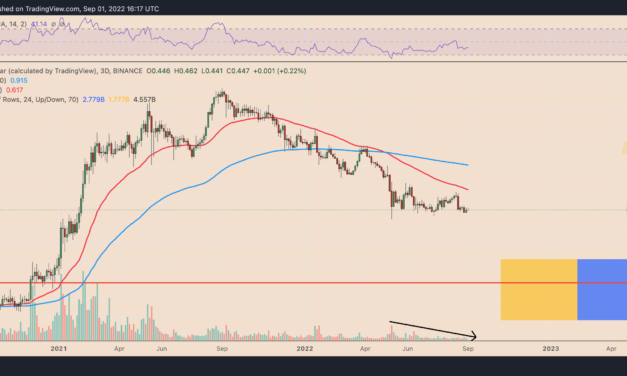
ThCardano (ADA) market has witnessed back-to-back pieces of good news since Aug. 31, from its listing on Robinhood, a U.S.-based retail investment platform, to the release of its first lending and borrowing protocol, Aada Finance.Additionally, Cardano developer IOHK stated that they are close to clinching “three critical mass indicators” that would lead to the launch of their long-awaited Vasil hard fork in September. Vasil aims to improve Cardano’s scalability and transaction throughput through pipelining.The upgrade could also improve the decentralized application (DApp) and smart contract capabilities by changing the Plutus script, a programming language used for smart contracts on the Cardano blockchain.This week, we’re well on our way to hitting our indicators. Over 80% of SPOs have upgraded and more than 70% of the top DApps we’re tracking have confirmed successful pre-production testing.✅4/8— Input Output (@InputOutputHK) August 31, 2022But the uplifting updates have failed to attract adequate buyers as ADA’s price trend in the last 24 hours reveals.Bear market rallyOn the daily chart, ADA’s price rose to an intraday high of $0.462 on Sep. 1, a day after bouncing from its sessional low of $0.424, up nearly 9%. Related: Cardano outranks Bitcoin in global top intimate brands in new reportNonetheless, the move accompanied lower trading volumes, suggesting weaker conviction among traders about an extended rally. ADA/USD daily price chart. Source: TradingViewADA’s modest price rise also came after a sharp 28.5% decline, typically due to short covering, i.e., when traders buy back borrowed tokens to close their open bearish position, thus lifting the spot price briefly.As a result, Cardano’s rebound may be a bear market rally. This expectation emerges from ADA’s exposure to macroeconomic risks that have kept the ADA/USD pair nearly in lockstep with U.S. stocks. ADA/USD and Nasdaq daily correlation coefficient. Source: TradingView For instance, the correlation coefficient between ADA and Nasdaq was 0.80 on Sept. 1.Descending triangle breakdown ahead?From a technical perspective, ADA has been painting a descending triangle pattern on its daily chart since May 7. In detail, descending triangles appear as the price consolidates inside a range defined by a falling upper trendline and a horizontal lower trendline. They typically resolve after the price breaks below the lower trendline and, as a rule, can fall by as much as the maximum triangle height.ADA/USD three-day price chart featuring descending triangle breakdown setup. Source: TradingViewADA now tests the lower trendline of its descending triangle setup for a potential breakdown, as shown below. The token will fall to $0.268 by September if the pattern plays out as mentioned above, or a 40% drop from current prices.The views and opinions expressed here are solely those of the author and do not necessarily reflect the views of Cointelegraph.com. Every investment and trading move involves risk, you should conduct your own research when making a decision.

Čítaj viac

Ethereum to $2K? ETH price 'bull flag' hints at September gains versus Bitcoin, dollar

Ethereum’s native token, Ether (ETH), looks ready to grow stronger compared to the U.S. dollar and Bitcoin (BTC) in the days leading up to its proof-of-stake transition in September.ETH price chart bullish setupThe bullish outlook emerges from classic technical indicators on ETH/USD and ETH/BTC charts. For instance, ETH/USD has been forming a “falling wedge” pattern with a profit target sitting around 30% above the current prices. Meanwhile, the ETH/BTC chart is painting a potential “bull flag” that could increase the price by approximately 10% from current price levels upon resolution. Here’s how these bullish setups could play out.Ethereum to $2K next?Falling wedges form when the price trends lower inside a descending, contracting channel. Falling wedge illustration. Source: New Trader UThey typically resolve after the price breaks above their upper trendlines. Their breakout target is as high as the maximum distance between their upper and lower trendlines when measured from the breakout pointETH’s price has been decreasing since mid-August in a falling wedge pattern. It recently rebounded after testing the structure’s lower trendline to hit the upper trendline and now eyes a breakout toward or above $2,000, as shown below.ETH/USD daily price chart featuring falling wedge breakout setup. Source: TradingViewThe wedge’s profit target coincides with Ethereum’s 200-day exponential moving average (200-day EMA; the blue wave) at $2,055. Moreover, the target appears to be a junction as ETH eyes an extended bull run toward $2,500. This level is the upside target of a broader ascending channel (the purple range) that has been forming since June.In other words, ETH’s price could grow anywhere by 30%–55% in September.ETH/BTC bull flag setupBull flags surface when the price consolidates lower inside a descending, parallel channel after a strong upward move.Bull flag illustration. Source: ThinkMarketsThe pattern resolves after the price breaks above its upper trendline, followed by an extended upside move toward the level at a length equal to the size of the previous uptrend, also called flagpole. As a result, analysts call bull flags “bullish continuation” patterns.Ether has been forming a bull flag against Bitcoin since early August, awaiting breakout as it tests the structure’s upper trendline for one. Suppose it happens, then the price could rise toward 0.087 BTC, up approximately 10% from August 3’s price.ETH/BTC daily price chart featuring bull flag breakout setup. Source: TradingViewAlternatively, ETH/BTC could flip lower to retest the flag’s lower trendline. This trendline appears to be coinciding with a support confluence consisting of a 50-day EMA (the red wave) and the 0.618 Fib line at 0.0729 BTC.Related: Ethereum miner balance reaches four-year high weeks before the MergeThe pullback will not invalidate the bull flag breakout setup unless the price breaks below the lower trendline. But if it does, ETH/BTC risks falling toward $0.088 BTC, a level synchronous with the 0.5 Fib line and the 200-day EMA (the blue wave).The views and opinions expressed here are solely those of the author and do not necessarily reflect the views of Cointelegraph.com. Every investment and trading move involves risk, you should conduct your own research when making a decision.

Čítaj viac

Potential Bitcoin price double-bottom could spark BTC rally to $30K despite ‘extreme fear’

Bitcoin’s (BTC) price may climb by more than 50% in September, a month otherwise considered ominous for the cryptocurrency due to its poor historical returns. BTC price double-bottom and then to $30K?The conflicting upside signal comes from a potential double-bottom pattern on Bitcoin’s longer-timeframe charts against the United States dollar. Double-bottoms are bullish reversal patterns that resemble the letter W due to two lows and a change in direction from downside to upside.Double-bottom illustrated. Source: ThinkMarketsBitcoin’s decline below $20,000 in July, followed by a sharp recovery toward $25,000 and a subsequent return to the $20,000 level in August, partially confirms the double-bottom scenario. The cryptocurrency would complete the pattern after rebounding toward $25,000.A W-shaped price move in an ideal scenario could be followed by another sharp move higher — a double-bottom breakout. Meanwhile, a double-bottom’s upside target is found after measuring the distance between the pattern’s peak (neckline) and lowest levels and adding the outcome to the breakout point, as illustrated below. In other words, a potential 50% price rally.BTC/USD daily price chart featuring double-bottom breakout setup. Source: TradingViewAs a note of caution, double-bottom setups carry a small degree of failure risks, about 21.45%, according to Samurai Trading Academy’s study of popular charting patterns.Market slips back into “extreme fear“Bitcoins bullish reversal scenario occurs amid general price depreciation across the risk-on markets.Originally, BTC’s descent to $20,000 started after Federal Reserve Chair Jerome Powell reasserted his hawkish stance on inflation at Jackson Hole last week. It further prompted the Bitcoin market sentiment to fall into the “extreme fear” category, according to the popular Fear and Greed index, or F&G.The market is not enjoying $BTC hanging around $20k. Back into Extreme Fear today. Live chart: https://t.co/Jr5151zN7I pic.twitter.com/UnztrZP7FP— Philip Swift (@PositiveCrypto) August 31, 2022But, to Philip Swift, creator of Bitcoin data source LookIntoBitcoin, the market sentiment is not as fearful as it was in June due to a “huge amount of forced selling” at now-defunct crypto hedge fund Three Arrows Capital and the stablecoin project Terra.“The F&G score is nowhere near as intensely fearful as it was back when the score dropped to as low as 6; it is currently at 23,” Swift explained, adding: “There was blind panic back then, whereas we are currently in a period of apathy where people are tired of the bear market and are more interested in their summer holidays and/or the cost of living crisis.”The statement aligns with Bitcoin investors selling their holdings at a $220 million daily average loss, according to data tracked by Glassnode.“Investor psychology appears to be one that is keen to simply ‘get my money back,’ with a great degree of spending taking place at and around their cost basis,” the on-chain analytics firm stated in its latest weekly report, adding that the Bitcoin bulls are fighting an uphill battle.Related: UBS raises US recession odds to 60%, but what does this mean for crypto prices?That includes whales, entities that hold anywhere between 1,000 and 10,000 BTC. They have been accumulating Bitcoin lately as the price wobbles around $20,000, according to data resource Ecoinometrics.The whales addresses controlling 1k to 10k BTC are starting to accumulate coins on-chain again.For sure that won’t cancel the bear market but apparently some people love #Bitcoin at $20k. pic.twitter.com/7oQmAZ4T5K— ecoinometrics (@ecoinometrics) August 29, 2022

“In this bear market, you want to either dollar cost average in a position or straight up buy the dip and wait,” wrote Nick, an analyst at Ecoinometrics. The views and opinions expressed here are solely those of the author and do not necessarily reflect the views of Cointelegraph.com. Every investment and trading move involves risk, you should conduct your own research when making a decision.

Čítaj viac

AVAX price rebounds 15% after Crypto Leaks sell-off but Avalanche could still bury bulls

Avalanche (AVAX) bulls snubbed the sensational claims made by a self-proclaimed whistleblower website that the project’s parent firm, Ava Labs, paid lawyers to damage its competitors’ reputation.Avalanche price recovers from serious allegationsAVAX’s price established an intraday high of $19.75 on Aug. 30, two days after bottoming out locally at $17.50, amounting to a 15% rise. The token’s modest recovery followed selloffs incurred by a sensational CryptoLeaks report.️ #Avalanche is the top rising topic in #crypto following a claim that its #blockchain was attempting to manipulate regulatory systems. After hitting a 7-week low about 9 hours ago, $AVAX is up +7.5% since. We’re watching how news of this unfolds. https://t.co/Ry1mGvdMap https://t.co/OHmNMkpAzS pic.twitter.com/kk3zue4d3G— Santiment (@santimentfeed) August 29, 2022AVAX’s price fell 3.5% on Aug. 26, the day on which CryptoLeaks released an unverified video showing Kyle Roche, the partner at Roche Freedman, saying that he could sue Solana, one of Avalanche’s top rivals, on behalf of Ava Labs. Related: Ava Labs CEO denies CryptoLeaks’ claims as ‘conspiracy theory nonsense’The token fell by another 7.5% the next day after the whistleblower website released the full report, including another unverified video featuring Roche.AVAX/USD daily price chart. Source: TradingViewIn addition, Avalanche’s intraday losses aligned with similar negative moves across other top crypto assets.AVAX can rise 55%Avalanche’s fundamentals are strongly tied to the overall cryptocurrency market, which keeps it prone to undergoing additional downtrends.Independent analyst PostyXBT noted that AVAX’s price could decline to the $13-$15 range next and to “keep BTC in mind” while placing a short position toward the area. $AVAXTextbook short set up forming.Only concern being deviation caused by $BTC running higher towards $20.8k. Manage position size accordingly and keep btc in mind when setting invalidation levels pic.twitter.com/8wRgZxkOcv— Posty (@PostyXBT) August 30, 2022

Analyst BrechTP also anticipates the price to crash toward $14 based on a “head and shoulder” setup, as shown below.Related: A sharp drop in TVL and DApp use preceded Avalanche’s (AVAX) 16% correctionAVAX/USD four-hour price chart. Source: BrechTPConversely, analyst TraderSZ sees AVAX’s price to continue its recovery trend in the coming days. His setup, as illustrated below, envisions the Avalanche token to reach approximately $30 in September.AVAX/USDT two-hour price chart. Source: TraderSZ/TradingViewThe upside target aligns with AVAX’s prevailing “symmetrical triangle” setup. Notably, the price has rebounded after testing the triangle’s lower trendline as support and now sees the structure’s upper trendline as its interim upside target.  The upper trendline is near the TraderSZ’s price target of $30, as shown below.AVAX/USD weekly price chart. Source: TradingViewIn other words, AVAX could rally by over 55% from its current price levels.The views and opinions expressed here are solely those of the author and do not necessarily reflect the views of Cointelegraph.com. Every investment and trading move involves risk, you should conduct your own research when making a decision.

Čítaj viac

These 3 altcoins have completely ignored the bear market in the last 90 days

The cryptocurrency market overall endured a bad summer on back-to-back pieces of bad news, ranging from Terra’s collapse to the Celsius Network’s liquidity crisis. But some tokens have bucked the downtrend and have actually seen their valuations go up over the summer.Specifically, the last 90 days have seen these so-called alternative cryptocurrencies, or “altcoins,” outperforming top coins like Bitcoin (BTC) and Ether (ETH). Here are three among themChiliz (CHZ)Chiliz’s (CHZ) return in the last 90 days comes to be above 80%, the highest among the top-cap cryptocurrencies. Moreover, CHZ is down only 26% year-to-date compared with BTC and ETH losing 57% and 60%, respectively. Cryptocurrency performance (last 90 days). Source: blockchaincenter.netOn the daily chart, CHZ’s price reached $0.20 per piece on Aug. 29, and was looking to close the month in profit. Conversely, from a technical perspective, the Chiliz token stares at a potential 55% correction to $0.09 in September, based on the setup shown below.CHZ/USD three-day price chart. Source: TradingViewOriginally, the CHZ price rally started amid a rebound witnessed across the crypto market. But Its upside move picked momentum on a flurry of optimistic updates, including a partnership with crypto exchange Huobi Global and a nearly 25% acquisition of FC Barcelona’s Barça Studios.FC Barcelona announces the sale of 24.5% of Barça Studios to the company https://t.co/SkC8g62KY4 for 100 million euros to accelerate the club’s audiovisual, blockchain, NFT and Web.3 strategy.More details https://t.co/0sM9grct3L pic.twitter.com/5xcLWYg440— FC Barcelona (@FCBarcelona) August 1, 2022Chiliz also benefited from the hype around its back-to-back network updates as it attempts to do away with Ethereum and launch its own chain CHZ 2.0.Lido DAO (LDO)Lido DAO (LDO) has rallied around 60% in the last 90 days primarily due to the euphoria around “the Merge,” Ethereum’s long-awaited network transition from proof-of-work to proof-of-stake in September.Related: US dollar hits new 20-year high — 5 things to know in Bitcoin this weekLido DAO helps underfunded users to become stakers on Ethereum’s upcoming proof-of-stake chain. It does so by collecting users’ Ether funds into a pool of 32 ETH—as required by the Ethereum network—and depositing them into the Merge’s official smart contract.Ethereum 2.0 TVL staked by provider as of Aug. 28. Source: GlassnodeThe prospects of Lido DAO attracting more users in the days leading to and after the Merge have triggered buying in an otherwise bear market. But like Chiliz, LDO’s price risks plunging lower by 20% to $1.31 in September as shown in the setup below.CHZ/USD daily price chart. Source: TradingViewThe $1.31-target serves as the support in the consolidation area marked in red, given its historical performance.Quant Network (QNT)Quant Network (QNT) rose by more than 40% in the last 90 days, initially driven higher by a broader crypto market uptrend but picking momentum on speculations that their interoperable blockchain protocol would find adoption across governmental and regulatory bodies.⚔️ Group 2 — Financial Action Task Force (FATF) Quant CEO @GVerdian has worked diligently to keep Overledger in compliance with all existing and forthcoming regulations, including the FATF’s framework for VASPs (see image).☑️ Gilbert’s #FATF hashtag from 2019 says it all. ⬇️ https://t.co/0hvTDqAESh pic.twitter.com/F3Txe8rWPr— Greg Lunt (@GregLunt27) July 8, 2022

But from a technical perspective, QNT risks a 40% price decline from its current price level owing to the formation of a head-and-shoulders setup on its daily chart with a $57 target by September, as shown below.QNT/USD daily price chart. Source: TradingViewOther winnersEthereum Classic (ETC) has also surged by more than 40% in the last 90 days on hopes that it would offer a safe haven for Ethereum miners after the PoS upgrade.While Polygon (MATIC) has rallied by 27% in the same period, followed by Uniswap (UNI), which is up 13%.The views and opinions expressed here are solely those of the author and do not necessarily reflect the views of Cointelegraph.com. Every investment and trading move involves risk, you should conduct your own research when making a decision.

Čítaj viac

Získaj BONUS 8 € v Bitcoinoch

nakup bitcoin z karty

Registrácia Binance

Burza Binance

Aktuálne kurzy