Autor Cointelegraph By Yashu Gola

Cardano (ADA) eyes 15% rally despite Charles Hoskinson's fear over 'macro factors'

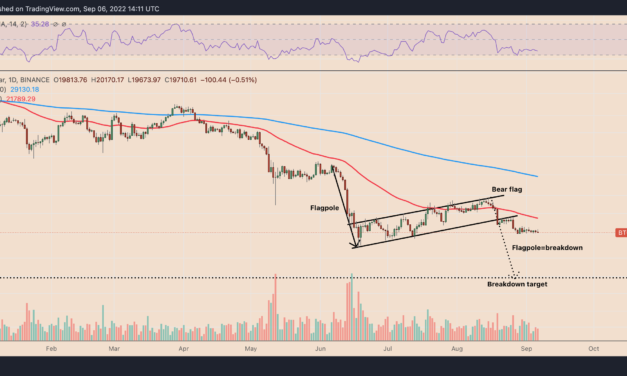
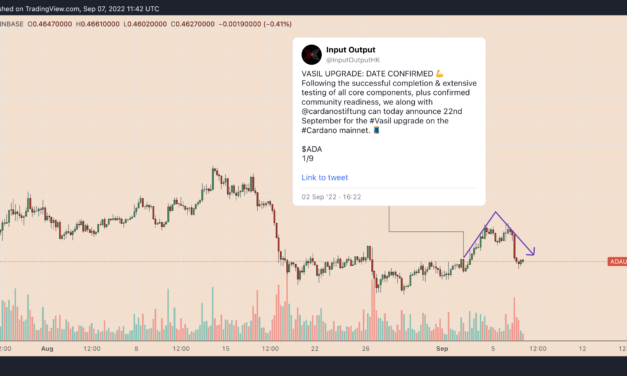
Cardano (ADA) will undergo a major network update called “Vasil” on Sept. 22, potentially making its blockchain more scalable and cheaper. Nonetheless, the news has failed to spark any decisive upside momentum in ADA’s market.Macro factors weigh on ADA’s best upside scenarioIn detail, ADA’s price has risen approximately 3.5% to $0.51 since the Vasil launch announcement, including a circa 14% rally followed by its near-perfect wipeout. In other words, traders initially bought the Vasil hype but were quick to exit markets, as illustrated by the price action below.ADA/USD four-hour price chart. Source: TradingViewCardano Founder Charles Hoskinson blamed “macro factors” for ADA’s underperformance despite the Vasil euphoria, noting that the crypto markets, on the whole, are “disconnected from reality.” He added:”Cardano has never been stronger and frankly many other projects are also solid across the industry, yet you don’t see that reflected — just a sea of red.”The statements appeared as riskier assets prepared for another deep plunge in the days leading up to the Federal Open Market Committee’s (FOMC) meeting on Sept. 20 through Sept. 21. Markets believe that the Federal Reserve officials will vote to increase benchmark interest rates by another 0.75% on Sept. 21. Overall, the U.S. central bank is looking to raise the rate to 3.75% to 4% by the end of 2022.Fed’s dot plot. Source: BloombergA high-rate environment could hurt Cardano and other top-cap crypto assets, given it will likely increase the appeal of cash-based instruments among investors.Is a “mini” Cardano rally ahead?From a technical perspective, Cardano looks ready to undergo a mini rally in the days leading up to the Vasil hard fork.On the four-hour chart, ADA’s price tests a support confluence for a potential rebound move. This confluence is made up of a multi-week ascending trendline and a support bar highlighted in the chart below.ADA/USD four-hour price chart. Source: TradingViewSuppose ADA rebounds from the confluence. Then, the ADA’s immediate upside target is around $0.50. This level is a meeting point of two resistance levels: a “multi-week descending trendline” and a “mid-level target” that has served as a price ceiling since mid-August.Meanwhile, a break above $0.50 could have ADA bulls test $0.53 as their primary upside target, a level with a significant history as resistance. In other words, ADA could print a 15% gain ahead of the Vasil hard fork when compared to its today’s price.Related: Cardano outranks Bitcoin in global top intimate brands in new reportHowever, ADA looks weaker on its longer-timeframe charts, with its three-day performance revealing the presence of a bearish continuation pattern dubbed a “descending triangle.”ADA/USD three-day price chart. Source: TradingViewADA risks dropping to $0.26 if it decisively breaks below its descending triangle’s lower trendline, as per rules of technical analysis. In other words, a nearly 40% price decline from current prices.The views and opinions expressed here are solely those of the author and do not necessarily reflect the views of Cointelegraph.com. Every investment and trading move involves risk, you should conduct your own research when making a decision.

Čítaj viac

Bitcoin 'bear flag' breakdown targets $15K as US dollar hits 20-year high

On Sept. 6, Bitcoin (BTC) price crumbled below $20,000 and the asset looks ready to undergo further decline in September due to a strong U.S. dollar and an ominous technical analysis pattern.Bitcoin eyes $15,000 nextFrom a technical perspective, Bitcoin risks dropping to $15,000 or below in the coming weeks after breaking out of its prevailing “bear flag” pattern.For the unversed, bear flags form when the price consolidates higher inside a parallel, ascending range after a strong downtrend. They typically resolve after the price breaks below the lower trendline and falls by as much as the previous downtrend’s length.BTC/USD daily price chart featuring ‘bull flag’ pattern. Source: TradingViewBitcoin has entered the so-called breakdown stage of its bear flag pattern, with its downside target lurking south of $15,000, as illustrated in the chart above.Cash is kingThe prospects of a weaker Bitcoin heading further into 2022 are growing mainly because of a worsening economic backdrop.Bitcoin’s 60% year-to-date price decline is one of the unfortunate consequences of the Federal Reserve’s hawkish policy to bring inflation down to 2% from its current 8.5% level. In detail, the U.S. central bank has raised its benchmark rates to the 2.25% – 2.5% range via four consecutive hikes in 2022.The hikes have boosted the appetite for cash-based securities over riskier assets like Bitcoin. For instance, U.S. banks with savings accounts offer clients an annual percentage yield of 2% or more from around 0.5% at the start of this year, BankRate.com data shows.Meanwhile, a Goldman Sachs analysis shows that mutual funds with $2.7 trillion in equity under management have increased their cash holdings by $208 billion in the first half of 2022, the fastest allocation rate to date.Mutual funds asset rotations noted in HY1/2022. Source: Goldman SachsThe broader demand for cash has helped the U.S. dollar index, which measures the greenback’s strength against a pool of top foreign currencies, climb to 110.55 on Sept. 6, its highest level since 2002.DXY daily price chart. Source: TradingViewAs a result, cash has drastically outperformed stocks, Bitcoin, Ethereum, copper, lumber and other assets in 2022. Related: A range-break from Bitcoin could trigger buying in ADA, ATOM, FIL and EOS this weekThis trend may continue, given that the Federal Reserve plans to continue its rate-hiking spree, according to Jerome Powell’s statements at the recent Jackson Hole symposium.The views and opinions expressed here are solely those of the author and do not necessarily reflect the views of Cointelegraph.com. Every investment and trading move involves risk, you should conduct your own research when making a decision.

Čítaj viac

Ethereum Classic books 12% rally as mining support for ETC gains pace

Ethereum Classic (ETC) price rallied on Sept. 5 on back-to-back positive reports concerning its adoption among crypto miners.Top mining pool supports Ethereum ClassicOn the daily chart, ETC’s price surged 14.5% to nearly $37.25 per token. Its massive gains came days after BTC.com, a blockchain explorer and crypto mining pool, launched a specialized Ethereum Classic pool with “zero-fee” mining for three months.ETC/USD daily price chart. Source: TradingViewThe announcement appeared after “the Merge,” a long-awaited network update that would switch Ethereum’s energy-intensive proof-of-work (PoW) protocol to a “cost-efficient” and scalable alternative, the proof-of-stake (PoS), on Sept. 19 or before.But the switch to PoS will make Ethereum’s PoW miners futile. On the other hand, Ethereum Classic, the original version of Ethereum, which still uses PoW, could become a haven for the miners affected by the Merge.The network is already attracting PoW miners en masse, confirmed by its hashrate, which touched a record high of 41.81 Terrahash per second (TH/s) on Sept. 4. For the unversed, hashrate is the total computational power used to mine and process transactions on a PoW blockchain.Ethereum Classic hashrate. Source: CoinWarzThis migration has helped ETC rally incredibly in recent months; it is up 200% since mid June.ETC price could rise another 60%From a technical perspective, Ethereum Classic looks ready to undergo a circa 60% price rally in September.Notably, ETC’s price has formed a “bull flag” in recent weeks. Bull flags appear when the price consolidates lower after a strong uptrend. Meanwhile, they resolve after the price breaks out in the direction of its previous trend and are thus considered bullish continuation patterns.As of Sept. 5, ETC tested its bull flag’s upper trendline for a potential breakout move. Suppose the token does it. Then, its likelihood of rising further will be higher. Also, as a rule of technical analysis, the price could rise by as much as the previous uptrend’s length, as shown below.ETC/USD daily price chart featuring ‘bull flag’ breakout setup. Source: TradingViewIn other words, the ETC bull flag’s profit target comes to be at around $58.50, up almost 60% from Sept. 5’s price.Related: ETH Merge: CoinGecko co-founder shares strategy for forked tokensConversely, a decisive break below the bull flag’s lower trendline risks invalidating the upside setup explained above.The views and opinions expressed here are solely those of the author and do not necessarily reflect the views of Cointelegraph.com. Every investment and trading move involves risk, you should conduct your own research when making a decision.

Čítaj viac

Surge or purge? Why the Merge may not save Ethereum price from 'Septembear'

Ethereum’s native token, Ether (ETH), is not immune to downside risk in September after rallying approximately 90% from its bottom of around $880 in June. Much of the token’s upside move is attributed to the Merge, a technical upgrade that would make Ethereum a proof-of-stake (PoS) protocol, slated for Sep. 15.But despite logging impressive gains between June and September, Ether still trades almost 70% below its record high of around $4,950 from November 2021. Therefore, its possibility of heading lower remains on the cards.ETH/USD weekly price chart. Source: TradingViewHere are three Ethereum bearish market indicators that show why more downside is likely. Sell the Ethereum Merge newsEthereum options traders anticipate Ether’s price to reach $2,200 from its current $1,540 level ahead of the Merge, according to Deribit data compiled by Glassnode. Some even see the price hitting $5,000, but enthusiasm looks flat post the PoS switch.There appears to be demand for downside protection among traders after the Merge, indicated by a so-called “options implied volatility smile” metric (OIVS).OIVS illustrates the options’ implied volatilities with different strikes for the specific expiration date. So, contracts out of capital typically show higher implied volatility, and vice versa.For instance, in the Ethereum’s Sept. 30 options expiry chart below, the smile’s steepness and shape help traders assess the relative expensiveness of options and gauge what kind of tail risks the market is pricing in.Ethereum OIVS for the contract expiring on Sept. 30, 2022. Source: GlassnodeThus, it shows a large buy-side demand for ETH call options expiring in September, indicated by the volatility smile’s upward slope, showing traders are willing to pay a premium for a long exposure.“Post Merge, the left tail is pricing in significantly higher implied volatility, indicating traders are paying a premium for ‘sell-the-news’ put-option protection post-Merge,” Glassnode analysts wrote, citing the OIVS chart below that also features Call and Put open interests at different strike rates.Ethereum OIVS for the contract expiring on Oct. 28, 2022. Source: GlassnodeIn other words, ETH traders are hedging their bets in case of a sell-the-news event. Hawkish Federal ReserveMore downside cues from Ethereum come from its exposure to macroeconomic events, mainly quantitative tightening by the Federal Reserve.Last week, Fed Chairman Jerome Powell reiterated the central bank’s commitment to curbing inflation, noting they “must keep at it until the job is done.” In other words, Powell and his associates would likely raise interest rates by 0.5%-0.75% in their next policy meeting in September.Rate hikes have recently been bad news for the ETH/USD pair, given the growing positive correlation between a broader crypto sector and traditional risk-on indices against the prospects of declining cash liquidity. For instance, the daily correlation coefficient between ETH and Nasdaq as of Sep. 3 was 0.85.ETH/USD and Nasdaq daily correlation coefficient. Source: TradingViewTherefore, the possibility of Ether declining alongside riskier assets is high, particularly if the Fed hikes by 0.75%.That giant Ether “bear flag”From a technical perspective, Ether is painting what appears like a bear flag on its weekly chart.Bear flags appear when the price consolidates higher inside an ascending parallel channel after a strong move downward. They resolve after the price breaks out of the channel to the downside and, as a rule of technical analysis, falls by as much as the previous downtrend’s length (flagpole).Ether tested the bear flag’s lower trendline as support this week. From here, the Ethereum token could either rebound to retest the flag’s upper trendline (~$2,500) as resistance or break below the lower trendline to continue its prevailing bearish trend.Related: ETH price outlook for The Merge: Bullish or bearish? | TheChartGuys interviewGiven the factors discussed above, the ETH/USD pair risks entering the bear flag breakdown stage in September, as illustrated in the chart below.ETH/USD weekly price chart featuring ‘bear flag’ setup. Source: TradingViewTherefore, ETH’s bear flag profit target comes to be near $540 in 2022, down approximately 65% from today’s price.The views and opinions expressed here are solely those of the author and do not necessarily reflect the views of Cointelegraph.com. Every investment and trading move involves risk, you should conduct your own research when making a decision.

Čítaj viac

CEL climbs 50% as Celsius Network aims to return $50M to clients

The price of CEL soared by nearly 50% as traders assessed its parent firm Celsius Network’s inclination to return a portion of the locked funds to its customers.No CEL-ling pressure for nowOn the daily chart, CEL surged to its intraday high of $1.67 per token on Sep. 2 after lows of $1.15 the day before. However, the token’s sharp rally accompanied lower trading volumes, suggesting a lack of conviction among traders about further upside moves.CEL/USD daily price chart. Source: TradingViewCEL’s gains appeared after Celsius Network filed a motion with the Bankruptcy Court, requesting that its clients with “certain Custody and Withhold accounts should be able to withdraw the amount of digital assets owed to them.”Celsius pulled itself up by taking cryptocurrencies from its clients and offering them mouth-watering returns by deploying their deposits in the broader crypto lending market. But the market downturn this year created a $2.85 billion hole in Celsius’s balance sheet, prompting the firm to freeze its clients’ accounts, thus trapping billions of dollars of more than a million accounts. In July, Celsius filed for Chapter 11 bankruptcy.CEL price at risk of 40% dropCelsius Network’s willingness to return a portion of Custody funds to clients is a welcoming move. However, the amount offered is little compared to what the firm holds, as BnkToTheFuture CEO Simon Dixon points out.#Celsius currently stating that those that were moved to custody 90 days before filing should be withheld. Custody is now $210m & they want to release $50m. They want to reserve the rest for clawbacks. They believe all earn funds belong to #Celsius OPINION This is illegal bank https://t.co/efGb3XPU2b— Simon Dixon (Beware Impersonators) (@SimonDixonTwitt) September 1, 2022Meanwhile, Celsius’s interest-bearing accounts, called “Earn accounts, had about $4.2 billion worth of crypto assets as of July 10, according the court documents. In other words, CEL’s 50% price rally now looks overextended with negative fundamentals still hanging over the Celsius market. Related: Celsius bankruptcy proceedings show complexities amid declining hope of recoveryFrom a technical perspective, CEL is also at risk of a sharp price correction in September.On the four-hour chart, the Celsius token has been painting a “rising wedge” since late August. This classic pattern typically leads to a bearish price reversal move, as illustrated in the chart below.CEL/USD four-hour price chart featuring rising wedge breakdown setup. Source: TradingViewCEL now tests the wedge’s upper trendline for a pullback toward the lower trendline. The latter trendline is near $1.34, a level that has served as reliable support in recent trading history. Therefore, breaking below $1.34 could intensify the selling pressure. CEL falling below $1.34 opens the door for a rising wedge breakdown setup. CEL’s downside target, as a rule of technical analysis, would be as low as the maximum distance between the wedge’s upper and lower trendline when measured from the breakout point.In other words, CEL could fall to $0.87 by September end, down 40% from today’s price.The views and opinions expressed here are solely those of the author and do not necessarily reflect the views of Cointelegraph.com. Every investment and trading move involves risk, you should conduct your own research when making a decision.

Čítaj viac

Získaj BONUS 8 € v Bitcoinoch

nakup bitcoin z karty

Registrácia Binance

Burza Binance

Aktuálne kurzy