What happens to Bitcoin if the Nasdaq falls further?
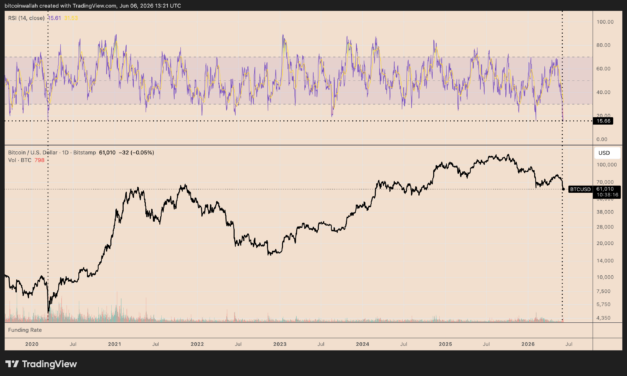
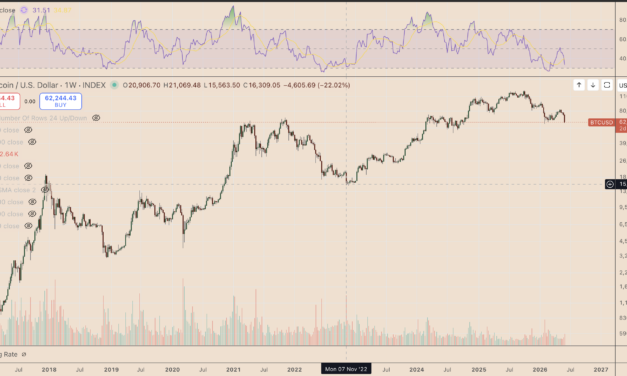
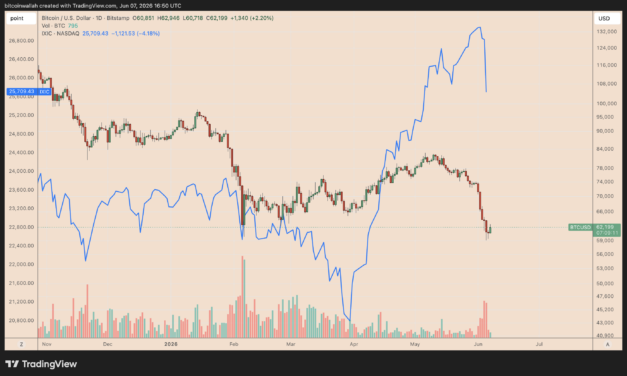
Bitcoin (BTC) traders said that BTC holding above the $60,000 psychological support over the weekend was important as it recovered 6.5% from a local low near $59,100 to an intraday high of around $62,950 on Sunday.Key takeaways:BTC is eyeing a rally toward $92,630 if it continues to hold above a key moving-average support.Nasdaq technicals hint at a potential decline of over 10% in the short term. BTC may rise above $90,000 if Nasdaq underperforms Bitcoin’s rebound stood out as the tech-heavy Nasdaq Composite (IXIC) plunged more than 4% on Friday, its steepest one-day drop since April 2025. This has raised hopes that risk capital may return to BTC markets.BTC/USD vs. IXIC daily performance chart. Source: TradingViewTechnical commentary shared by veteran analyst Filbfilb offered some hope for the Bitcoin bulls. In a Sunday post, the analyst highlighted Bitcoin holding strong above its 200-week simple moving average (200-week SMA, the blue line) at around $61,880. This level has helped form the bottom in 2020, 2018, and 2015.BTC/USD weekly chart. Source: TradingViewIn other words, traders may view the dip below $60,000 as a shakeout if BTC holds the 200-week SMA, with the 50-week SMA (red) near $92,630 becoming the next major upside target.At the same time, the Nasdaq appears to be correcting toward its 20-week SMA, the green line near 22,905 points, after its weekly relative strength index (RSI) fell to 62.46 from around 74.75.Every major Nasdaq weekly RSI drop from above 70 (overbought) to below 70 since 2021 has led the index back toward its 20-week moving average.IXIC weekly chart. Source: TradingViewThe Nasdaq could fall toward 22,905 if the fractal repeats, implying a further decline of about 10.75% from current levels in June or by July.That said, Bitcoin could be setting up for a sharp mean-reversion rebound if it holds its long-term floor while the Nasdaq continues to cool off.Bitcoin-Nasdaq ratio supports BTC rebound scenarioBitcoin’s ratio against the Nasdaq has again reached a record oversold zone, according to its daily RSI readings.Related: Bitcoin most oversold since 2020 crash: Can BTC rebound to $70K next?On Saturday, the RSI dropped to 14.70, the lowest in history. The previous record was 14.88, set in February, ahead of a 30%-plus recovery in BTC prices.BTC/IXIC vs. BTC/USD daily chart. Source: TradingViewIn simple terms, Bitcoin had become too cheap relative to the Nasdaq, and buyers stepped in. The same setup is appearing again, reiterating a potential rebound in BTC prices in the coming weeks.
Čítaj viac