Autor Cointelegraph By Yashu Gola

The floppening? Ethereum price weakens post-Merge, risking 55% drop against Bitcoin

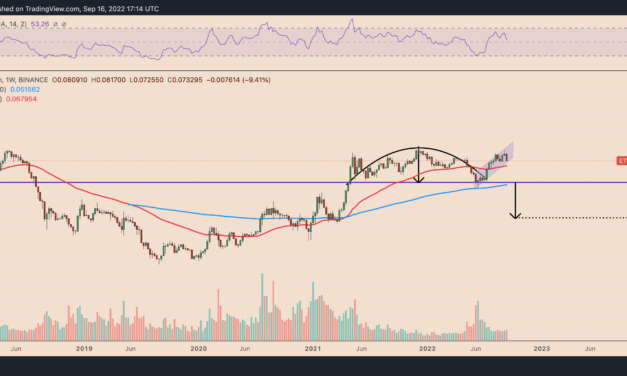
Ethereum’s native token Ether (ETH) has been forming an inverse-cup-and-handle pattern since May 2021 on the weekly chart, which hints at a potential decline against Bitcoin (BTC). ETH/BTC weekly price chart featuring inverse cup-and-handle breakdown setup. Source: TradingViewAn inverse cup-and-handle is a bearish reversal pattern, accompanied by lower trading volume. It typically resolves after the price breaks below its support level, followed by a fall toward the level at a length equal to the maximum height between the cup’s peak and the support line.Applying the theoretical definition on ETH/BTC’s weekly chart presents 0.03 BTC as its next downside target, down around 55% from Sept. 16’s price.Can ETH/BTC pull a Dow Jones?Alternatively, the ETH/BTC pair could nevertheless deliver some large gains in the years to come. On the weekly log chart, the ETH/BTC pair is painting a potential cup-and-handle since January 2018. In other words, a rally toward 0.5 BTC in 2023 is on the table, up more than 520% from current price levels.Unlike its inverse counterpart mentioned above, cup-and-handles are bullish reversal patterns with their upside targets located at levels equal to their maximum height when measured from their breakout point. Veteran analyst Tom Bulkowski notes that these patterns have a 61% success rate of meeting their upside targets.For instance, the cup-and-handle pattern that formed on the Dow Jones chart during the Great Depression of the 1930s and 1940s — wherein the cup took nine years to develop and the handle another four years — reached its upside target in the 1950s, as shown below.Dow Jones Industrial Average cup-and-handle pattern. Source: StockCharts.comPotentially, ETH/BTC could now be in the handle stage of a similar cup-and-handle pattern, as shown via the shaded purple descending channel area in the chart below.ETH/BTC weekly price chart featuring cup-and-handle breakout setup. Source: TradingViewThe pair awaits a breakout move above the pattern’s resistance level of 0.08 BTC. For now, it has been fluctuating lower inside the handle range, eyeing a pullback toward its lower trendline at around 0.05 BTC after testing the upper one as resistance this week.Flippening or floppening?Ethereum’s potential to overtake Bitcoin by market capitalization has been commonly dubbed as “the flippening.”Ethereum is competing with Bitcoin to become the so-called “inflation hedge,” according to Joshua Lim, head of derivatives at Genesis Trading. Lim cited Ethereum’s EIP-1559 update from August 2021 that introduced a fee-burning mechanism into its protocol. Related: Academic research claims ETH is a ‘superior’ store of value to BitcoinAccording to Ultrasound.Money, Ether’s supply growth now stands at minus 1.43% per year. In other words, the token could be becoming “disinflationary” with time. Lim argues that it makes Ether an attractive alternative to Bitcoin among institutional investors.12/ can BTC remain king going fwd? only time will tell if the ETH narrative post-Merge is strong enough to overthrow the status quoin the meantime, expect BTC to continue to trade like a funding asset and preferred hedging instrument for the entire asset class— Joshua Lim (@joshua_j_lim) August 29, 2022But many argue against the flippening narrative, including Rahul Singh, the co-founder of Defi platform FINtokens. He told Cointelegraph Bitcoin would continue existing as a “digital gold” while Ethereum would become an “Internet 2.0” project.Never Ever…B’coz#Bitcoin in Digital Gold&#Ethereum is Internet 2.0So,There’s a lot of difference between Digital Asset Values, &Digital Soft. Values— AskToRahulSingh©️ (@AskToRahulSingh) July 13, 2022

As of September 2022, Ether’s market cap is $175 billion compared to Bitcoin’s $372 billion.The views and opinions expressed here are solely those of the author and do not necessarily reflect the views of Cointelegraph.com. Every investment and trading move involves risk, you should conduct your own research when making a decision.

Čítaj viac

Does Ethereum's new ETHPoW fork stand a chance? ETHW price falls 65% post-Merge

ETHPoW, a separatist Proof-of-Work (PoW) blockchain forked from Ethereum’s Merge, went live on Sep. 15. However, the chain suffered technical issues after the launch, which put downward pressure on its ETHW token. ETHW price down 65% amid “ChainID” fiascoThe price of ETHW has dropped by 65% since ETHPoW’s launch to around $14 on Sep. 16, according to CoinMarketCap. At its lowest, the token was changing hands for $9.50.ETHW price performance in the past seven days. Source: CoinMarketCapThe losses coincided with a technical issues related to ETHPoW’s ChainID.” ChainIDs are identifiers that help users identify one blockchain from another. Thus, ETHPoW required a new ChainID to separate its transaction data from the original Ethereum blockchain after the Merge, otherwise, it risked creating duplicate transactions.Lol EthPow miners set to wrong chainID, so they’re mining testnet https://t.co/IichaPURjr— David Trrrrrrr (@daveytea) September 15, 2022The team behind ETHPoW announced on Sep. 15 that its unique ChainID is 10001. However, data from Chainlist shows that a cryptocurrency project called Smart Bitcoin Cash, operating under the ticker BCHT, had the same ID. This issue resulted in errors on the Metamask cryptocurrency wallet.The ETHPoW recognized the issue and adjusted the ChainID later on Sep. 15. However, several miners appeared to have pulled out despite a few major pools continuing to mine the PoW chain.Notably, the ETHPoW hash rate fell to 66.64 TH/s on Sep. 16 after peaking at 80.56 TH/s earlier in the day. ETHPoW hashrate as of Sep. 16, 2022. Source: 2miners.comIn comparison, the hash rate of Ethereum Classic (ETC), another PoW alternative for Ethereum miners, was 234.56 TH/s on Sep. 16 versus its peak near 310.5 TH/s the day before.ETHW listed on some exchanges despite concernsEric Wall, the chief investment officer at cryptocurrency investment firm Arcane Assets, noted that ETHPoW miners could not sustain the chain at current ETHW prices. He explained:The daily rewards are 13100 ETH, $354k instead of $20m. There is no way miners can just ‘keep mining’ the ETHPoW chain, no matter how you adjust the difficulty. There simply aren’t enough rewards in the system to pay for the electricity bills.Related: Dogecoin becomes second largest PoW cryptocurrencyNevertheless, ETHW was listed at some leading cryptocurrency exchanges, including FTX and Huobi. In addition, BitTrue has also introduced an ETHW-based liquidity staking service that offers depositors a 6% annual return.The views and opinions expressed here are solely those of the author and do not necessarily reflect the views of Cointelegraph.com. Every investment and trading move involves risk, you should conduct your own research when making a decision.

Čítaj viac

Ethereum traders shorted ETH price in record numbers during the Merge — 50% crash ahead?

Ethereum successfully completed its long-awaited transition to proof-of-stake via “the Merge” on Sep. 15, while traders have been increasingly shorting Ether (ETH) in anticipation of a sell-the-news event.  Ethereum funding rate plummeEther’s futures funding rates across leading derivatives platforms dropped below zero—to their worst levels to date—before the Merge. The rate dropped to as low as -0.6% on BitMex. ETH funding rates history. Source: CoinglassFunding rates are a percentage of the fee paid to either short or long position holders. The platform decides the fee based on the difference between the perpetual futures contract and the spot price.Therefore, traders consider a market bullish when the funding rate is positive. Conversely, a negative funding rate hints at a bearish sentiment in the market. Let’s understand why with an example.Currently, Ether’s funding rate average is around -0.1%. In other words, traders with a $1 million short ETH position are willing to pay those with long positions $1,000 every eight hours (based on when platforms recalculate the funding rates).That shows traders’ conviction in a potential spot Ether price drop after the Merge. However, a consistently negative funding rate also increases the possibility of a short squeeze. A short squeeze occurs when an asset moves higher and short traders decide to cover their position or get forced to do so via margin calls, thus adding more upside strength to the asset’s price.ETH price technicals hints at 50% breakdownFrom a technical perspective, Ether’s price risks dropping by 50% in the coming weeks due to the formation of a symmetrical triangle on its longer-timeframe chart. Notably, symmetrical triangles are trend continuation patterns, i.e., they typically prompt the price to continue in the direction of their previous trend after a consolidation period. So, Ether’s symmetrical triangle pattern appears bearish, particularly as it has formed after the token’s 80% decline from its November 2021 highs.ETH/USD three-day price chart featuring ‘symmetrical triangle’ setup. Source: TradingViewTheoretically, a bearish symmetrical triangle’s downside target is calculated after subtracting the triangle’s maximum height from the breakdown point. That puts ETH’s profit target in 2022 around $850.Capital rotation into BitcoinIn addition to negative funding rates and the symmetrical triangle setup, Ether also faces downside risks from a renewed buying interest in Bitcoin (BTC), the leading cryptocurrency by market capitalization.On the daily chart, ETH/BTC dropped to 0.078 BTC on Sep. 15, almost a week after topping out at 0.085 BTC. The pair’s correction came after a strong bull cycle, wherein its price rose by more than 75% in less than three months.ETH/BTC daily price chart. Source: TradingView”ETH’s underperformance ahead of the merge indicates that some traders attempt to front run a potential “sell-the-news” event,” noted Arcane Research in its weekly report, albeit adding:”Whether or not the merge will turn out to be a ‘sell-the-news’ event remains to be seen.”In another weekly report, investment management firm CoinShares reported a substantial decline in the capital of Bitcoin and Ethereum-based investment products. Related: Analyst on $17.6K BTC price bottom: Bitcoin ‘not there yet’However, Ether funds witnessed withdrawals worth $61.6 million in the week ending Sep. 9 compared to Bitcoin’s $13 million.More sell-the-news cues come from a recent rise in Ethereum’s balance across all crypto exchanges. Notably, the Exchange inflow volume reached a one-month high of 22,723.289 ETH (7-day MA). Ethereum balance on exchanges. Source: GlassnodeTraders typically increase their cryptocurrency deposits on exchanges when they want to sell their holdings. In other words, a rising ETH balance on exchanges increases downside risks.The views and opinions expressed here are solely those of the author and do not necessarily reflect the views of Cointelegraph.com. Every investment and trading move involves risk, you should conduct your own research when making a decision.

Čítaj viac

Selling the rumor? Biggest Ethereum Merge staker Lido DAO loses 40% in 30 days

Lido DAO (LDO) has declined by more than 40% in the last 30 days with more room to fall in the coming days amid a potential sell-the-news event, i.e. the Merge.Lido DAO Ether deposits surge 160% in 2022Lido DAO is Ethereum’s biggest staking service, having deposited over 4.14 million of the blockchain’s native asset, Ether (ETH), into the Ethereum 2.0 smart contract on behalf of its users, according to the latest data.ETH 2.0 total value staked by provider. Source: GlassnodeIn comparison, Lido DAO’s total staked amount was around 1.6 million ETH at the beginning of this year. The boom reflects a growing demand for Lido DAO services ahead of Ethereum’s scheduled transition from proof-of-work to proof-of-stake via the Merge on Sep. 15.LDO, a governance token in the Lido DAO ecosystem, has also undergone an unprecedented price rally in recent months, up more than 350% after bottoming out at $0.39 in June. Still, the token’s sharp correction in the past month raises the possibility of an extended downtrend now that the pre-Merge hype is nearing its end. In addition, a technical setup also alerts about a potential price decline ahe.LDO hints at descending triangle reversalThe latest selling period in the Lido DAO market started after LDO topped at $3.10 on Aug. 13. This downtrend has painted a pattern that appears to be a descending triangle.Descending triangles that form at the top  suggest bullish exhaustion. Theoretically, a descending triangle breakdown below the lower trendline—could crash the price to the level at length equal to the maximum triangle height.Related: Will the Ethereum Merge crash or revive the crypto market? | Find out now on The Market ReportLDO now tests the triangle’s lower trendline area (~$1.79-$1.82) as support. The token could drop toward $1.17 if it breaks below the support level while accompanying a rise in trading volumes. In other words, a 35% drop from current price levels.LDO/USD daily price chart featuring descending triangle breakdown setup. Source: TradingViewConversely, a rebound from the $1.79-182 support area could have LDO test the descending triangle’s upper trendline at around $2.10 as resistance. Also, a decisive breakout above the upper trendline would risk invalidating the bearish setup discussed above.The views and opinions expressed here are solely those of the author and do not necessarily reflect the views of Cointelegraph.com. Every investment and trading move involves risk, you should conduct your own research when making a decision.

Čítaj viac

3 reasons SOL price is up 30% in two weeks — Will Solana's uptrend continue?

Solana (SOL) ticked higher on Sept. 13, mirroring similar upside moves in the broader cryptocurrency market, led by Bitcoin (BTC) and Ether (ETH).On the daily chart, SOL’s price gained over 4% to $39, its best level in 3 weeks. The token’s intraday gains came as an extension of a prevailing uptrend that has seen its price gaining 30% in just 2 weeks.SOL/USD daily price chart. Source: TradingViewIn comparison to Solana, Bitcoin and Ether underperformed, securing 16% and 22% gains in the same period. Let’s look at the mix of fundamental and technicals that may have prompted SOL to rally higher.Helium’s merge with SolanaOn Aug. 30, core developers behind the Helium Network, which offers decentralized wireless 5G network coverage by enabling users to become hotspots, announced a governance proposal to migrate to the Solana blockchain from its native chain. The Helium developers cited their “need to improve operational efficiency and scalability” while seeing Solana as an ideal fit.SOL is the staking and transaction payment token inside the Solana ecosystem.SOL/USD weekly price chart. Source: TradingViewNFT boomThe latest buying period in the Solana market has also coincided with upticks in its nonfungible token (NFT) metrics.Notably, volume across NFT marketplaces like OpenSea, Metaplex and Magic Eden reached nearly 1.2 million SOL (~$42.8 million) in the week ending Sept. 11, data tracked by Nansen shows. That further accompanied a rise in NFT transactions, hitting a record high of over 1 million in the same period.Solana NFT volume per week presented without comment pic.twitter.com/QaPanxpOkv— Nansen Intern (@nansen_intern) September 12, 2022The jump in Solana’s activity appeared as a unique bright spot in the NFT sector that’s otherwise seeing lower demand in recent months. For instance, the trading volume at the leading NFT marketplace OpenSea has seen a drastic decline.Of all Solana NFT collections, the newly-launched “y00ts mint t00b” collection recently secured the most trading volume, with HyperSpace tallying the average figure at around $18.45 million per day.SOL’s technical bounceFrom a technical perspective, SOL’s 30% rally started after testing a historically significant support level.SOL/USD has been consolidating sideways inside a range defined by two flat, parallel trendlines since May 23. A drop toward the lower trendline (support) has been typically followed by a 58%–60% bounce toward the upper trendline (resistance).Related: Network outages have been Solana’s ‘curse,’ says co-founderSimilarly, a pullback from the upper trendline has seen SOL’s price crashing toward the lower trendline, as shown below.SOL/USD weekly price chart. Source: TradingViewWith SOL rebounding, its path of least resistance appears to be toward the upper trendline near $47.50, up around 38% from current price levels.The views and opinions expressed here are solely those of the author and do not necessarily reflect the views of Cointelegraph.com. Every investment and trading move involves risk, you should conduct your own research when making a decision.

Čítaj viac

Získaj BONUS 8 € v Bitcoinoch

nakup bitcoin z karty

Registrácia Binance

Burza Binance

Aktuálne kurzy