Autor Cointelegraph By Yashu Gola

Bitcoin analysts give three reasons why BTC price below $20K may be a 'bear trap'

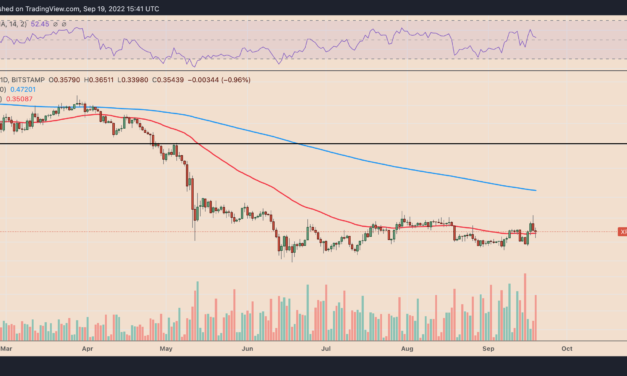
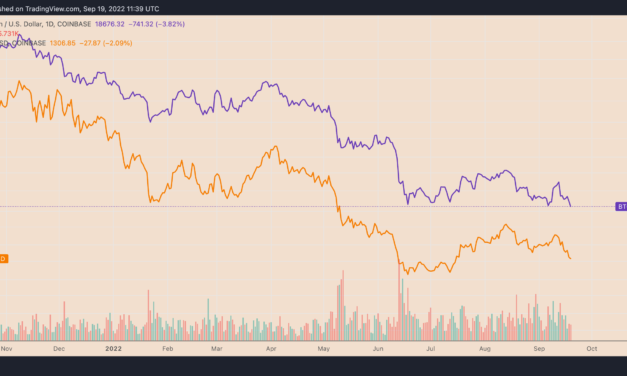
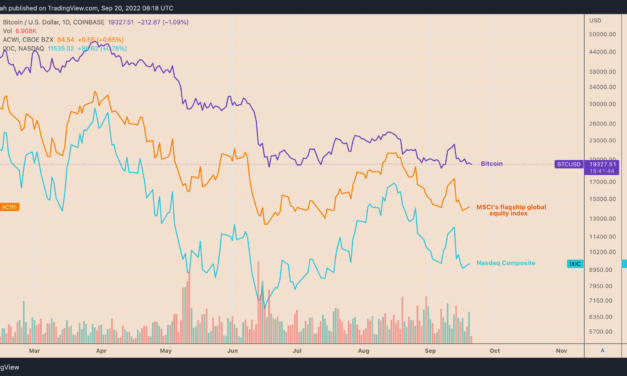
Bitcoin (BTC) recovered above the $19,000 mark on Sep. 20, a day after falling to its lowest level in three months.Bitcoin struggles after dropping below $20KOn the daily chart, the BTC price rose from $18,255 to $19,650. This 7.5% price rebound mirrored similar rebound moves witnessed in the stock market, suggesting that investors have been coming to terms with another significant rate hike by the Federal Reserve expected on Sep. 20-21.BTC/USD daily price chart versus ACWI and Nasdaq. Source: TradingViewHowever, opinions differ on the longevity of Bitcoin’s rebound. Independent market analyst Jonny Moe stressed that BTC’s ongoing price action is similar to its sideways consolidation moves at the beginning of this year.In other words, Bitcoin’s current price rebounds around the $20,000 mark do not make a long-term bull case.This is definitely still lurking out there $BTC pic.twitter.com/UkJ4s312zS— Jonny Moe (@JonnyMoeTrades) September 19, 2022Rudy Takala, former Fox News executive and opinion editor at Cointelegraph, also warns crypto traders to prepare for more “dark times” due to worsening economic conditions globally.On the other hand, some analysts believe Bitcoin is staring at a strong bullish reversal in the times ahead. Let’s take a closer look at the three optimistic market outlooks.  Bitcoin prints “bullish hammer”Bitcoin’s Sep. 20 candlestick is a bullish hammer, which suggests weakening downside momentum, according to pseudonymous analyst Trader Tardigrade.A bullish hammer candlestick forms when the asset drops significantly lower from its opening value but recovers to close near the same level. Traders see the hammer as a sign of bearish rejection, given its history of preceding market bottoms. Trader Tardigrade applies the same theory to Bitcoin’s recovery move on Sep. 20, noting that its bullish hammer may usher in a reversal.#Bitcoin updates:On daily chart, a “BULLISH HAMMER” candle was printed, which may bring us a reversal.BULLISH Characteristics:❇️ Long lower wick❇️ White candle❇️ Low below previous swing lowThis indicates a strong price rejection below the candle.#BTC #Cryptos pic.twitter.com/8TkfoegZrb— Trader Tardigrade (@TATrader_Alan) September 20, 2022

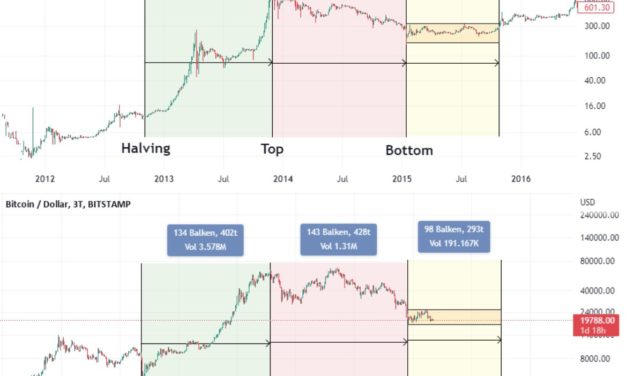
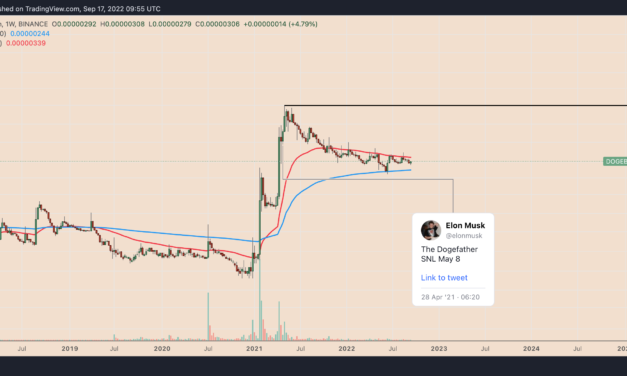
Pi-Cycle bottomAnother technical signal that anticipates Bitcoin to rebound sharply is the Pi-Cycle bottom.Specifically, the open-source indicator tracks two long-term simple moving averages (SMA): the 471-day SMA and the 150-day EMA. History shows that Bitcoin price bottoms out for the market cycle when the 150-day SMA crossed below the 471-day SMA.Meanwhile, the price heads for a strong bullish reversal in the days leading up to and after the 150-day SMA closes above the 471-day SMA. Pseudonymous analyst, Titan of Crypto, highlighted that Bitcoin is eyeing a 150-471 SMA bullish crossover sometime by 2023.BTC/USD weekly price chart featuring Pi-Cycle Bottom. Source: TradingView/Titan of Crypto”1st cross occurred in July,” he noted, adding: “2nd cross is yet to occur. Reversal might be closer than we think.”Wyckoff CycleAurelien Ohayon, the CEO of investment strategy firm XOR Strategy, anticipates Bitcoin to reach $45,000 by early 2023, arguing that BTC price has been following the popular Wyckoff Cycle pattern.Related: ‘FED sledgehammer’ will further batter BTC, ETH prices — Bloomberg analystA Wyckoff Cycle has four phases: accumulation, markup, distribution and markdown. After the markdown phase, the cycle repeats with the accumulation phase, which, as Ohayon points out, is the case with Bitcoin’s ongoing price rebound.BTC/USD illustrated in the Wyckoff Cycle phases. Source: XorStrategy.com”Bitcoin is entering the Final Bullish Phase of the Wyckoff Cycle,” the analyst concludes.The views and opinions expressed here are solely those of the author and do not necessarily reflect the views of Cointelegraph.com. Every investment and trading move involves risk, you should conduct your own research when making a decision.

Čítaj viac

XRP price risks 30% decline despite Ripple's legal win prospects

XRP pricewas wobbling between profits and losses on Sep. 19 despite hopes that Ripple would eventually win its long-running legal battle against the U.S. Securities and Exchange Commission (SEC).Ripple and the SEC both agreed to expedite the lawsuit on Friday to get an answer on whether $XRP is a security or not.From the updates of the case, it sounds like it’s in the favor of @Ripple pic.twitter.com/SAyl4VLxdM— Jeff Sekinger (@JeffSekinger) September 19, 2022Fed spoils SEC vs. Ripple euphoriaThe XRP/USD pair dropped by over 1% to $0.35 while forming extremely sharp bullish and bearish wicks on its Sep. 19 daily candlestick. In other words, its intraday performance hinted at a growing bias conflict among traders.XRP/USD daily price chart. Source: TradingViewThe indecisiveness could be due to XRP’s exposure to catalysts other than the SEC vs. Ripple lawsuit. Namely, the Federal Reserve’s potential to increase its benchmark interest rates by another 75 or 100 basis points in their policy meeting on Sep. 20.As Cointelegraph reported, fears of aggressive rate hikes have pressured the crypto market lower throughout the year, including Bitcoin (BTC) and Ether (ETH). XRP is also not immune, given the token’s consistently positive correlation with Bitcoin since October 2021.XRP/USD and BTC/USD daily correlation coefficient. Source: TradingViewFor instance, XRP’s daily correlation coefficient with Bitcoin on Sep. 19 was 0.47. A reading of 1 means that the two assets move in lockstep.  XRP price in danger of going under $0.25 in Q4Independent market analyst Cheds highlighted that XRP has been fluctuating inside a rectangular range since June, adding that “there’s nothing to be excited about” at present.The range is defined by $0.38-$0.40 acting as resistance and $0.28-$0.30 acting as support. XRP’s price dropped after testing the resistance and, as of Sep. 19, was heading toward the support area, as shown below.XRP/USD daily price chart featuring head-and-shoulders setup. Source: TradingViewInterestingly, a move toward the rectangular range support could also trigger a classic bearish reversal pattern called the head-and-shoulders, defined by three consecutive peaks forming atop a common support level, with the middle peak (head) higher than the other two (left and right shoulders).Related: Ether staking could trigger securities laws — GenslerA head-and-shoulders pattern resolves after the price breaks below its support line and falls by as much as the maximum distance between the middle peak and the support. Applying this theory to XRP’s daily chart presents $0.242 as the downside target.In other words, XRP price could lose another 30% by the end of this year, driven primarily by macro catalysts.The views and opinions expressed here are solely those of the author and do not necessarily reflect the views of Cointelegraph.com. Every investment and trading move involves risk, you should conduct your own research when making a decision.

Čítaj viac

Bitcoin, Ethereum crash continues as US 10-year Treasury yield surpasses June high

Bitcoin (BTC) and Ethereum’s native token, Ether (ETH), started the week on a depressive note as investors braced themselves for a flurry of rate hike decisions from central banks, including the U.S. Federal Reserve and Bank of England.Bitcoin price fails to hold $20,000On Sep. 19, BTC’s price has failed to regain the $20,000 psychological support zone. The BTC/USD pair slipped by 6.5% to around $18,250, while ETH dropped 4% to approximately $1,280. Their gloomy performance came as a part of a broader decline that started in mid-August, wherein BTC and ETH wiped a total of 28% and 37% off their market valuation, respectively.BTC/USD and ETH/USD daily price chart. Source: TradingViewA 500 bps global rate hike ahead?This week, the Fed and a number of its global peers will potentially attack rising inflation by further raising interest rates.Data compiled by Bloomberg suggests that the U.S. central bank, alongside Sweden’s Riksbank, the Swiss National Bank, Norway’s Norges Bank, the Bank of England, and others, will raise lending rates by a combined 500 basis points, or 5%.Central banks’ rate decisions in the week ending Sep. 24. Source: BloombergThe market’s riskier assets have reacted negatively to these upcoming policy meetings. Last week, MSCI’s flagship global equity index, ACWI, which combines developed and emerging market stocks, fell 4.25% to nearly $84. At its peak, the index was trading for $107.39 in November 2021. Interestingly, Bitcoin and Ethereum peaked in the same month at $69,000 and $4,950, respectively.ACWI weekly price chart. Source: TradingViewTherefore, this growing correlation against the prospect of global rate hikes could continue to pressure BTC and ETH lower despite their growth-oriented narratives.#Ethereum Merge resulting in downside teaches us a valuable lesson. The global macro environment supersedes everything. If the global markets were generally bullish, then the Merge would have resulted in a pump. But it didn’t.This goes for #Bitcoin as well.— Kevin Svenson (@KevinSvenson_) September 18, 2022Instead, investors may seek safety in low-volatile assets, including the U.S. dollar and government bonds.For instance, the U.S. dollar index, a barometer to measure the greenback’s strength, rose by 0.5% to 110 on Sep. 19 after its highest weekly close since 2002. Similarly, six-month U.S. Treasury notes yield 3.79% if held until maturity, thus offering investors a safer investment alternative with guaranteed returns in the short term. Similarly, the U.S. 10-year Treasury yield has surpassed its June high when Bitcoin dropped to yearly lows. U.S. Treasury Yields as of Sep. 19. Source: BloombergOther shorter-dated and longer-dated T-bills yield similar returns.Bitcoin to $14K-$15K, Ethereum to $750 next?A mix of on-chain and technical indicators further hints at an imminent price crash in Bitcoin and Ethereum markets.First, the Bitcoin Spent Output Age Bands (7-10 years), which tracks spent BTC and bundles them into categories depending on their age, showed the movement of more than 5,000 BTC on Sep. 4. MACD_D, a user at the on-chain analytics platform CryptoQuant, argues that this is typically bad news for the price of Bitcoin.”If the holder, which held BTC in its seventh year, moves more than 5,000BTC, there could be a strong downward trend in the future,” the verified user wrote, stressing: “This indicator showed signal 7 in the past and fell 6 times except for 1 (07 Feb ’21) The fact that the long-term holder moved the BTC means that there will be an unusual price movement in the future.”Bitcoin spent output age bands (7-10 years). Source: CryptoQuantThe user also highlighted a recent rise in Ether dominance to over 20%, noting that it typically hints at a bubble that’s about to pop. Excerpts:”When #BTC is simply transverse, the excessive rise of Ethereum creates a bubble. In particular, if the ETH dominance rises by more than 20%, it provides a good timing to enter the short position.”Related: Goldman Sachs’ bearish macro outlook puts Bitcoin at risk of crashing to $12KFrom a technical standpoint, Bitcoin has entered the breakdown stage of its prevailing “bear flag” pattern, now eyeing an extended decline toward the flag’s profit target at around $14,500 in 2022.BTC/USD daily price chart featuring bear flag breakdown setup. Source: TradingViewMeanwhile, Ether has also been breaking out of a symmetrical triangle. As a result, ETH price could drop toward $750 if the bearish continuation pattern plays out, along with weakening technicals for the ETH/BTC pair as well. ETH/USD daily price chart featuring symmetrical triangle breakdown setup. Source: TradingViewIn other words, a 40% ETH price crash is on the table before the end of the year.The views and opinions expressed here are solely those of the author and do not necessarily reflect the views of Cointelegraph.com. Every investment and trading move involves risk, you should conduct your own research when making a decision.

Čítaj viac

Goldman Sachs' bearish macro outlook puts Bitcoin at risk of crashing to $12K

A sequence of macro warnings coming out of the Goldman Sachs camp puts Bitcoin (BTC) at a risk of crashing to $12,000.Bitcoin in “bottom phase?”A team of Goldman Sachs economists led by Jan Hatzius raised their prediction for the speed of Federal Reserve benchmark rate hikes. They noted that the U.S. central bank would increase rates by 0.75% in September and 0.5% in November, up from their previous forecast of 0.5% and 0.25%, respectively.Fed’s rate-hike path has played a key role in determining Bitcoin’s price trends in 2022. The period of higher lending rates — from near zero to the 2.25-2.5% range now — has prompted investors to rotate out of riskier assets and seek shelter in safer alternatives like cash.Bitcoin has dropped by almost 60% year-to-date and is now wobbling around its psychological support of $20,000. Some analysts, including a pseudonymous trader Doctor Profit, believe BTC’s price has entered the bottom phase at current levels. However, the trader warned:”Please consider FEDs next decisions. 0.75% [rate hike] already priced in, 1% and we see blood.”BTC/USD price performance comparison between 2012-2016 and 2020-2022. Source: Doctor Profit/TradingViewOn the other hand, Bitcoin’s consistently positive correlation with the U.S. stock market, particularly the tech-heavy Nasdaq Composite, poses deeper correction risks.Sharon Bell, a strategist at Goldman Sachs, suggests the recent rallies in the stock market could be bull traps, echoing her firm’s warning that equities could crash by 26% if the Fed gets more aggressive with its rate increases to fight inflation.Interestingly, the warnings coincide with a recent rise in Bitcoin short positions held by institutional investors, according to CME data highlighted in the Commodity Futures Trading Commission’s (CFTC) weekly report.CME Bitcoin derivatives held by smart money. Source: CFTC/Ecoinometrics”Definitely a sign that some people are counting on a risk asset meltdown this fall,” noted Nick, an analyst at data resource Ecoinometrics.Options consensus see BTC at $12KBitcoin options expiring at the end of 2022 show most traders betting on the BTC price dropping all the way down to the $10-000-12,000 area.BTC options open interest by strike price. Source: CoinglassOverall, the call-put open interest ratio was 1.90 on Sep. 18, with call options for the $45,000 strike price carrying the maximum weight. But strike prices between $10,000 and $23,000 showed at least four puts for every three calls — which is perhaps a more realistic, interim evaluation of market sentiment.Related: Tired of losing money? Here are 2 reasons why retail investors always loseFrom a technical perspective, Bitcoin’s price could drop by roughly 30% to $13,500 as the price forms a convincing inverse up-and-handle pattern.BTC/USD daily price chart with inverse cup-and-handle breakdown setup. Source: TradingViewConversely, a decisive rally above the 50-day exponential moving average (50-day EMA; the red wave) near $21,250 could invalidate this bearish setup, positioning BTC for a rally toward $25,000 as its next psychological upside target.The views and opinions expressed here are solely those of the author and do not necessarily reflect the views of Cointelegraph.com. Every investment and trading move involves risk, you should conduct your own research when making a decision.

Čítaj viac

Dogecoin has crashed 75% against Bitcoin since Elon Musk's SNL appearance

Dogecoin (DOGE) may be back in the top-ten cryptocurrency by market capitalization, but its loses in both USD and Bitcoin (BTC) terms since Elon Musk’s SNL appearance are considerable.Dogecoin loses Musk-effectThe DOGE/BTC trading pair has fallen 75% after peaking out at 1,287 satoshis on May 9, 2021, a day after Musk was a guest host on Saturday Night Live, including a sketch titled “The Dogefather.”DOGE/BTC daily price chart. Source: TradingViewBefore his appearance, the billionaire entrepreneur was relentlessly tweeting Dogecoin memes, images, which helped DOGE — a cryptocurrency that started out as a joke — to attain a market capitalization north of $90 billion in May 2021.That’s more than 36,000% gains in just two years. But things have gone downhill ever since. Investors reflected hopes that even an optimistic wink from Musk on SNL toward DOGE would prompt his 106 million followers to buy the meme-token. But Musk did an unforeseeable thing: he called Dogecoin a “hustle.” [embedded content]One day later, DOGE’s price began its decline from its all-time high. It continues its downtrend to this day, changing hands for about 300 satoshis versus its peak value of 1,287 satoshis.Simultaneously, the price of Dogecoin has crashed by more than 90% against the U.S. dollar after peaking out at $0.76 in May 2021.Elon Musk’s efforts to keep Dogecoin relevantMusk has made multiple efforts to revive people’s interest in Dogecoin ever since. In May 2021, he revealed he had been working with Dogecoin developers to improve its blockchain’s transaction efficiency since 2019. Additionally, Musk’s Tesla and SpaceX also started accepting DOGE payments for their merchandise, prompting a sharp but short-lived price rally.Moreover, Musk stated during a market crash in March 2022 that he would not sell his crypto holdings, including DOGE and Bitcoin. Nonetheless, Tesla sold 75% of its Bitcoin holdings three months after Musk’s declaration.As a general principle, for those looking for advice from this thread, it is generally better to own physical things like a home or stock in companies you think make good products, than dollars when inflation is high.I still own & won’t sell my Bitcoin, Ethereum or Doge fwiw.— Elon Musk (@elonmusk) March 14, 2022The prospect of adding a DOGE payment option to Twitter also collapsed after Musk backed away from buying the social media giant.In September 2022, Tesla launched Cyberwhistle, a limited-edition collectible inspired by its Cybertruck vehicle, which users can purchase only via Dogecoin.Will Dogecoin rebound, then?Traders have started ignoring Musk’s celebrated association with Dogecoin, given their half-hearted reactions to his DOGE-related updates lately.Instead, it appears that traders have been more focused on macro catalysts lately, primarily the Federal Reserve’s back-to-back interest rate hikes that have put downward pressure on cryptocurrencies, stocks, and similar risk-on assets in 2022 and beyond. Related: Dogecoin becomes second largest PoW cryptocurrencyThe technical setups also suggest the same. For instance, on the weekly chart, DOGE/BTC now tests 307 satoshis as its interim support, given the level’s history as a strong price floor since November 2021. DOGE/BTC weekly price chart. Source: TradingViewA decisive break below 307 satoshis would have DOGE/BTC test its 200-week exponential moving average (200-week EMA; the blue wave) near 244 satoshis as its downside target in 2022 — a 20% decline.A 40% decline against the dollarDOGE price has been trending inside a broad descending channel against the U.S. dolla since it topped in May 2021, now eyeing its lower trendline as the next downside target.DOGE/USD weekly price chart. Source: TradingViewThe target appears to be in the range defined by $0.048 and $0.036, given these levels’ history as support. Therefore, DOGE could drop by roughly 40% against the dollar in Q4 2022.The views and opinions expressed here are solely those of the author and do not necessarily reflect the views of Cointelegraph.com. Every investment and trading move involves risk, you should conduct your own research when making a decision.

Čítaj viac

Získaj BONUS 8 € v Bitcoinoch

nakup bitcoin z karty

Registrácia Binance

Burza Binance

Aktuálne kurzy