Autor Cointelegraph By Yashu Gola

Ethereum fork token ETHPoW climbs 150% after smart contract hack — A fakeout rally?

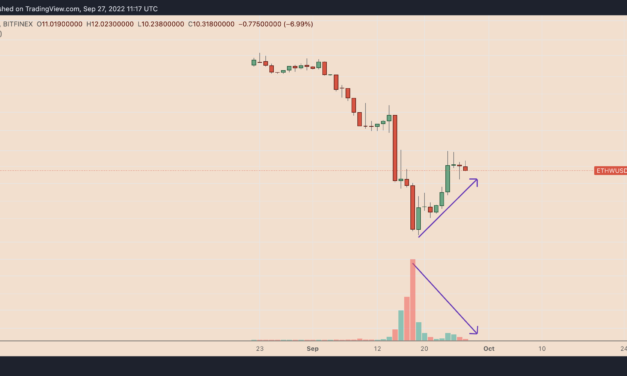
ETHW has logged a significant price rebound despite its blockchain network, ETHPoW, suffering a smart contract hack in the first week after its launch.The short analysis of the attackhttps://t.co/87OVRqaYb2 https://t.co/vhRJyZVc72— BlockSec (@BlockSecTeam) September 18, 2022Bull trap risks surround ETHW marketETHW rebounded more than 150% eight days after the attack and traded for around $10.30 on Sept. 27. Fundamentally, this suggests that traders ignored the hack and trusted ETHPoW’s long-term viability as a blockchain project.But from a technical perspective, the ETHW price rally has accompanied weaker trading volumes. In other words, fewer traders have been involved in the pumping of the ETHPoW token’s price in the past eight days, as the Bitfinex exchange data shows in the chart below.ETHW/USD daily price chart. Source: TradingViewThe growing divergence between ETHW’s rising prices and falling trading volumes suggests that traders’ interest in the ETHPoW token has been dwindling. In other words, ETHW’s price risks a sharp correction in the coming days.Related: Dogecoin becomes second largest PoW cryptocurrencyThis “bearish divergence” setup is supported by a descending trendline that has served as resistance for ETHW since Sept. 2. On the four-hour chart below, traders have shown their likelihood of dumping their ETHW positions near the said resistance. Moreover, even the token’s latest pullback move on Sept. 27 has originated near the same trendline, raising the possibility of an extended price correction.ETHW/USD four-hour price chart. Source: TradingViewAs a result, ETHW’s short-term technical bias is skewed toward the bears. So, if its correction extends, the PoW token risks falling into the $8–$9 price range, which also coincides with ascending trendline support, or a 25% drop from current price levels.ETHPoW hash rate recoversOn a brighter note, the ETHPoW’s network hash rate has recovered significantly since the smart contract hack, rising from 29.44 TH/s on Sept. 19 to 48.48 TH/s on Sep. 27. Although, the current hash rate is still down about 40% from its record high of 79.42 TH/s.ETHPoW hash rate performance since launch. Source: 2miners.comStill, a rising hash rate means more miners have joined the ETHPoW network after its split from the Ethereum proof-of-stake (PoS) chain on Sept. 15. In theory, it should ensure better protection against potential 51% attacks. Simultaneously, ETHPoW has witnessed a growth in its network’s total valued locked (TVL). As of Sept. 27, ETHPoW had 66,548 ETHW deposited across four decentralized exchanges functioning atop its blockchain compared to nearly 38,000 ETHW three days prior, or a 75% increase in the last three days.ETHPoW TVL as of Sep. 27, 2022. Source: Defi LlamaInterestingly, UniWswap, a fork of the Ethereum blockchain-based decentralized exchange Uniswap, comprises more than 50% of the ETHPoW chain’s TVL. DApps functional atop ETHPoW chain. Source: Defi LlamaOther DApps include PoWSea, a nonfungible token ( marketplace, as well as exchanges PoWSwap and HipPoWSwap.The views and opinions expressed here are solely those of the author and do not necessarily reflect the views of Cointelegraph.com. Every investment and trading move involves risk, you should conduct your own research when making a decision.

Čítaj viac

Cardano bulls run out of steam after Vasil hard fork — 40% ADA price crash in play

Cardano’s (ADA) long-awaited Vasil update went live on Sept. 22, which promises to make its blockchain more scalable and cheaper than before. However, this has failed to bring bullish momentum to the ADA market.Sell-the-news hampers CardanoADA’s price has dropped by approximately 9.5% since the update and was changing hands for $0.43 on Sept. 26. The ADA/USD pair’s drop was accompanied by a rejection candlestick on its daily price chart, confirmed by a brief rally to $0.48 on the day of the fork and a sharp correction thereafter.ADA/USD daily price chart. Source: TradingViewADA bulls’ muted reaction to the successful Vasil update is similar to what transpired across the Ether (ETH) market after Ethereum’s Merge.In other words, a buy the rumor, sell the news event, resembling most of Cardano’s previous hard forks, which have a history of preceding ADA price crashes, as shown below.ADA/USD three-day price chart. Source: TradingViewIn addition, macro risks led by a very hawkish Federal Reserve also weighed down ADA’s bullish expectations post-Vasil. The U.S. central bank’s decision to raise its benchmark rates by another 0.75% came within 48 hours before the Cardano update. ADA fell alongside risk-on assets in response, given its consistent positive correlation with stocks throughout 2022.As of Sept. 26, the correlation coefficient between the Cardano token and the Nasdaq Composite was 0.83.ADA/USD and Nasdaq daily correlation coefficient. Source: TradingViewADA price eyes 40% crashMeanwhile, ADA’s technicals are painting a descending triangle pattern for a bearish outlook in the near term.Related: Charles Hoskinson and ETH dev get into a war of words post-Vasil upgradeTheoretically, a descending triangle in a downtrend acts as a bearish continuation signal, meaning it resolves after the price breaks below its support trendline decisively. In doing so, the price falls by as much as the maximum triangle height.ADA/USD three-day price chart featuring descending triangle breakdown setup. Source: TradingViewTherefore, a breakdown below ADA’s triangle support of $0.41 could have its price crash toward $0.25. In other words, a 40% price decline by the end of 2022.The views and opinions expressed here are solely those of the author and do not necessarily reflect the views of Cointelegraph.com. Every investment and trading move involves risk, you should conduct your own research when making a decision.

Čítaj viac

3 reasons why USDC stablecoin dropping below $50B market cap is Tether's gain

The market capitalization of USD Coin (USDC), a stablecoin issued by U.S.-based payment tech firm Circle, has dropped below $50 billion for the first time since January 2022.On the weekly chart, USDC’s market cap, which reflects the number of U.S. dollar-backed tokens in circulation, fell to $49.39 billion on Sept. 26, down almost 12% from its record high of $55.88 billion, established merely three months ago. USDC versus USDT weekly market cap chart. Source: TradingViewIn contrast, the market cap of Tether (USDT), which risked losing its top stablecoin position to USDC in May, crossed above $68 billion on Sept. 26, albeit still down 17.4% from its record high of $82.33 billion in May 2022.The divergence between USDT and USDC shows investors’ renewed preference for the former. Let’s take a look at the factors boosting Tether as the top stablecoin.Binance’s USDC suspensionBinance, the world’s largest cryptocurrency exchange by volume, announced earlier in September that it would convert its users’ USDC balances for its own stablecoin, Binance USD (BUSD). The conversion will commence on Sept. 29 and does not apply to USDT.The exchange said it wants to “enhance liquidity and capital-efficiency for users” via what appears to be a forced conversion in an increasingly competitive stablecoin sector. As a result, Binance suspended spot, future and margin trading in USDC.8/ 1. Binance’s forced “Auto-conversion” is blatantly monopolistic behavior of a typical FinTech companyThey are no better than traditional banks that have the power to freeze or take control of user fundsWhere is the decentralized future that #Web3 users were promised?— Momentum 6 (@Momentum_6) September 21, 2022USDC’s market cap has plunged by $9.5 billion since the announcement.Following Binance’s footsteps, the India-based cryptocurrency exchange also stopped deposits of USDC beginning Sept. 26.Related: Binance: No plans to auto-convert Tether, though that ‘may change’Whales ditch USDC after Terra fiascoThe USDC supply help by top 1% addresses (aka whales) has dropped to 88.36% in September from its year-to-date high of 93.84% in February, according to data collected by Glassnode.USDC supply held by top 1% addresses. Source: GlassnodeInterestingly, the plunge accelerated after Terra, a $40-billion “algorithmic stablecoin” project, collapsed in May, stirring a negative sentiment toward the entire stablecoin industry. For instance, the total market cap of all stablecoins saw the worst correction in 2022, dropping from a February high of $97.37 billion to $80.65 billion in September, according to CryptoQuant.All stablecoins’ circulating supply. Source: CryptQuantTornado Cash sanctionsThe USDC market cap plunge has also accelerated after the U.S. Treasury imposed sanctions on crypto mixing service Tornado Cash over money laundering concerns. Circle responded to the sanctions by freezing all USDC wallets owned by Tornado Cash. The firm also prevented addresses that may be associated with the banned mixing service from using USDC. In contrast, Tether avoided blacklisting Tornado Cash addresses.Independent market analyst Geralt Davidson treated Circle’s response to the Tornado Cash sanction as a cue that holding USDC is riskier compared to its stablecoin rivals. “People now have realized there is more risk holding USDC, Circle blacklisted all the USDC on Tornado Cash addresses sanctioned by US Treasury,” he noted in August 2022, adding:USDC seems like the only token being blacklisted, while other ERC-20 tokens were not.Davidson also treated Tornado Cash as one of the reasons why USDC whales have been dumping the stablecoin in recent months.The views and opinions expressed here are solely those of the author and do not necessarily reflect the views of Cointelegraph.com. Every investment and trading move involves risk, you should conduct your own research when making a decision.

Čítaj viac

The biggest Bitcoin fund just hit a record -35% discount — A warning for BTC price?

Grayscale Bitcoin Trust (GBTC), a cryptocurrency fund that currently holds 3.12% of the total Bitcoin (BTC) supply, or over 640,000 BTC, is trading at a record discount compared to the value of its underlying assets.Institutional interest in Grayscale dries upOn Sep. 23, the $12.55 billion closed-end trust was trading at a 35.18% discount, according to the latest data.GBTC discount versus spot BTC/USD price. Source: YChartsTo investors, GBTC has long served as a great alternative to gain exposure in the Bitcoin market despite its 2% annual management fee. This is primarily because GBTC is easier to hold for institutional investors because it can be managed via a brokerage account. For most of its existence, GBTC traded at a hefty premium to spot Bitcoin prices. But It started trading at a discount after the debut of the first North American Bitcoin exchange-traded fund (ETF) in Canada in February 2021.Unlike an ETF, the Grayscale Bitcoin Trust does not have a redemption mechanism. In other words, GBTC shares cannot be destroyed or created based on fluctuating demand, which explains its heavily discounted prices compared to spot Bitcoin.Grayscale’s efforts to convert its trust into ETF failed after the Securities and Exchange Commission’s (SEC) rejection in June. In theory, SEC’s approval could have reset GBTC’s discount from current levels to zero, churning out profits for those who purchased the shares at cheaper rates.Grayscale sued the SEC over its ETF application rejection. But realistically, it could take years for the court to give a verdict, meaning investors would remain stuck with their discounted GBTC shares, whose value have fallen by more than 80% from their November 2021 peak of around $55.GBTC daily price chart. Source: TradingViewAlso, GBTC’s 12-month adjusted Sharpe Ratio has dropped to -0.78, which shows that the anticipated return from the share is relatively low compared to its significantly high volatility.GBTC 12-month adjusted Sharpe Ratio. Source: PortfolioSlab.comSimply put, institutional interest in Grayscale Bitcoin Trust is drying up.A warning for spot Bitcoin price?Grayscale is the world’s largest passive Bitcoin investment vehicle by assets under management. But it doesn’t necessarily enjoy a strong influence on the spot BTC market after the emergence of rival ETF vehicles.For instance, crypto investment funds have attracted a combined total of almost $414 million in 2022, according to the CoinShares’ weekly report. In contrast, Grayscale has witnessed outflows of $37 million, which include its Bitcoin, Ethereum, and other tokens’ trusts.Fund flows by provider. Source: CoinSharesInstead, day-to-day fluctuations in the spot Bitcoin price are heavily driven by macro factors, at least for the time being.NDAQ versus BTC/USD daily price chart. Source: TradingViewA stronger U.S. dollar also hurts Bitcoin’s upside prospects, given their consistent negative correlation over the past year in a higher interest rate environment.Related: BTC mining firm Compute North files for bankruptcyFor instance, the U.S. dollar index (DXY), which measures the greenback’s strength against a basket of top foreign currencies, has climbed over 113, its 20-year high, on Sep. 23. Similarly, yields on 2-year and 10-year U.S. Treasury notes have climbed to 4.21% and 3.69%, respectively.U.S. dollar index versus US 10-year and US 2-year Treasury yields. Source: TradingViewSeveral on-chain metrics, however, are suggesting that Bitcoin could bottom out soon based on historical data. However, from a technical standpoint, BTC’s price still risks a drop toward the $14,000-$16,000 area, according to independent analyst il Capo of Crypto.BTC/USD eight-hour price chart. Source: TradingView/Capo of CryptoIts more likely that [Bitcoin] will reject at the first resistance of 20300-20600,” he said while citing the chart above, adding: “Wait for the bounce, then exit all the markets.”Other Bitcoin analysts have thrown around even lower targets such as $10,000–$11,000, due to this being a historical high-volume range.  The views and opinions expressed here are solely those of the author and do not necessarily reflect the views of Cointelegraph.com. Every investment and trading move involves risk, you should conduct your own research when making a decision.

Čítaj viac

XRP hits 13-month high versus Bitcoin with 35% daily surge — But is a correction inevitable?

XRP price posted a sharp rally against Bitcoin (BTC) on continued optimism about a potential settlement between Ripple, a San Francisco-based blockchain payment firm, and the U.S. Securities and Exchange Commission (SEC).Settlement rumors fuel XRP price boom On Sept. 23, the XRP/BTC pair surged to 0.00002877 — its best level in 13 months — from 0.00002132, a 35% price rally versus Bitcoin in one day. Meanwhile, the same timeframe saw XRP rising as much as 42% against the U.S. dollar.XRP/BTC and XRP/USD daily price chart. Source: TradingViewThe big price leaps in the XRP market started appearing after Ripple and SEC filed motions for a summary judgment with the court on Sept. 12 regarding their ongoing legal battle over allegations that Ripple hcommitted securities fraud.In other words, Ripple and SEC agreed that the court should use the available evidence to reach a verdict on whether the blockchain firm illegally raised funds by selling XRP by December 2022, and thus avoid a trial. XRP’s price has boomed approximately 75% and 60% versus Bitcoin and the dollar, respectively, since Ripple’s court filing, fueled by optimism of a possible win for Ripple. The buying accelerated further after Ripple CEO Brad Garlinghouse suggested the same in his recent interview with Fox Business on Sept. 22.BREAKING: Ripple CEO @BGarlinghouse Appears on Fox Business Amid $XRP Price Surge Approaching $0.50pic.twitter.com/wg6a3QeSly— HeadlineHunter!U.S. (@HHunter_US) September 22, 2022Garlinghouse:”People realize that the SEC is really overreaching and they are not following a faithful allegiance to the law in pursuit for an outcome […] The SEC has kind of lost its way.”XRP sharks and whales buying since 2020The price surge also comes amid the consistent accumulation of XRP tokens by rich investors csince May.The percentage of entities holding between 1 million and 10 million XRP tokens — known as sharks and whales — has risen as a whole to 6.35% on Sept. 23, 2022, up from 5.43% on Dec. 31, 2020, according to data from Santiment, which noted: “Active shark & whale addresses holding 1m to 10m $XRP have been in an accumulation pattern since late 2020.”Active XRP shark and whale addresses. Source: SantimentMeanwhile, the given period also witnessed entities with over 10 million XRP tokens reaching an all-time low 70.75% of the current supply. Pain ahead?It appears that traders have been buying the rumor in the run-up to the Ripple vs. SEC verdict. But while it remains to be seen if this will then turn into “sell the news,” depending on the outcome of the ruling, XRP’s technicals are hinting at a potential correction.Notably, XRP has already become an overbought asset versus Bitcoin and the dollar.Related: Total crypto market cap shows strength even after the Merge and Federal Reserve rate hikeThe relative strength index (RSI) for XRP/BTC reached almost 85 on Sept. 23, way above the overbought threshold of 70 that typically precedes a strong price correction or consolidation.XRP/BTC has already corrected by nearly 10% from its 13-month peak, as shown in the chart below. The pair now tests 0.00002601 as its short-term support, which, if broken to the downside, could have it test 0.00002079 as its primary downside target or a 20% drop from current levels by the end of the year. XRP/BTC daily price chart. Source: TradingViewMeanwhile, XRP eyes a similar sharp correction versus the dollar after crossing paths with a multi-month descending trendline resistance, as shown below.XRP/USD three-day price chart. Source: TradingViewAn extended pullback from the trendline resistance could see XRP test its near-term horizontal trendline support as its next downside target. In other words, the XRP/USD pair could drop to $0.31 by the end of 2022, down almost 40% from Sept. 23’s price.The views and opinions expressed here are solely those of the author and do not necessarily reflect the views of Cointelegraph.com. Every investment and trading move involves risk, you should conduct your own research when making a decision.

Čítaj viac

Získaj BONUS 8 € v Bitcoinoch

nakup bitcoin z karty

Registrácia Binance

Burza Binance

Aktuálne kurzy