Autor Cointelegraph By Yashu Gola

Will ETH price crash to $750? Ethereum daily active addresses plunge to 4-month lows

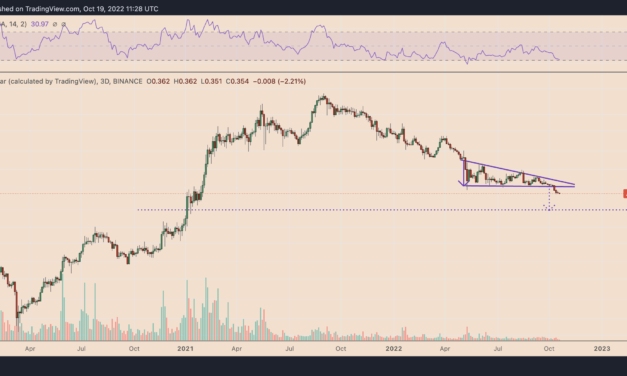
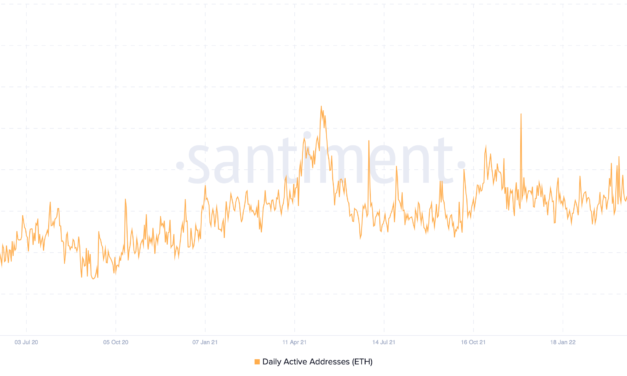
Ethereum has witnessed a substantial drop in its daily active address (DAA) count over the last four months, raising fears about more downside for Ether (ETH) price in the coming weeks.Stagnant Ethereum price spooks investorsThe number of Ether DAA dropped to 152,000 on Oct. 21, its lowest level since June, according to data provided by Santiment. In other words, the plunge showed fewer unique Ethereum addresses interacting with the network.Ethereum daily active address count on a daily timeframe. Source: SantimentInterestingly, the drop comes after Ether’s 80%-plus correction from its November 2021 high of around $4,850. This coincidence could mean two things: Ethereum users decided to leave the market and/or paused their interaction with the blockchain network after the market’s downturn.Santiment analysts blamed the drop on “weak hands,” sentimental traders who drop out of the market during a bearish or stagnant phase, noting:“Disinterest [is] at a high as [the Ethereum] prices have stagnated.”Notably, Ether’s price has been trading inside the $1,200-$1,400 range for over a month, accompanied by a drop in weekly trading volumes.Disinterest among investors is also visible across Ethereum-based investment funds. These funds witnessed outflows worth $3.9 million in the week ending Oct. 14, according to CoinShares’ latest weekly report. Capital flowing in and out of crypto funds. Source: CoinSharesMoreover, these outflows have reached $368.70 million on a year-to-date (YTD) timeframe.40% ETH price crash in playCrypto prices have tumbled across 2022 with other riskier assets, brought down by global central banks’ tightening policies to tame rising inflation. However, they risk bearish continuation as inflation remains elevated, prompting more rate hikes in the future.⚠️BREAKING:*MAY 2023 FED FUND FUTURES HIT 5.00% AS TRADERS PRICE IN ANOTHER RATE HIKEpic.twitter.com/7aX0tobNvt— Investing.com (@Investingcom) October 20, 2022Ethereum could suffer due to inflation-related macro risks. In other words, ETH/USD could slip below its prevailing rising trendline support, thus triggering a classic continuation setup called ascending triangle, as illustrated in the chart below.ETH/USD weekly price chart featuring ascending triangle breakdown setup. Source: TradingViewThe profit target of an ascending triangle pattern is measured after the adding the maximum distance between its horizontal trendline resistance and rising trendline support to the breakdown point. As a result, ETH’s downside target comes to be around $750, or 40% lower than current price levels.Related: Why is the crypto market down today?Conversely, a rebound from the lower trendline could have Ether eye a rally toward the upper trendline. In other words, a climb toward $1,800 in October, up 40% from current prices.The views and opinions expressed here are solely those of the author and do not necessarily reflect the views of Cointelegraph.com. Every investment and trading move involves risk, you should conduct your own research when making a decision.

Čítaj viac

Cardano price chart paints 'Burj Khalifa' with 7-month losing streak — More losses ahead?

Cardano (ADA) price is in the process of painting its seventh red monthly candle in a row as the token fell to its lowest level since February 2021.The trend saw ADA’s price rising nearly 800% to $3.16 between February 2021 and September 2021, followed by a complete wipeout of those gains entering October 2022. Amusingly, the entire price action took the shape of the “Burj Khalifa,” the world’s tallest skyscraper in Dubai.Ada Khalifa pic.twitter.com/KE2SxTO3bN— Trader_J (@Trader_Jibon) October 19, 2022ADA price eyes 35% price crashThe ADA price correction began primarily in the wake of a similar downtrend across the cryptocurrency market, led by the Federal Reserve’s aggressive interest rate hikes to tame rising inflation.Even an optimistic Cardano network upgrade dubbed Vasil was not enough to bring its buyers back to the market.Notably, ADA’s price has dropped by nearly 20% since the Vasil hard fork nearly a month ago — an update aimed at improving its network’s scalability and smart contract capabilities. Moreover, the ADA/USD pair also broke below a key support level that may lead to another major crash ahead in Q4.The said support level at around $0.42 constitutes a descending triangle, a continuation pattern. In other words, ADA’s potential to continue its prevailing downtrend becomes higher if it forms and breaks out of a descending triangle to the downside.ADA/USD three-day price chart featuring descending triangle breakdown. Source: TradingViewMeanwhile, as a rule of technical analysis, a descending triangle breakdown during a downtrend typically pushes the price lower to a level at length equal to the pattern’s maximum height. Therefore, ADA risks dropping toward $0.248, or by 35%, if the descending triangle breakdown plays out.$ADA now losing the lights out level and going to the place where coins go when they die. Prob got a -50% in it from that breakdown level imoAnd I’m by no means picking on it. I posted charts for almost several alts like this including $SOL and $ETH in Dec-Jan pic.twitter.com/Of0TNZfXKK— Pentoshi (@Pentosh1) October 19, 2022

Conversely, a retest followed by a close above the triangle’s lower trendline as resistance raises ADA’s possibility to invalidate the bearish outlook. In doing so, it could trigger a descending channel setup forming simultaneously with the ascending triangle, as shown below.ADA/USD three-day price chart featuring descending channel pattern. Source: TradingViewThe descending channel setup sees ADA bouncing from its lower trendline to test the upper trendline near $0.45 as its immediate upside target. In other words, a 30% interim price rebound.Macro risks remainOverall, Cardano continues to tread ahead under macro risks, primarily after September’s 8.2% inflation reading, which raised the possibility of the Fed continuing its rate hike spree for the remainder of 2022.Risk assets across the board have witnessed a decline in individual investors’ enthusiasm, which was instrumental in pushing thcryptocurrency prices higher in 2020 and 2021. For instance, Robinhood CEO Vlad Tenev noted:”2020 and 2021, people were really interested in investing in stocks. There was widespread participation in the stock market. Now people are talking about gas prices and inflation.”ADA, whose positive correlation coefficient with the U.S. benchmark S&P 500 has remained above $0.80 for most of 2022, also witnessed a sharp decline in its daily active addresses (DAA) since November 2021’s market top. Related: Cardano founder points out flaws in Ethereum and BitcoinNotably, its 30-day DAA average dropped to 165,000 on Oct. 19, its lowest level in two years, data from Santiment shows.Cardano 30-day DAA average. Source: SantimentOn a brighter note, the number of Cardano addresses holding 100–1,000 ADA and 1,000–10,000 ADA tokens has increased during the bear cycle, hinting at potential accumulation by large investors, or so-called whales. The views and opinions expressed here are solely those of the author and do not necessarily reflect the views of Cointelegraph.com. Every investment and trading move involves risk, you should conduct your own research when making a decision.

Čítaj viac

3 reasons why Quant Network's QNT token may have topped after 450% gains since June

The price of Quant Network (QNT) eyes a sharp reversal after an impressive 450% rally in the past four months.QNT’s downside outlook takes cues from a flurry of technical and on-chain indicators, all suggesting that investors who backed its price rally have likely reached the point of exhaustion.QNT/USD daily price chart. Source: TradingViewHere are three reasons why it could be happening.Quant’s daily active addresses dropInterestingly, the period of QNT’s massive uptrend coincided with similar upticks in its number of daily active addresses (DAA). This metric represents the number of unique addresses active on the network as a sender or receiver.As of Oct. 17, the Quant Network’s DAA reached an all-time high of 10,949, up from around 5,850 four months ago, data from Santiment shows. Its upsurge during the QNT price uptrend shows traders were net buyers. However, the DAA readings dropped sharply in the past two days, reaching nearly 6,800 on Oct. 19. Simultaneously, QNT’s price fell by 25.5% to $171 in the same period, suggesting that many traders have been securing their profits.Quant Networks’s price versus daily active addresses. Source: SantimentQNT price downside targetThe profit-taking in the Quant Network market comes as its daily relative strength index (RSI) crossed above 70 on Oct. 17, hinting that the asset is overbought.An overbought RSI does not necessarily mean a strong bearish reversal, however. Instead, it shows that the price has moved upward too quickly and, thus, a correction is becoming increasingly likely before the uptrend could resume.QNT’s daily RSI corrected to 65 on Oct. 17. Simultaneously, the token’s price dropped toward $185, coinciding with its 0.236 Fib line of the Fibonacci retracement graph shown in the chart below.QNT/USD daily price chart. Source: TradingViewThe $185-level was instrumental as support in August 2021. But given the existing profit-taking sentiment, the level may not hold for long, which could result in an extended decline toward the $137-$150 support range.The area falls between QNT’s 0.382 and 0.5 Fib lines and further coincides with its 50-day exponential moving average (50-day EMA; the red wave in the chart above), creating a strong support confluence. Therefore, a break below $185 could have QNT bears eye $137, a 25% drop, as the ultimate downside target by the end of the month.QNT whales diminishThe period of Quant Network’s 450% price rally heavily coincided with the increase in the number of addresses holding between 100 QNT and 1,000 QNT tokens, dubbed as “whales” by Santiment.Related: Institutions ‘moving very, very fast’ into Crypto: Coinbase execHowever, the whale count started dropping on Oct. 16, a day before QNT’s price and DAA topped out. Meanwhile, addresses holding between 1,000 QNT and 10,000 QNT tokens also fell, suggesting that the plunge in the 100-1,000 QNT cohort was due to token distribution, not accumulation.Quant Network addresses holding 100-1,000 QNT and 1,000-10,000 QNT tokens. Source: SantimentIn other words, QNT whales have started selling their holdings near the token’s potential price top, raising possibilities that the decline could continue toward the technical targets, as mentioned above.The views and opinions expressed here are solely those of the author and do not necessarily reflect the views of Cointelegraph.com. Every investment and trading move involves risk, you should conduct your own research when making a decision.

Čítaj viac

$740M in Bitcoin exits exchanges, the biggest outflow since June's BTC price crash

The amount of Bitcoin (BTC) flowing out of cryptocurrency exchanges picked up momentum on Oct. 18, hinting at weakening sell-pressure that could help BTC price avoid a deeper correction below $18,000.Bitcoin forming a “bear market floor”Over 37,800 BTC left crypto exchanges on Oct. 18, according to data tracked by CryptoQuant. This marks the biggest Bitcoin daily outflow since June 17, on which traders withdrew nearly 68,000 BTC from exchanges.Moreover, over 121,000 BTC, or nearly $2.4 billion at current prices, has left exchanges in the past 30 days. Bitcoin exchange netflow from all exchanges. Source: CryptoQuantA spike in Bitcoin outflows from exchanges is typically seen as a bullish signal because traders remove the coins from platforms that they wish to hold. Conversely, a jump in Bitcoin inflows into exchanges is typically considered bearish given that the supply immediately available for selling increases.For instance, Bitcoin bottomed out locally at around $18,000 when its outflows from exchanges reached nearly 68,000 BTC on June 17. The cryptocurrency’s price rallied toward $24,500 in the following weeks.This time, the massive uptick in Bitcoin outflows from exchanges surfaces as the BTC price downtrend pauses inside the $18,000-$20,000 range. Interestingly, Bitcoin whales, or entities with over 1,000 BTC, have been mainly behind the coin’s strong foothold near the $18,000 level, according to several on-chain metrics.For instance, the Accumulation Trend Score by Cohort notes that the wallets holding between 1,000 BTC and 10,000 BTC have been accumulating Bitcoin “aggressively” since late September.Bitcoin accumulation trend score by cohort. Source: GlassnodeIn addition, whales’ on-chain behavior shows that they have recently withdrawn 15,700 BTC from exchanges, the largest outflow since June 2022.Bitcoin whale deposits and withdrawals volumes from exchanges. Source: Glassnode”Bitcoin prices have shown remarkable relative strength of late, amidst a highly volatile traditional market backdrop,” noted Glassnode in its weekly review published Oct. 10, adding: “Several macro metrics indicate that Bitcoin investors are establishing what could be a bear market floor, with numerous similarities to previous cycle lows.”Positive BTC fund inflowsMeanwhile, Bitcoin-based investment vehicles have also seen the fifth week of consistent inflows, according to CoinShares weekly report.About $8.8 million entered Bitcoin funds in the week ending Oct 14, which pushed the net capital received by these funds to $291 million on a year-to-date timeframe. CoinShares head of research  James Butterfill said the inflows imply a “net neutral sentiment amongst investors” toward Bitcoin.Capital flows by asset. Source: CoinSharesOn the flip side, Bitcoin’s technical outlook remains in favor of the bears, given the formation of what appears to be an inverted-cup-and-handle pattern on its three-day chart.Related: Bitcoin price ‘easily’ due to hit $2M in six years — Larry LepardAn inverted-cup-and-handle pattern forms when the price undergoes a crescent-shaped rally and correction followed by a less extreme, upward retracement. It resolves after the price breaks below its neckline and falls by as much as the distance between the cup’s peak and neckline.BTC/USD daily price chart featuring inverted-cup-and-handle pattern. Source: TradingViewBitcoin’s price could fall toward $14,000 if the inverted cup and handle play out as mentioned, in accordance with previous reports, or a 30% drop from current price levels. The views and opinions expressed here are solely those of the author and do not necessarily reflect the views of Cointelegraph.com. Every investment and trading move involves risk, you should conduct your own research when making a decision.

Čítaj viac

Post-midterm elections dump? Bitcoin will see $12K if this 2018 BTC chart fractal is correct

While Bitcoin (BTC) investors may not consider the U.S. midterm elections as a significant event, an eerie fractal from 2018 may provide a clue to what could happen before the year ends.Bitcoin to hit $12K–$14K after midterms?Comparing Bitcoin’s price actions prior to the midterm elections of 2018 with those of 2022 shows a strikingly similar bear market trend. For instance, BTC price trended lower in 2018 while holding a horizontal level near $6,000 as support, only to break below it after the midterm elections.BTC/USD daily price chart featuring 2018 trend. Source: TradingView/Aditya Siddhartha RoyIn 2022, the cryptocurrency has halfway mirrored this trend. Its price now awaits a close below the current horizontal support level of around $19,000. With the midterm elections scheduled for Nov. 8, the said breakdown scenario could occur sooner or later, as illustrated below.BTC/USD daily price chart featuring 2022 trend. Source: TradingView/Aditya Siddhartha RoyIndependent market analyst Aditya Siddhartha Roy thinks Bitcoin’s price will fall into the $12,000-$14,000 range if a similar breakdown occurs. He further notes that the cryptocurrency could bottom out in November or December 2022, just like in 2018.$BTC Bottom AnalysisComparing to 2018 & 2022 Bear market•Support Getting Weak – TrendLine Manipulation – Midterm Elections – Post Midterm Elections Dump – #BTC Bottom•Nov-Dec could be bottom for #Bitcoin•Retweet Appreciated #cryptocurrency #Crypto #ETH $ETH #Binance pic.twitter.com/GHDiHu4H3H— Aditya Siddhartha Roy❁ (@Adityaroypspk) October 16, 2022Stock market warnings for BitcoinThe bearish prediction surfaces as Bitcoin’s correlation with U.S. equities grows stronger in the wake of the Federal Reserve’s monetary policies. Both markets have witnessed sharp drawdowns in the period of the U.S. central bank’s rate hikes in 2022.Historically, in 17 of the 19 midterms since 1946, the stock market has performed better in the six months after an election than in the six months following it.S&P 500 average performance in U.S. midterm election years. Source: Charles SchwabThat is primarily due to the market’s expectations of higher government spending from a new Congress, notes Liz Ann Sonders, Charles Schwab’s chief investment strategist, who further argues that 2022 could yield a different outcome.”An additional infusion of funds seems unlikely this year, given the government’s historic levels of spending and stimulus in response to the pandemic,” she explains, adding:”The combination of high inflation, the war in Ukraine, and a lingering pandemic has already made this cycle, unlike prior midterm years. With so many other forces at play in the market, I wouldn’t put much weight in historical midterm-year performance.”U.S. money supply remains above $21 trillion. Source: FREDAs a result, Bitcoin remains at risk of tailing U.S. stocks lower, with the $12,000–$14,000 price target in view.Optimistic BTC price indicatorsHowever, a section of the crypto market sees Bitcoin decoupling from traditional markets, suggesting that the cryptocurrency may not tail S&P 500 into a post-midterm election crash.”At some point, the market will be controlled by those in the community that is long-term believers in BTC and very unlikely to sell and the growing global community which uses BTC for commerce,” Stephane Ouellette, chief executive of FRNT Financial Inc., told Bloomberg.Related: Bitcoin clings to $19K as trader promises capitulation ‘will happen‘Ouellette’ statement came after the daily correlation coefficient between Bitcoin and S&P 500 dropped to 0.08 on Oct. 9, the lowest in four months.BTC/USD and SPX daily correlation coefficient in recent days. Source: TradingViewMeanwhile, the number of unique addresses holding at least 1 BTC reached a new record high on Oct. 17, contrary to trends witnessed during the 2018 bear market. This suggests investors have been accumulating Bitcoin at local price dips.Number of Bitcoin addresses holding at least 1 BTC. Source: Glassnode “The on-chain data suggests those holders are optimistic the market will bounce back, keeping market fundamentals relatively healthy,” according to a note from crypto exchange Bitfinex.Market analyst Wolf offered a similar outlook, citing Bitcoin’s extremely oversold relative strength index (RSI) and Moving Average Convergence Divergence (MACD) indicators on weekly charts in 2022, which technically hints at a period of accumulation ahead. Comparing current structure with 2018 before capitulation is, imo, complete non sense Just by looking at the weekly RSI and MACD differences are notable.In 2018 RSI was floating at a mid range of 45s, in 2022 RSI has hit its lowest level ever. $BTC pic.twitter.com/3Zyp9DDPA6— Wolf (@IamCryptoWolf) October 17, 2022

In comparison, these oscillators were in the neutral zone prior to the 2018 midterm election, meaning BTC’s price had more room to decline.The views and opinions expressed here are solely those of the author and do not necessarily reflect the views of Cointelegraph.com. Every investment and trading move involves risk, you should conduct your own research when making a decision.

Čítaj viac

Získaj BONUS 8 € v Bitcoinoch

nakup bitcoin z karty

Registrácia Binance

Burza Binance

Aktuálne kurzy