Autor Cointelegraph By Yashu Gola

Is MATIC price about to double? Polygon's Reddit hype pushes exchange balance to 9-month lows

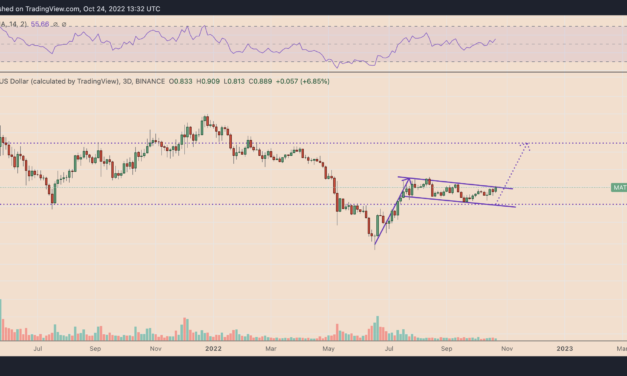
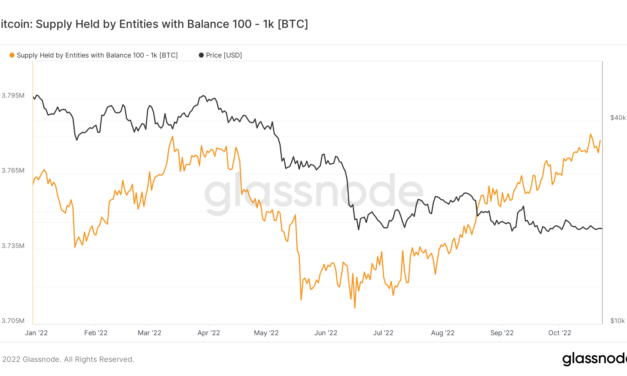
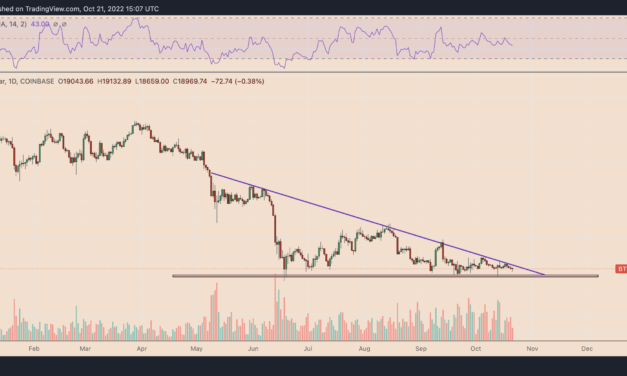
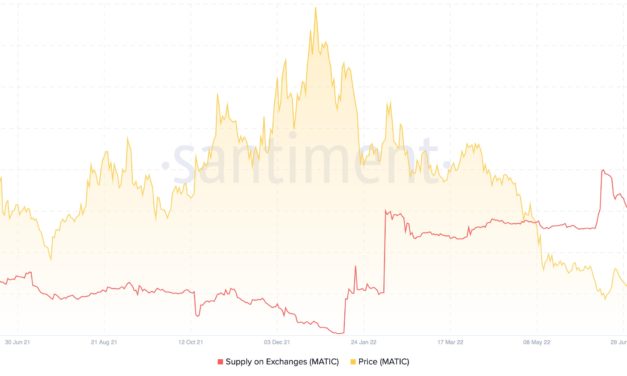
A sharp rebound in the Polygon (MATIC) market in the last four months has increased its price by 200% when measured from its June 2022 bottom of $0.31. And now, the token is showing signs of undergoing another major market rally.MATIC exchange balance hits nine-month lowNotably, the MATIC supply held by all crypto exchanges fell to 802.15 million on Oct. 26, its lowest level since January 2022. The plunge came as a part of a broader downtrend that has witnessed over 600 million MATIC leaving exchanges in the last four months, data on Santiment shows.MATIC balance on exchanges versus price. Source: SantimentA declining crypto balance across exchanges is perceived as bullish by the market since traders typically withdraw their funds from trading platforms when they want to hold the tokens long term.The MATIC chart above shows a similar albeit erratic negative correlation between its price and supply on exchanges. As a result, a period of decline in MATIC reserves at exchanges has historically coincided with an uptrend in price, and vice versa. Therefore, the latest plunge in MATIC supply across exchanges hints at more upside for the token in the coming weeks.Reddit using Polygon to mint collectible NFT avatarsMore cues for a potential MATIC price rally come from the news of Polygon’s adoption by mainstream fintech companies.Notably, Nubank, a Brazilian neobank bank backed by Warren Buffett’s Berkshire Hathaway, picked Polygon to build its native Web3 ecosystem. Since the Oct. 20 announcement, MATIC price has rallied by nearly 12% and was trading for $0.95 as of Oct. 26.Furthermore, the massive MATIC outflow from exchanges coincides with the soaring trading and sales volume of Reddit nonfungible token (NFT) avatars. These digital collectibles are minted as NFTs on the Polygon blockchain.Reddit NFTs sales volumes. Source: Dune AnalyticsFrom a technical perspective, MATIC has broken out of a bullish continuation pattern, dubbed a bull flag, whose profit target sits almost double the token’s current valuation, as shown below.MATIC/USD three-day price chart. Source: TradingViewMATIC also shows similar strength against Bitcoin (BTC), according to a technical setup shared by Kaleo, an independent market analyst.”The predominate structure is a HTF [higher timeframe] flag dating back to May of ’21 that looks ready for another leg higher,” the analyst wrote while citing the chart below.MATIC/BTC daily price chart. Source: TradingView”I’m expecting a small retrace before breaking out / continuing higher,” he added.Related: Bitcoin will shoot over $100K in 2023 before ‘largest bear market’ — TraderThe MATIC/BTC setup could propel the pair to 0.000065 BTC by early 2023 versus the current price of 0.0000458 BTC, a 30% price rally.The views and opinions expressed here are solely those of the author and do not necessarily reflect the views of Cointelegraph.com. Every investment and trading move involves risk, you should conduct your own research when making a decision.

Čítaj viac

Public Bitcoin miners’ hash rate is booming — But is it actually bearish for BTC price?

The share of the Bitcoin (BTC) network controlled by publicly held mining companies could grow to 40% by mid-2023, according to a new report by Hashrate Index. But this could bring more stress to an already bearish BTC market.Public Bitcoin miners’ hash rate jumps 295% in a yearThe outlook appeared after assessing the hash rate performance of Core Scientific, Marathon Digital Holdings, Riot Blockchain and other public miners over the last 12 months. Notably, these firms increased their hashing capacity from 15 exahashes per second a year ago to 58 EH/s in October 2022 — a 295% increase.Bitcoin mining public vs. private hash rate performance. Source: Hashrate IndexIn comparison, the hash rate of private miners increased from 134 EH/s to 177 EH/s in the same period — a 58% growth.“The driving force for the public miners’ rapid capacity increases is that they could access cheap capital during the bull market of 2021,” explained Jaran Mellerud, a Bitcoin mining analyst and the author of the Hashrate Index report.He added that public miners used the money to purchase massive mining rigs. As a result, these firms have tens of thousands of Bitcoin mining rigs in storage, waiting to be plugged in, while awaiting deliveries of more rigs.Core Scientific – the biggest public #bitcoin miner – has a 5% share of the total hashrate. Marathon and Riot follow behind, each controlling over 2% of Bitcoin’s hashrate.In total, there are seven public bitcoin miners with a hashrate share of more than 1%. pic.twitter.com/ZnwsFjvQcy— Jaran Mellerud (@JMellerud) October 24, 2022Thus, the Bitcoin hash rate generated by public miners could continue to increase substantially as more and more new machines come online. On the other hand, private miners couldn’t access the capital to purchase mining rigs. So, the growth of their hash rate contributions may remain slower in comparison, argued Mellerud.Stressed miners could boost Bitcoin sell-off risksIn 2022, Bitcoin miners, in general, have been battered by declining BTC prices, rising energy costs, regulation and growing competition. Public mining firms have rushed to raise capital by issuing additional shares or by taking on more debt, resulting in massive declines in their stock prices.For instance, the Valkyrie Bitcoin Miners ETF, which tracks several major public miners, has plunged 75% since its launch in February.Valkyrie Bitcoin Miners ETF weekly price chart. Source: TradingViewAnother unpopular alternative to raising capital is selling Bitcoin at lower prices. For instance, Core Scientific has dumped 85% of its Bitcoin holdings since the end of March, according to its August update.Related: Kazakhstan among top 3 Bitcoin mining destinations after US and ChinaThe same period witnessed BTC’s price decline by 60% to around $19,500 per coin. In other words, a growing hash rate may boost miners’ need to sell Bitcoin for cash to keep their operations running.“Its an absolute bloodbath,” wrote Marty Bent, founder of Bitcoin media company TFTC, adding:“Bitcoin miners are in a world of hurt right now and the likely outcome is a wave of failures in the coming months as hashrate continues to pump, the price remains flat and as energy prices continue to rise.”BTC/USD weekly price chart. Source: TradingViewMeanwhile, Mellerud said that many public miners will not be able to handle a decline in cash flows, resulting in bankruptcies. As a result, their mining rigs could be auctioned off to private miners.Conversely, public miners’ decisions to increase their capacity may pay off if Bitcoin’s price undergoes a decisive bullish reversal. As Cointelegraph reported, signs of a potential market bottom are already emerging, which would provide relief to miners struggling at current prices.The views and opinions expressed here are solely those of the author and do not necessarily reflect the views of Cointelegraph.com. Every investment and trading move involves risk, you should conduct your own research when making a decision.

Čítaj viac

Warren Buffett-backed neobank picks Polygon for Web3 token — MATIC price eyes 100% rally

The price of Polygon’s MATIC (MATIC) coin could double by the end of 2022 or early 2023 due to a mix of extremely bullish fundamental and technical indicators.Polygon wins high-profile clientsMATIC rose by nearly 6.5% four days after Nubank, a Brazilian fintech company backed by Warren Buffett’s Berkshire Hathaway and Softbank, confirmed that it selected Polygon’s “Supernets technology” for its blockchain and digital token, dubbed Nucoin.“Nubank plans to airdrop the digital token to its customers in the first half of 2023,” the official announcement read, adding: “These tokens will serve as the basis for its customers loyalty rewards program and will have benefits such as discounts and other advantages.”#Polygon is taking @Nubank from #Web2 ➡️ #Web3!In a strategic partnership with Polygon, Nubank is launching its own chain using #PolygonSupernets & thus its digital token Nucoin #onPolygon This move will open the gateway for 70 mn+ Nubank users to the #Web3 space pic.twitter.com/Fu06Vi7IpV— Polygon – MATIC (@0xPolygon) October 19, 2022As a result of the rally, MATIC was changing hands for $0.90 on Oct. 24, its highest level in three weeks.Polygon Supernets is an enterprise-level solution that removes the complexity of blockchain development for companies looking to build their native chains. Interestingly, before Nubank, gaming company GameSwift employed the product to launch its custom blockchain.The growing demand for Polygon products may bring a similar boom for its native token, MATIC, which serves as a utility and staking asset within the Polygon blockchain ecosystem.MATIC eyes bull flag breakoutThe Nubank news surfaces as MATIC paints what appears to be a bullish continuation pattern on its lower-timeframe chart.Dubbed a “bull flag,” the pattern emerges when the price consolidates inside a parallel, descending channel after a strong move upward. As a rule, it resolves after the price breaks out of the range to the upside and rises by as much as the previous uptrend’s height.MATIC/USD 3-day chart featuring bull flag breakout setup. Source: TradingViewTherefore, MATIC’s breakout above the flag’s upper trendline could have it test $1.85 as its primary upside target. In other words, it could see a 100% price rally by the end of 2022 or at the beginning of 2023.Related: 3 reasons why DeFi investors should always look before leapingConversely, a pullback from the flag’s upper trendline could lead MATIC toward the lower trendline near $0.67.The views and opinions expressed here are solely those of the author and do not necessarily reflect the views of Cointelegraph.com. Every investment and trading move involves risk, you should conduct your own research when making a decision.

Čítaj viac

Small Bitcoin investors stop whales from crashing BTC price below $18K

An army of small Bitcoin (BTC) investors has been fighting with their larger counterparts for months to keep the price above $18,000.Bitcoin accumulation strong among fishesNotably, there has been some on-chain divergence between so-called whales (entities that hold more than 1,000 BTC) and fishes (entities that hold relatively smaller amounts of BTC) as Bitcoin continues to fluctuate inside the $18,000-$20,000 area.Bitcoin fishes have been accumulating BTC during the coin’s sideways trend. For instance, the net Bitcoin supply held by addresses with 100-1,000 BTC balance has increased from 3.71 million in June to 3.77 million in October, according to data provided by Glassnode.Bitcoin supply held by entities with 100-1K BTC balance. Source: GlassnodeSimilarly, the supply of Bitcoin held by addresses with a 10-100 BTC balance has also risen from 3 million to 3.15 million in the same period. The trend is similar across the entities holding anything between 0.001 and 10 BTC.Meanwhile, the same period of Bitcoin’s sideways price action has coincided with a decline in BTC supply held by whales. For instance, the Bitcoin supply held by the 1,000-10,000 BTC cohort has dropped from 3.82 million to 3.69 million since June. Bitcoin supply held by entities with balance 1K-10K BTC. Source: GlassnodeAdditionally, the 10,000-100,000 BTC cohort has decreased its Bitcoin holdings from 1.98 million to 1.92 million in the same timeframe. A basic interpretation of the on-chain data mentioned above is that fishes are more confident than whales about a potential Bitcoin price bottom near $18,000. But while these small investors may have been absorbing massive selling pressure created by larger investors, the downside risk is historically greater with a decreasing whale population, as shown below. Number of Bitcoin whales vs. BTC price. Source: GlassnodeInterestingly, one of the few exceptions is when Bitcoin’s reached its all-time high price of $69,000 while the number of whales remained relatively flat. This may suggest that whales are having less influence on the market compared to previous years, particularly as the balance on exchanges continues to hit multi-year lows. BTC correlation with gold risesFishes continue accumulating amid reports that investors are viewing Bitcoin as a safe haven asset all over again.For instance, Alkesh Shah and Andrew Moss, digital strategists at Bank of America, cited Bitcoin’s weakening correlation with U.S. stock indexes and strengthening correspondence to gold’s price moves as a sign that the cryptocurrency is looking to live up to its “digital gold” narrative in the future.Notably, Bitcoin’s 40-day correlation with riskier markets, such as Nasdaq Composite and S&P 500, has been flattening near 0.69 and 0.75, respectively, which are below their record levels from a month ago. On the other hand, its correlation with gold has surged from zero in August to 0.67 in October.BTC/USD and XAU/USD 40-day correlation coefficient. Source: TradingView”A decelerating positive correlation with SPX/QQQ and a rapidly rising correlation with XAU indicate that investors may view Bitcoin as a relative safe haven as macro uncertainty continues and a market bottom remains to be seen,” they wrote.Related: Bitcoin will shoot over $100K in 2023 before ‘largest bear market’ — traderOthers, however, expect Bitcoin’s price will eventually break down below the $18,000-support level. They include independent market analyst Filbfilb who argues that BTC price could drop as low as $10,000, given the tight correlation with risk assets and macroeconomic headwinds.The views and opinions expressed here are solely those of the author and do not necessarily reflect the views of Cointelegraph.com. Every investment and trading move involves risk, you should conduct your own research when making a decision.

Čítaj viac

3 historically accurate Bitcoin on-chain metrics are flashing 'bottom'

Bitcoin (BTC) and other riskier assets slipped on Oct. 21 as traders scrutinized macro indicators that suggest the Federal Reserve would continue to hike rates. Nonetheless, the BTC/USD pair remains rangebound inside the $18,000–$20,000 price range, showing a strong bias conflict in the market.BTC price holding above $18K since JuneNotably, BTC’s price has been unable to dive deeper below $18,000 since it first tested the support level in June 2022. As a result, some analysts believe that the cryptocurrency is bottoming out, given it has already corrected by over 70% from its record high of $69,000, established almost a year ago.BTC/USD daily price chart. Source: TradingView”During the 2018 bear market, BTC saw a max drawdown from peak to trough of 84%, lasting 364 days, while the 2014 cycle lasted longer, bottoming after 407 days,” noted Arcane Research in its weekly crypto market report, adding: “Both bottoms were followed by unusually low volatility.”Bitcoin’s historical drawdowns. Source: Arcane ResearchIn addition, a flurry of widely-watched on-chain Bitcoin indicators also hints at a potential bullish reversal ahead. Let’s look at some of the most historically significant metrics. Bitcoin MVRV-Z ScoreThe MVRV-Z Score assesses Bitcoin’s overbought and oversold statuses based on its market and fair value. Historically, when Bitcoin’s market value crosses the fair value, it indicates a market top (the red zone). Conversely, it indicates a market bottom (the green zone) when the market value crosses below the fair value.Bitcoin MVRV Z-Score. Source: GlassnodeThe MVRV-Z Score has been in the green zone since late June, suggesting Bitcoin is bottoming out.Reserve RiskBitcoin’s Reserve Risk assesses the confidence of the token’s long-term holders relative to its price at the point in time. Historically, a higher Reserve Risk (the red zone) has coincided with market tops, reflecting lower investment confidence at record-high Bitcoin prices.Conversely, higher confidence and a lower Bitcoin price mean a lower Reserve Risk (the green zone), or better risk/reward for investing.Bitcoin Reserve Risk vs. price. Source: GlassnodeBitcoin’s Reserve Risk plunged into the green zone in late June, suggesting that BTC may undergo a strong bullish reversal sooner or later.Bitcoin Puell MultipleThe Puell Multiple reflects the ratio of the daily Bitcoin issuance (in U.S. dollars) and the 365-day moving average of daily issuance value.Related: Bitcoin bear market will last ‘2-3 months max’ — Interview with BTC analyst Philip SwiftHistorical data shows the Bitcoin market bottoming out when the Puell Multiple drops into the green zone defined by the 0.3–0.5 range. Conversely, the market peaks out when the ratio crosses into the 4–8 red zone.Bitcoin Puell Multiple vs. price. Source: GlassnodeAs of October, Bitcoin’s Puell Multiple is inside the green zone, suggesting a potential price reversal ahead to the upside.As Cointelegraph reported, the BTC balance on cryptocurrency exchanges has also fallen to multi-year lows at the fastest pace since June, suggesting that current price levels are becoming an important area of accumulation. The views and opinions expressed here are solely those of the author and do not necessarily reflect the views of Cointelegraph.com. Every investment and trading move involves risk, you should conduct your own research when making a decision.

Čítaj viac

Získaj BONUS 8 € v Bitcoinoch

nakup bitcoin z karty

Registrácia Binance

Burza Binance

Aktuálne kurzy