Autor Cointelegraph By Yashu Gola

Dogecoin trader explains why shorting DOGE now makes sense

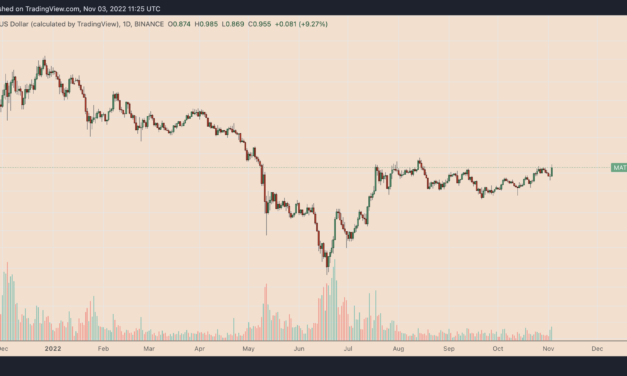
Dogecoin (DOGE) has surged nearly 100% quarter-to-date (QTD) on hopes that Elon Musk would integrate the token onto the Twitter platform. However, DOGE’s potential to continue its uptrend in the coming weeks is low, one popular market analyst argues.Short Dogecoin hard?Independent market analyst GCR said he is moderately short on DOGE based on its price’s recent reaction to a Musk tweet. Notably, DOGE formed a local top at $0.158 on Nov. 1. The same day, Musk shared a picture of his pet Shiba Inu wearing a t-shirt with the Twitter logo. pic.twitter.com/eaIYaDRBnu— Elon Musk (@elonmusk) November 1, 2022GCR argues that the Musk-effect is wearing off when it comes to Dogecoin’s potential integration into Twitter, meaning that most of the gains are already priced in. Therefore, if the actual integration happens, it will likely become a sell-the-news event. dog stock only has 2 bulletsbullet 1 – musk tweeting/teasing about integration; already fired bullet 2 – official integration into twitter; hasn’t shot, but would be sell the news i’m moderate short on doggo, but leaving room open to short harder if they fire 2nd bullet— GCR (@GCRClassic) November 3, 2022

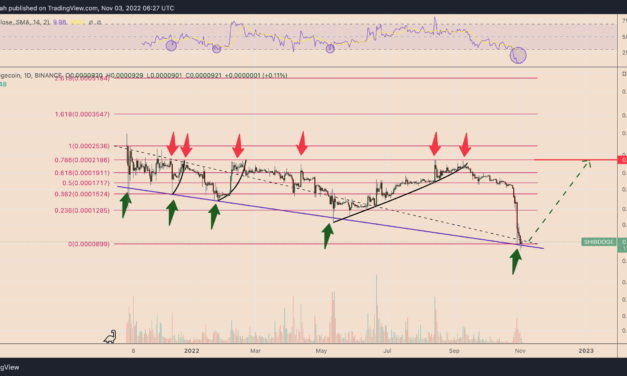
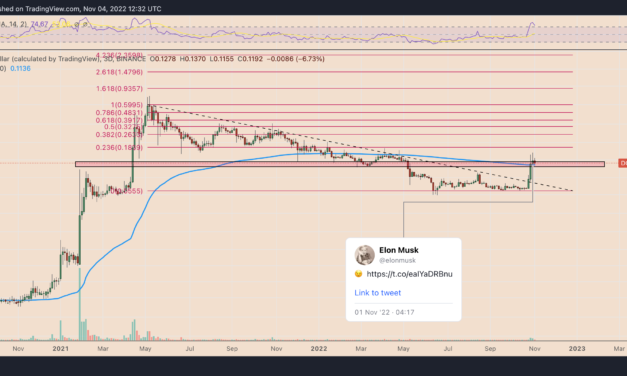
Overbought correction beginsMeanwhile, Dogecoin continued its correction move on Nov. 4, three days after topping out at $0.158.DOGE’s price dropped to as low as $0.115 on Nov. 4, in part due to rumors of Twitter pausing its crypto wallet development project. That brought the token’s net percentage correction from the Nov. 1 local top to nearly 27%.In addition, the downside move surfaced due to its extremely overbought conditions with the highest relative strength index (RSI) since April 2021.DOGE/USD three-day price chart. Source; TradingViewThe correction has prompted Dogecoin price to retest its December 2021-May 2022 support (defined by the $0.108-$0.124 range; the red bar in the chart above) for a potential pullback. The coin may reach $0.185, a level coinciding with its 0.236 Fib line, if the recovery occurs.Conversely, a break below the $0.108-$0.124 range could have DOGE drop to $0.055 as their primary downside target, down 55% from current price levels.DOGE on-chain dataFurthermore, Dogecoin’s on-chain data reveals a consistent drop in key metrics entering November, which could add more sell-pressure.Related: Shiba Inu price drops to record low vs Dogecoin — Will history repeat with a 150% rally?For instance, DOGE’s Twitter-led price rally coincided with a sharp rise in whale transaction count (worth over $100,000), suggesting that they supported the upside move. But after Nov. 1, fewer whales have interacted with the Dogecoin network.Dogecoin whale transaction count. Source: SantimentMeanwhile, the Dogecoin supply distribution across addresses holding between 1,000 and 10 million DOGE tokens has fallen alongside the price. Conversely, the supply controlled by addresses holding more than 10 million DOGE tokens has increased modestly.Dogecoin supply distribution. Source: SantimentIn addition, the addresses holding below 100 DOGE have been increasing, hinting that retail investors have been offsetting whales’ selling pressure to a certain degree.The views and opinions expressed here are solely those of the author and do not necessarily reflect the views of Cointelegraph.com. Every investment and trading move involves risk, you should conduct your own research when making a decision.

Čítaj viac

MATIC price eyes 200% gains on Polygon adoption by Instagram, JPMorgan

Polygon (MATIC) emerged as the best-performing asset among the top-ranking cryptocurrencies on Nov. 3 as the market’s attention turned to the latest Instagram and JPMorgan announcements.Polygon in high-profile partnershipsNotably, Meta, the parent company of Instagram, named Polygon as its initial partner for its upcoming nonfungible token (NFT) tools that allow users to mint, showcase and sell their digital collectibles on and off the social media platform.Meanwhile, banking giant JPMorgan used Polygon to conduct its first live trade (worth about $71,000) on a public blockchain, marking a concrete step toward integrating cryptocurrencies into traditional financial frameworks. MATIC, a utility and staking token within the Polygon blockchain ecosystem, rose over 13% to $0.985 after the announcements, accompanied by an uptick in daily trading volume.MATIC/USD daily price chart. Source: TradingViewMATIC’s upside move came as a part of a broader recovery rally across the crypto sector that started in mid-June. MATIC’s price has rebounded by more than 200%, a trend that will likely sustain in the coming months.MATIC’s price nears cup-and-handle breakoutThe first cue for MATIC’s bullish continuation comes from a classic technical setup.On the daily chart, MATIC has painted a cup-and-handle setup, which comprises a U-shaped recovery followed by a downward drifting channel. The token is now eyeing a decisive breakout above the pattern’s neckline range (the red bar in the chart below) to reach $2.89, its primary upside target.MATIC/USD daily price chart featuring cup-and-handle pattern. Source: TradingViewAs a rule of technical analysis, a cup-and-handle pattern’s target is measured after adding the distance between the cup’s bottom and neckline to the potential breakout point. As a result, MATIC is now eyeing a 200% price rally by the end of Q1 2023.Fundamentally, MATIC’s demand could keep growing, given Polygon’s growing NFT projects launched by mainstream companies. Related: Warren Buffett-backed neobank picks Polygon for Web3 token — MATIC price eyes 100% rallyFor instance, Polygon’s list of prominent NFT partners includes names such as Disney, Robinhood and Starbucks. Furthermore, Polygon had a strong Q3, wherein its number of active wallets reached a record high of 6 million, primarily driven by the launch of Reddit’s NFT marketplace on its blockchain.Polygon NFTs had the strongest Q3 performance in 2022. Source: MessariOn the other hand, macro risks continue to threaten the ongoing crypto market recovery, which may hurt Polygon despite its growing partnerships with big-name brands. That being said, a strong pullback from the cup-and-handle pattern neckline range could invalidate the bullish setup altogether.The views and opinions expressed here are solely those of the author and do not necessarily reflect the views of Cointelegraph.com. Every investment and trading move involves risk, you should conduct your own research when making a decision.

Čítaj viac

Litecoin pre-halving fractal hints at 200% LTC price rally by July 2023

The price of Litecoin (LTC) could skyrocket by up to 200% by July 2023, coinciding with its halving event, reducing miner block rewards by 50%.Litecoin has bottomed out?Litecoin has undergone two halvings since its launch in October 2011. The first one occurred in August 2015, which reduced its block reward from 50 LTC to 25 LTC. The second happened in August 2019, which slashed the 25 LTC reward to 12.5 LTC.Interestingly, each Litecoin halving event occurred after a volatile LTC price cycle, namely an enormous price pump, followed by a similarly massive correction, a price bottom, and recovery to a local top.After the Litecoin halvings, LTCs’ price corrected from its local top, established another bottom, and followed it with another massive price rally to a new record high, as shown below,LTC/USD weekly price chart featuring halving fractals. Source: TheScalpingProLitecoin’s third halving is scheduled to occur sometime in July 2023. Meanwhile, market analysts are already pointing out that LTC’s price is undergoing the same pre-halving trajectory as before the 2011 and 2019 events, now in the bottoming-out stage.The Scalping Pro, an independent market analyst, added a dose of MACD and RSI momentum indicators to support the bullish outlook. Momentum indicators determine an asset’s oversold and overbought conditions to predict potential trend reversals.On a weekly timeframe, LTC’s RSI and MACD have turned extremely oversold, which coincided with market bottoms ahead of the previous halving events. Thus, the analyst considers it a strong cue for another major LTC price rally.#LTC x RSI + MACD (1W) 2/5 Everytime WEEKLY RSI entered the oversold zone with MACD crossover below the zero lineIt has marked #Litecoin bottom historically.Past preformance – 2015 ~ +36246% 2019 ~ +1333% 2022 ~ ??? pic.twitter.com/fRbY4VAkuf— Mags.eth (@thescalpingpro) November 2, 2022Will LTC price reach $180 by July 2023?Litecoin may see a new local top if it has indeed bottomed out near $40 in June 2022.Related: Research report outlines why the crypto market might be on the verge of a reversalDrawing Fibonacci retracement graphs between Litecoin’s pre-halving correction peaks and bottoms highlights the likelihood of testing the 0.236 and 0.382 Fib lines as their upside targets.LTC/USD weekly price chart featuring Fib line targets. Source: TradingViewFor instance, in 2011, Litecoin established its local top at the 0.236 Fib line near $10 in July, six months after bottoming out near $1.31.LTC/USD weekly price chart featuring pre-1st-halving trend. Source: TradingViewIn 2019, LTC price formed its local top at the 0.382 Fib line near $340 in June after bouncing from around $21 in December 2018. LTC/USD weekly price chart featuring pre-2nd-halving trend. Source: TradingViewIn the current scenario, Litecoin’s 0.236 and 0.382 Fib lines coincide with approximately $130 and $180, respectively. LTC/USD weekly price chart featuring pre-3rd-halving trend. Source: TradingViewThese levels could become potential local tops if Litecoin confirms $40 as its bottom. In other words, a 100%-200% price rally by July 2023 when measured from the current price levels.The views and opinions expressed here are solely those of the author and do not necessarily reflect the views of Cointelegraph.com. Every investment and trading move involves risk, you should conduct your own research when making a decision.

Čítaj viac

Shiba Inu price drops to record low vs Dogecoin — Will history repeat with a 150% rally?

Shiba Inu (SHIB) price can rise by nearly 150% versus its top meme-coin rival, Dogecoin (DOGE), in the coming months, based on a technical fractal.SHIB hits record low against DOGEThe bullish setup appears as the SHIB/DOGE pair rebounded slightly after dropping to 0.0000841 — its lowest level ever — on Nov. 1. The price level coincided with a descending trendline that has served as strong support for the pair since November 2021.For instance, Shiba Inu’s previous drop to the said trendline occurred in May 2022, which preceded a 100% recovery rally in the next three months. Similarly, in January 2022, the SHIB/DOGE pair rebounded by more than 50% in less than a month.Interestingly, all the SHIB/DOGE’s rebound moves reached the 0.0002186-0.0002536 range as their primary upside targets. This area coincides with the pair’s 0.786-1 Fib line range, derived from the Fibonacci retracement graph drawn from the 0.0002536 swing high to the 0.0000899 swing low, as shown in the chart below.SHIB/DOGE daily price chart. Source: TradingViewTherefore, SHIB could once again see a sharp bullish reversal versus DOGE if history repeats, with the upside target in the 0.0002186-0.0002536 range. In other words, at least a 150% price rally by Q1 2023.In addition, the pair’s daily relative strength index (RSI) signals extreme oversold conditions after dropping to its lowest levels in history, suggesting that a rebound is likely in the near future. SHIB price risks more losses in USD pairMore cues about an imminent SHIB/DOGE pair rally come from these meme-coins’ individual performances versus the U.S. dollar.Notably, Dogecoin price rallied by more than 100% versus the dollar in October as traders assessed the its potential to become an integral part of Twitter after Elon Musk’s takeover of the social media giant.DOGE/USD three-day price chart. Source: TradingViewThis pushed DOGE’s daily RSI over 95 in late October, the most overbought since April 2021. The coin remains technically overbought as of Nov. 3, hinting at a potential price correction in the coming days. In other words, Dogecoin could drop toward $0.055, or 60% from current price levels, by the end of 2022, as previously reported.On the other hand, Shiba Inu closed October with a 10.5% profit, and as of Nov. 3, its RSI is in the neutral 30-70 zone, suggesting lower sell-side pressure compared to DOGE.Related: 62% of Dogecoin hodlers in profit amid hopes of Twitter integrationNevertheless, the SHIB/USDT pair still risks a 10%-15% short-term price correction to $0.00001088 based on its recent fluctuations inside an ascending triangle range, as shown below.SHIB/USDT three-day price chart. Source: TradingViewMeanwhile, a break below $0.00001088 risks triggering an ascending triangle breakdown. Such breakdowns during a downtrend typically send the price lower by as much as the pattern’s maximum height. $SHIB pic.twitter.com/BL1tIdlTCm— il Capo Of Crypto (@CryptoCapo_) November 1, 2022Therefore, Shiba Inu’s price is in danger of crashing to $0.00000682 should a decisive breakdown occur, a 45% correction by Q1.The views and opinions expressed here are solely those of the author and do not necessarily reflect the views of Cointelegraph.com. Every investment and trading move involves risk, you should conduct your own research when making a decision.

Čítaj viac

Bitcoin price bottom takes shape as ‘old coins’ hit a record 78% of supply

Bitcoin (BTC) and the rest of the crypto market have been in a bear market for almost a year. The top cryptocurrency has seen its market valuation plummet by more than $900 billion in the said period, with macro fundamentals suggesting more pain ahead.Another bear cycle produces more BTC hodlersBut the duration of Bitcoin’s bear market has coincided with a substantial rise in the percentage of BTC’s total supply held by investors for at least six months to one year. Notably, the percentage of coins held for at least a year has risen from nearly 54% on Oct. 28, 2021, to a record high of 66% on Oct. 28, 2022, data shows.Bitcoin hodl waves. Source: Glassnode This evidence suggests that long-term investors are increasingly looking at Bitcoin as a store of value, asserts Charles Edwards, founder of digital asset fund Capriole Investments. “Despite the worst year in stocks and bonds in centuries, Bitcoiners have never held on to more Bitcoin,” the analyst noted while highlighting how the floor and ceiling in Bitcoin held for the long term have been increasing after each cycle.Bitcoin hodl waves featuring long-term BTC holding highs and floors. Source: Glassnode/Capriole InvestmentsHodler data hints at Bitcoin’s price bottomAdditionally, Glassnode’s research shows that the Bitcoin tokens held for at least five to six months are less likely to be sold. The number of these so-called “old coins” typically rises during bear markets, highlighting accumulation by the patient, long-term investors as short-term investors sell.Related: Gold vs. BTC correlation signals Bitcoin becoming safe haven: BofAThe behavioral difference is visible in the chart below, where the downtrend in Bitcoin’s price coincides with a persistent decline in the number of “younger coins” and an increase in the number of coins inactive for at least six months, or “old coins.”Bitcoin’s percent young (red) vs. old (blue) supply. Source: GlassnodeAs of Oct. 31, the old coins comprise nearly 78% of the Bitcoin supply in circulation versus younger coins’ 22%, thus reducing the likelihood of intense sell-offs while forming a potential market bottom. Moreover, on-chain data tracking Bitcoin’s price and its long-term holders’ (LTH) net unrealized profits and losses (NUPL) hints at a similar scenario.Bitcoin entry-adjusted LTH-NUPL. Source: GlassnodeNotably, Bitcoin’s entry-adjusted LTH-NUPL has entered the capitulation zone (red) that has coincided with the end of previous bear markets, as shown above. That includes the strong bullish reversals witnessed in November 2011, January 2015 and December 2018. As Cointelegraph reported, MicroStrategy, the world’s largest corporate holder of Bitcoin, has also reiterated its commitment to continue buying BTC for the long term.“We have a long-term time horizon, and the core business is not impacted by the near-term Bitcoin price fluctuations,” explained MicroStrategy CEO Phong Le. The views and opinions expressed here are solely those of the author and do not necessarily reflect the views of Cointelegraph.com. Every investment and trading move involves risk, you should conduct your own research when making a decision.

Čítaj viac

Získaj BONUS 8 € v Bitcoinoch

nakup bitcoin z karty

Registrácia Binance

Burza Binance

Aktuálne kurzy