Autor Cointelegraph By Yashu Gola

Chainlink eyes 25% rally ahead of LINK staking launch in December

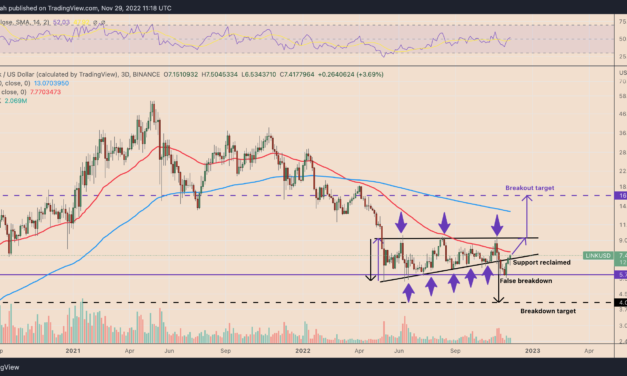
Chainlink (LINK) looks poised for 25% price rally in the days leading up to its staking protocol launch, based on several fundamental and technical facto.Chainlink price rallies ahead of staking launchThe staking feature, which will go live as v0.1 in beta mode on Dec. 6, comes as a part of the so-called “Chainlink Economics 2.0” that focuses on boosting LINK holders’ reward-earning opportunities for “helping increase the crypto economic security” of Chainlink’s oracle services.Earlier, Chainlink users had to launch their own nodes to receive rewards in LINK tokens. The staking feature effectively opens new avenues for them to earn LINK rewards that could, in theory, boost demand for the token.Additionally, demand for LINK’s parent platform Chainlink, as an oracle service provider, should also increase. David Gokhshtein, the founder of blockchain-focused media company Gokhshtein Media, believes it could happen in the wake of the recent FTX collapse.The analyst highlighted how traders have been seeking more clarity on exchanges’ reserves after the FTX fiasco, which can boost demand for oracle services like Chainlink and, in turn, push LINK’s price higher.$LINK is definitely being overlooked. With everything that’s happened and with the new “Proof of Reserves” being pushed out there, ChainLink will be used to push that data out there.— David Gokhshtein (@davidgokhshtein) November 26, 2022Chainlink Labs launched its PoR auditing services to exchanges on Nov. 10.The speculations have helped LINK price rally in recent days. Notably, Chainlink price gained 35.50% eight days after bottoming out locally at around $5.50 — trading for as much as $7.50 on Nov. 29, its highest level in two weeks. The LINK/USD pair now eyes further upside in the near term, price technicals suggest. A failed LINK price breakdownLINK reclaimed its multi-week rising support trendline on Nov. 29, three weeks after losing it in the wake of the FTX-led market selloff.In doing so, the Chainlink token also invalidated its prevailing ascending triangle breakdown setup toward $4. It now trades inside the pattern’s range, eyeing a rally toward the upper trendline near $9.40, up 25% from the current price levels, by the second week of December, as shown below.LINK/USD three-day price chart. Source: TradingViewMichaël van de Poppe, market analyst and founder of Eight Global, also anticipates LINK to hit or cross above $9#Chainlink showing a ton of strength, also expecting continuation there to happen.If I didn’t have a long yet (but I do), then I’d be targeting for something like this in which I’d be looking at $9 area for a TP. pic.twitter.com/rRdv4eL91H— Michaël van de Poppe (@CryptoMichNL) November 29, 2022

Moreover, a bullish continuation move above the $9.40 resistance could have LINK eye $16 next, the ascending triangle breakout target. Related: Binance publishes official Merkle Tree-based proof of reservesConversely, slipping below the triangle’s lower trendline again risks bringing the breakdown setup toward $4 back in play, down about 45% from current prices.This article does not contain investment advice or recommendations. Every investment and trading move involves risk, and readers should conduct their own research when making a decision.

Čítaj viac

Tether vs. USD Coin on-chain data reveals two very different stablecoins

USD Coin (USDC), a stablecoin issued by the U.S.-based Circle Financials Ltd, is taking the lead over its top rival, Tether (USDT), when it comes to institutional adoption, according to on-chain data.USDC daily transfer volumes are higherThe market capitalization of USDC tokens in circulation comes to be around $44 billion versus USDT’s $65.42 billion. However, USDC’s daily transfer value on the Ethereum blockchain has been consistently higher than USDT throughout 2022, data from Glassnode shows.For instance, as of Nov. 22, the USDC daily transfer was around $14 billion compared to USDT’s $5 billion.USDC vs. USDT daily transfer volume. Source: GlassnodeIn other words, USDC users engage in relatively higher capital transfers compared to USDT users, suggesting that USDC is increasingly the stablecoin of choice among high net-worth entities including institutional whales, hedge funds, family offices, crypto exchanges, etc.Related: 82% of Tether reserves held in ‘extremely liquid’ assets, according to attestationFurthermore, USDC leads USDT in terms of its supply weight across smart contracts as of Nov. 22. Notably, the former made up 33.75% of the total stablecoin supply locked across staking pools. In comparison, USDT’s supply is around 12.50%.USDC vs. USDC supply in smart contracts. Source: GlassnodeBut the higher daily transaction count versus USDC suggests that Tether is more likely used for retail trading and transfers such as remittances.USDC vs. USDT daily transaction count. Source: Glassnode On the other hand, USDC appears like a top stablecoin choice for tech-savvy institutional traders that lock their funds in staking contracts to earn yield. This is further reflected in USDC’s lower daily active addresses count of 40,245 versus USDT’s 73,000, as recorded on Nov. 21.USDC vs. USDT daily active addresses. Source: GlassnodeAdditionally, crypto trading platforms implementing so-called “proof-of-reserves” after the FTX collapse appear to hold more Tether over the USD Coin, further signaling that USDT is likely more popular among retail traders.These exchanges include Binance, KuCoin, BitFinex, ByBit, OKEx, and Huobi. Crypto.com’s reserves are the exception with more USDC than USDT.Crypto.com’s proof of reserves. Source: CoinMarketCap.comTether market cap dips after FTX collapseThe market capitalization of USDT dropped by nearly $4 billion after the FTX exchange collapse nearly two weeks ago.The reason may be due to Tether briefly veering off from its $1 valuation, hitting 96 cents on Nov. 10, after it froze $46 million worth of USDT tokens associated with FTX. Interestingly, the USDC market cap rose by nearly $2 billion after Nov. 10 when the FTX fiasco began.USDT vs. USDC market cap performance in the last six months. Source: MessariTether has a history of breaking its dollar peg during extreme market stress albeit to a lesser degree in recent years. For instance, the token dropped below 95 cents during the crypto market selloff in May, coinciding with a spike in USDC’s market cap. This suggests that some investors moved their capital from Tether to USD Coin as the former lost its dollar peg, as shown below.USDT/USDC three-day price chart. Source: TradingViewHowever, Tether returned to dollar parity within a few days, asserting that the tokens in circulation are backed 100% by reserves and pegged 1-to-1 with dollars. This article does not contain investment advice or recommendations. Every investment and trading move involves risk, and readers should conduct their own research when making a decision.

Čítaj viac

Litecoin hits fresh 2022 high versus Bitcoin — But will LTC price 'halve' before the halving?

Litecoin (LTC) has emerged as one of the rare winners in the ongoing cryptocurrency market meltdown led by the FTX exchange’s collapse.LTC price outperforms BTC, ETThe 2011-born altcoin rallied nearly 16% month-to-date (MTD) to reach $62.75 on Nov. 22, outperforming its top rivals, Bitcoin (BTC) and Ether (ETH), which lo approximately 25% and 30%, respectively, in the same period.LTC/USD daily price chart. Source: TradingViewFurthermore, the LTC/BTC price also rallied to new heights, gaining 50% in November to establish a new yearly high of 0.003970 BTC on Nov. 22. As Cointelegraph reported, Litecoin diverged from the broader cryptocurrency market downtrend earlier this month with its halving slated for August 2023. LTC has also received an endorsement from none other than Michael Saylor for being a Bitcoin-like “digital commodity.” Michael Saylor says #Litecoin is also likely a digital commodity like Bitcoin: pic.twitter.com/7N19IpxtSe— Altcoin Daily (@AltcoinDailyio) November 18, 2022Nonetheless, signs of bullish exhaustion are emerging.Litecoin price fractal hints at 50% correctionLitecoin’s rally versus Bitcoin has made the LTC/BTC pai overvalued, according to its weekly relative strength index (RSI) reading.Notably, LTC/BTC’s weekly RSI, which measures the pair’s speed and change of price movements, surged above 70 on Nov. 22. An RSI reading above 70 is considered overbought, which many traditional analysts see as a sign of an impending bearish reversal.Historically, Litecoin’s overbought RSI readings versus Bitcoin have been followed by major price corrections. For instance, in April 2021, the LTC/BTC RSI’s climb above 70 met with a strong selloff reaction, eventually pushing the pair down by 75% to 0.001716 BTC by June 2022.Similarly, an overbought RSI in April 2019 led to a 70% LTC/BTC price correction by December 2019. The same RSI fractal now hints at Litecoin’s possibility of undergoing a 50% wipeout versus Bitcoin if coupled with LTC/BTC’s multi-year descending channel pattern, as shown below.LTC/BTC weekly price chart. Source: TradingViewTypicalLTC/BTC turns overbought after hitting the channel’s upper trendline, which follows up with a correction toward the lower trendline. As a result, the pair risks a drop to or below 0.001797 BTC by December 2022 if the fractal repeats, down more than 50% from the current price levels. Conversely, a decisive breakout above the upper trendline could have LTC/BTC test its 200-week exponential moving average (200-week EMA; the blue wave) at 0.005319 BTC, up 30% from current price levels, as the next upside target.LTC/USD pair “bear flag” Litecoin eyes a similar price crash versus the U.S. dollar as it paints a bear flag pattern on the weekly charts.Related: Cathie Wood’s ARK Invest adds more Bitcoin exposure as GBTC, Coinbase stock hit new lowsBear flags are bearish continuation patterns that appear when the price consolidates higher inside a parallel, ascending channel range after a strong move lower (called flagpole). They resolve after the price breaks below the lower trendline and falls by as much as the flagpole’s height.LTC/USD weekly price chart. Source: TradingViewLTC has been trading inside the bear flag range, eyeing a breakdown below its lower trendline support of around $55. The bear flag downside target is around $32.40 if it breaks decisively below the said support.In other words, a 50% decline by December 2022.This article does not contain investment advice or recommendations. Every investment and trading move involves risk, and readers should conduct their own research when making a decision.

Čítaj viac

Serum price soars 140% in one week amid FTX 'exit pump' fears

Serum, a “decentralized exchange” on the Solana blockchain, has performed exceptionally well in terms of its SRM token price, despite it ties to the defunct FTX exchange.SRM price up 140% in one weekOn the daily chart, the SRM/USD pair has gained 140% in the last seven days, hitting $0.319 on Nov. 21 versus $0.177 on Nov. 14. This pushed the circulating market cap to about $73 million and “fully diluted market cap,” the market cap if the maximum supply was in circulation, to nearly $2.8 billion.SRM/USD daily price chart. Source: TradingView”Closer to zero”SRM price rallied despite the ongoing delisting of Serum trading pairs across major cryptocurrency exchanges, including Binance, OKEx, Gate.io, and Phemex, thus raising fears about an ongoing “exit pump.”Exit pumps are when large investors pump the token’s price in a low-liquidity environment to attract new buyers, only to then dump their entire holdings on amateur investors as witnessed with numerous pump-and-dump schemes.Hahah. This pump here, is meant to trap anybody in a position on kucoin $SRM because it’s getting delisted TOMORROW. Maybe now. pic.twitter.com/fVVYumSkNA— IcZ 64 ♣️Geиo Analysis ♠️ (@IcZeno) November 15, 2022Distrust in Serum has grown due to its troubling exposure to FTX. In a Nov. 11 bankruptcy filing, a leaked balance sheet revealed that FTX had $8 billion in liabilities against a reserve mostly comprised of illiquid assets, including SRM.Notably, FTX showed about $5.4 billion worth of SRM tokens in its reserves, or almost 97% of Serum’s total market cap, including the circulating and fully-diluted supply.As a result, the token’s exposure to FTX has raised the possibility of a major selloff. “If FTX had attempted to sell them into the market over the course of a week or month or year, it would have swamped the market and crashed the price,” noted Matt Levine, Bloomberg’s Opinion Columnist, adding: “Perhaps it could have gotten a few hundred million dollars for them. But I think a realistic valuation of that huge stash of Serum would be closer to zero. That is not a comment on Serum; it’s a comment on the size of the stash.”Serum community forks to cut ties with FTXThe SRM price rally in the past seven days coincided with efforts to distance Serum from FTX.Serum’s key backers threw their weight behind an emergency “community fork” after wallets associated with FTX saw suspicious outflows worth $266.3 million on Nov. 11. Brain Long, one of the popular validators on Solana, noted that the fork had renewed the market’s sentiment in SRM.Open Source + Order Book = Open Book. The name also suggests transparency.Post other ideas below. Also, post some #BadNamesOnly for humor. ;-)— Brian Long | Block Logic | Triton One ☀️ (@brianlong) November 15, 2022

Still, Serum’s fork has failed to attract fresh capital toward its liquidity pools. As of Nov. 21, the total-value-locked inside Serum’s reserves was a mere 33,900 SOL compared to 3.3 million SOL at the start of the month.Serum total-value-locked as of Nov. 21. Source: Defi LlamaSerum price collapse ahead?From a technical perspective, SRM stares at the possibility of undergoing massive selloffs in the coming weeks.The bearish argument stems from a descending triangle setup on its daily chart, which suggests more declines ahead if coupled with the previous SRM price downtrend. Descending Triangle patterns are trend continuation setups. Related: Not just FTX Token: Solana price nukes 40% along with other ‘Sam coins’Hence, SRM now eyes a potential breakdown below the triangle’s lower trendline near $0.234. A successful break below the said support would risk sending the price toward the level at length equal to the maximum distance between the triangle’s upper and lower trendline.In other words, SRM price risks crashing to $0.10, or by 65%, by December 2022. Conversely, a breakout above the triangle’s upper trendline near $0.30 could have the token test its 50-day exponential moving average (50-day EMA; the red wave) at $0.56 as its next key upside target.This article does not contain investment advice or recommendations. Every investment and trading move involves risk, and readers should conduct their own research when making a decision.

Čítaj viac

Spain for the win? Top 3 fan tokens to watch during the FIFA World Cup

The FIFA World Cup in Qatar is boosting the value of national soccer team fan tokens despite the cryptocurrency bear market.World Cup Qatar hype boosts fan token pricesThese digital fan tokens are currently rallying despite the cryptocurrency market downturn, securing up to 170% gains from the Nov. 10 lows. At the core of the massive uptrend is the World Cup, which will be held from Nov. 20 to Dec. 18 in Qatar.Fan tokens are cryptocurrencies that enable fans to engage with and participate in their favorite team’s decisions. Moreover, they create new sponsorship opportunities for sports clubs and national squads outside of traditional revenue sources.Here’s a brief overview of the top gainers in the fan token sector, alongside their technical outlook during the course of the World Cup.Spain National Football Team Fan Token (SNFT)The Spain National Football Team Fan Token (SNFT) emerged as the top gainer in the sports token section, rising 170% to a high of $0.54 on Nov. 19, nine days after bottoming out at $0.20.SNFT/USD daily price chart. Source: TradingViewSNFT’s outperformance versus other fan crypto tokens may reflect the Spanish football team’s higher odds of winning the World Cup in 2022. But in traditional terms, Spain’s odds of winning the trophy is +800, meaning betting $100 would yield $800, according to Vegas Insider.From a technical perspective, SNFT trades inside a neutral zone, as confirmed by its daily relative strength index (RSI) at around 58, below its overbought threshold of 70.In other words, SNFT shows potential to continue its rally during the World Cup and its price should reflect how the Spain National Football team performs.For instance, back-to-back wins for Spain may stretch SNFT’s valuation above its current resistance level of $0.538 for a potential run-up toward its record high near $0.718, as shown in the four-hour chart below. SNFT/USD four-hour price chart. Source: TradingViewConversely, a pullback from $0.538 could have SNFT eye a correction toward $0.412, down about 18% from today’s price.Spain will next play Costa Rica on Nov. 23 in the Group E category, followed by a standoff against Germany on Nov. 28.Brazil National Football Team Fan Token (BFT)The Brazil National Football Team Fan Token (BFT) appears to be the crypto market’s second favorite fan token. Its price has rallied 130% in just nine days, from $0.45 on Nov. 10 to over $1 on Nov. 19. BFT/USD daily price chart. Source: TradingViewBrazil is the favorite to win the World Cup this year with +350 odds in traditional betting circles, meaning a $100 bet would return $350. That could serve as a fundamental factor behind BFT’s growth in the coming weeks, given the token still has room to run based on its neutral daily RSI.As of Nov. 19, BFT eyes a breakout above $1.05, its current resistance level, toward its short-term upside target at around $1.16. An extended rally could occur if Brazil wins the World Cup on Dec. 18, paving the path toward $1.31, up 25% from today’s price.Related: Metaverse community with 3M users adds utility with FIFA World Cup 2022™ collaborationConversely, a pullback would risk sending BFT toward $0.82, its October 2022 support level.Brazil’s first match is against Serbia on Nov. 25 in Group G, followed by a standoff against Switzerland on Nov. 28.Portugal National Team Fan Token (POR)The Portugal National Team Fan Token (POR) is the third-best performer in the ongoing fan token boom, rising about 100% to $6 on Nov. 19, nine days after hitting lows of $3.10.POR/USDT daily price chart. Source: TradingViewTraditional bookies measure Portugal’s odds of winning the World Cup at +1600, meaning betting $100 would yield about $1,600.POR now tests $6 as its resistance, with its daily RSI near 64, just six points below its overbought threshold. A decisive pullback from the said price ceiling could have POR eye a correction toward $4.80, its support level from September-October 2022.Conversely, continued success in the World Cup for Portugal may flip the scenario to bullish, leading POR above its $6-resistance to eye a rally toward or above $7.The views and opinions expressed here are solely those of the author and do not necessarily reflect the views of Cointelegraph.com. Every investment and trading move involves risk, you should conduct your own research when making a decision.

Čítaj viac

Získaj BONUS 8 € v Bitcoinoch

nakup bitcoin z karty

Registrácia Binance

Burza Binance

Aktuálne kurzy