Bitcoin is beating Warren Buffett’s 'crypto bet' in 2023
Bitcoin’s rebound in 2023 has also seen Coinbase stock gaining over 100% year-to-date, boosting Cathie Wood’s ARK portfolio.
Čítaj viac
Bitcoin’s rebound in 2023 has also seen Coinbase stock gaining over 100% year-to-date, boosting Cathie Wood’s ARK portfolio.
Čítaj viac
JOMO is that “I-was-right-about-the-market” joyful feeling after narrowly escaping a bad trade and potentially catastrophic losses.
Čítaj viac JOMO is that “I-was-right-about-the-market” joyful feeling after narrowly escaping a bad trade and potentially catastrophic losses.
Čítaj viac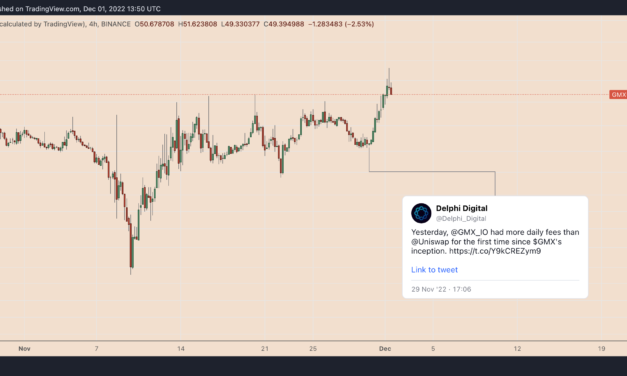
The price of GMX rallied to its second-highest level in history on Dec. 1 as traders assessed the decentralized exchange’s ability to evolve as a serious competitor to its top rival Uniswap (UNI).GMX established an intraday high of $54.50 in a recovery that started on Nov. 29 from $40.50. Its rally’s beginning coincided with crypto research firm Delphi Digital’s tweet on the GMX decentralized exchange, as shown below. GMX/USD four-hour price chart. Source: TradingViewGMX beats Uniswap in fees for the first timeNotably, GMX had earned about $1.15 million in daily trading fees on Nov. 28, which surpassed Uniswap’s $1.06 million trading fees on the same day.GMX Flipped Uniswap in Daily Fees on Nov. 28. Source: Delphi DigitalThis seemingly renewed buying sentiment in the GMX market, helping its price rally 35% to $54.50 afterward.Moreover, GMX also benefited from the growing discontent against centralized exchanges in the wake of the FTX collapse. The decentralized exchange’s revenue rose by 107% to $5 million in November, boosted by a 128% increase in annualized trading volume and a 31% rise in daily active users.GMX exchange’s financial data. Source: Token TerminalIn comparison, Uniswap’s annualized revenue increased by about 75% and daily active users by 8%. Independent market analyst Zen noted that GMX’s outperformance could have stemmed from its token holders receiving a good portion of all trading fees — about 30%, according to GMX’s official declaration. On the other hand, the holders of Uniswap’s native token UNI do not receive shares from the platform’s trading fees.”[GMX is] an obvious buy and hold during this bear market,” Zen added, saying that it is “consistently the second highest earning protocol after Uniswap.” Excerpts: “Leverage trading becomes dominant during bear markets. FTX and Bybit grew a lot last time. Expecting [a] similar story here. No big FDV overhang.”GMX price technicals tilt bearishFrom a technical analysis perspective, GMX’s ongoing bull run risks exhaustion in the coming days. Related: FTX’s collapse could change crypto industry governance standards for goodOn the daily chart, GMX’s price tests its multi-month ascending trendline resistance for a potential pullback, based on its previous corrections after testing the same trendline. In doing so, the token eyes a decline toward the ascending trendline support. GMX/USD daily price chart. Source: TradingViewAs of Dec. 1, GMX faced an increase in selling pressure near the trendline resistance at around $53. The GMX/USD pair could drop to the current trendline support near $42, which coincides with its 50-day exponential moving average (50-day EMA; the red wave) and its 0.618 Fib line.In other words, GMX could drop by nearly 20% from its current price levels by the end of 2022.This article does not contain investment advice or recommendations. Every investment and trading move involves risk, and readers should conduct their own research when making a decision.
Čítaj viac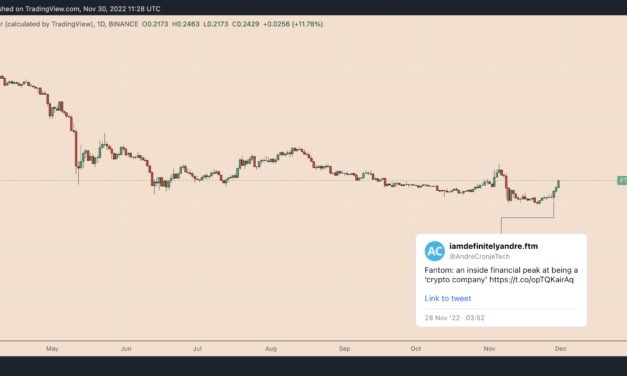
Fantom (FTM) continued its upward momentum on Nov. 30 amid reports that the Fantom Foundation generates consistent profits and has 30 years of runway without having to sell any FTM tokens. Fantom’s FTM holdings up from 3% to 14%FTM price gained nearly 13.5% to reach $0.24, its highest level in three weeks. The rally came as a part of a broader rebound trend that started when it bottomed out at around $0.17 on Nov. 22. This amounts to a 50% price rebound in the last eight days. Interestingly, the rally picked up momentum after the Fantom Foundation’s “Architect,” Andre Cronje, released the firm’s financial records on Nov. 28, revealing that it had $340 million worth of digital assets and had been earning over $10 million annually. Notably: Nov 2022 — Over 450,000,000 FTM, > $100,000,000 in stables, > $100,000,000 in crypto assets, $50,000,000 in non-crypto assets. Salary burn rate $7,000,000 / year. We have ~30 years left (without having to touch FTM)FTM/USD daily price chart. Source: TradingViewCertain crypto and blockchain projects have suffered due to their potential exposure to failing companies. For instance, the collapse of the FTX crypto exchange triggered major price declines in Solana (SOL) and its associated project tokens, such as Serum (SRM). FTX and its sister firm Alameda Research were Solana ecosystem’s major supporters.Solana ecosystem performance in different timeframes. Source: MessariIn February 2021, Alameda also purchased $35 million worth of FTM tokens to become a validator on the Fantom blockchain. This exposure may have been a key factor behind FTM’s underperformance in the early days of November, wherein its price declined by as much as 35%.Cronje downplayed any connection with FTX/Alameda, explaining that being a validator does not make one part of the foundation.”Unlike most of our competitors, the foundation owns a relatively small amount of FTM,” he wrote, adding: “Most comparable L1s own between 50% — 80% of their token supply. At launch, Fantom owned less than 3%. Today, we own more than 14%. We prefer buying our tokens; we don’t ‘sell’ our tokens for ‘partnerships.’Cronje also revealed that Fantom passed on further cooperation with Alameda in January 2022. FTM whales and fishes accumulateFantom’s on-chain data reveals that addresses holding more than 1 million FTM have been distributing the tokens during the FTX-led crypto market decline.On the other hand, the supply of Fantom tokens held by addresses with a balance between 1 and 1 million FTM increased in November, suggesting strong accumulation among the network’s richest (whales) and poorest (fishes) investors.Fantom supply distribution among addresses with a 1-infinity FTM balance. Source: Santiment In other words, these investors anticipate FTM to undergo a strong price recovery in the future.Related: Learn from FTX and stop investing in speculationTechnicals support the bullish outlook to a certain degree. FTM price now eyes a nearly 20% rally toward $0.30, which coincides with the token’s prevailing descending channel’s upper trendline and its 50-3D exponential moving average (50-3D EMA; the red wave), as shown below.FTM/USD three-day price chart. Source: TradingViewConversely, testing $0.30 as resistance could have FTM eye a strong pullback toward the descending channel’s lower trendline near $0.16, which has also served as support in July 2021, or a 30% price decline from today’s levels.This article does not contain investment advice or recommendations. Every investment and trading move involves risk, and readers should conduct their own research when making a decision.
Čítaj viac
