Autor Cointelegraph By William Suberg

No flexing for Bitcoin Cash users as BCH loses 98% against Bitcoin

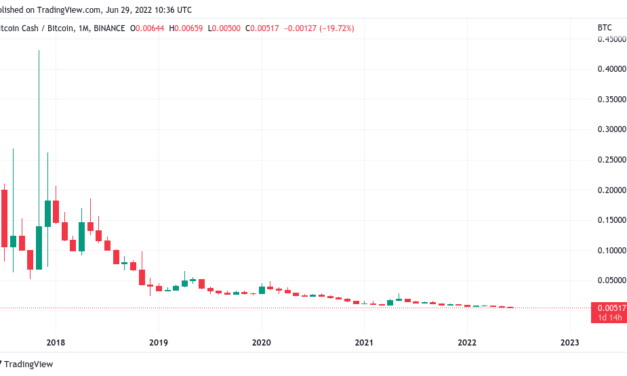
Bitcoin (BTC) has hit new record highs this week — not in U.S. dollar terms, but against its longtime competitor, Bitcoin Cash (BCH).Data from Cointelegraph Markets Pro and TradingView confirms that on June 29, BCH/BTC officially set its lowest ever price.CoinFLEX debacle ensnares BCH supporter VerBitcoin Cash, also known as “Bcash” by those critical of the coin’s ethos and future, gained notoriety in 2017 when it became the first major hard fork of the Bitcoin network to take on BTC itself.Months after launching, the altcoin hit highs of around 0.43 BTC per token, this proving something of a fakeout for investors who have spent the intervening period watching its value steadily decline.Arguably the most vocal BCH supporter, entrepreneur Roger Ver, has nonetheless continued to tout its supremacy over Bitcoin, with price woes having little impact on his rhetoric.This month, however, Ver courted controversy when reports emerged that he owed $47 million in stablecoin USD Coin (USDC) to crypto investment platform CoinFLEX.Ver denies the claims, with a social media storm ensuing which is ongoing this week. Regardless of the outcome, its impact on BCH has been palpable. On June 29, BCH/BTC fell to new all-time lows of just 0.005 — 98.83% below its 2017 peak.BCH/BTC 1-month candle chart (Binance). Source: TradingViewThe event was not lost on commentators, many of whom remembered Ver’s insistence that BCH would rise to replace BTC altogether.$BCH now lower than it was in the winter of 2018-2019.— Alex Krüger (@krugermacro) June 28, 2022How it started vs. How it’s going:(Roger Ver / BCH edition) pic.twitter.com/kNcRjsujhU— K A L E O (@CryptoKaleo) June 28, 2022

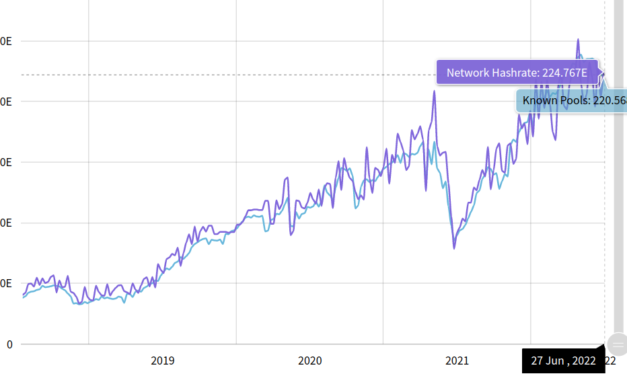
Even Bitcoin SV outperforms BCHFor another vehement anti-Bitcoin spin-off, the situation is barely any better.Related: Bitcoin’s bottom might not be in, but miners say it ‘has always made gains over any 4-year period’Bitcoin SV (BSV), the offspring of BCH which emerged during community infighting, hit all-time lows of its own against BTC in May.Since then, a modest rebound has occurred, taking BSV/BTC to 0.0016 BTC — a mere 94.48% below its all-time high of 0.029 BTC seen at the start of 2020.BSV/BTC 1-month candle chart (Binance). Source: TradingViewOn the plus side, BSV now buys more BCH than at any time since December of that year.BSV/BCH 1-week candle chart (Binance). Source: TradingViewThe views and opinions expressed here are solely those of the author and do not necessarily reflect the views of Cointelegraph.com. Every investment and trading move involves risk, you should conduct your own research when making a decision.

Čítaj viac

Bitcoin price limps under $20K as Asia extends global stocks weakness

Bitcoin (BTC) returned under $20,000 on June 29 as analysts stayed hopeful of a trip higher.BTC/USD 1-hour candle chart (Bitstamp). Source: TradingViewTraders looks to $19,500 for supportData from Cointelegraph Markets Pro and TradingView followed BTC/USD as it crossed below the $20,000 mark for the first time in nearly a week in Asian trading hours.The weakness followed rangebound behavior near $21,000, this characterizing a market still in tune with moves in global equities.The S&P 500 had finished its previous session down 2%, while the Nasdaq Composite Index lost 3%. On the day, Hong Kong’s Hang Seng was likewise 2.1% lower, while China’s Shanghai Composite Index traded down 1.4%.With few bullish cues coming from macro, Bitcoin thus had little stopping it from revisiting the lower end of a range in place for several weeks.“Bitcoin is giving that correction, was anticipating a potential low at $20.3K,” Cointelegraph contributor Michaël van de Poppe wrote in part of his latest Bitcoin-focused Twitter update. “We get $20.1K as that’s the second important one… Would like to see it hold here and see additional confirmation on LTF. If it doesn’t, $19.3-19.5K next for support.”Zooming out, other sources were still optimistic about the potential for an assault on resistance further up.For on-chain analytics resource Material Indicators, this could still come in the form of challenging the 200-week moving average, a key bear market support level, which had begun to function as resistance in June.Trend Precognition is flashing a pretty strong Long signal on the #BTC Weekly chart. Signal won’t print until the W candle closes, but indicates that we could see a run at the 200 WMA this week. Happy to test the lows first. For me, sub $17.5k invalidates. #NFA pic.twitter.com/hvs1as44qG— Material Indicators (@MI_Algos) June 28, 2022Stocks continue downhillFocusing on macro, commentators argued that with little certainty about economic strength available, risk assets such as crypto would continue to suffer on longer timeframes.Related: 3 charts showing this Bitcoin price drop is unlike summer 2021The mood followed a prediction from Big Short investor Michael J. Burry that the U.S. Federal Reserve would abandon its inflation-busting quantitative tightening (QT) policy in 2022 and return to more accommodative conditions.“Deflationary pulses from this- – > disinflation in CPI later this year — > Fed reverses itself on rates and QT — > Cycles,” part of a tweet published June 27 reads.Only a clear boon for risk assets would therefore cut Bitcoin and altcoins some slack, popular Twitter account TXMC Trades responded, this perspective echoing views of various commentators including former BitMEX CEO, Arthur Hayes.Despite the dreams of decouploors, #Bitcoin is unlikely to grow in a sustained way unless the economy also shows significant improvement, as they are undeniably linked.With regional data slipping toward contraction, the near term path remains unattractive. https://t.co/qpuPsYm07P pic.twitter.com/WT3TjKHiKD— TXMC (@TXMCtrades) June 28, 2022

The views and opinions expressed here are solely those of the author and do not necessarily reflect the views of Cointelegraph.com. Every investment and trading move involves risk, you should conduct your own research when making a decision.

Čítaj viac

Different this time? 'Almost all' Bitcoin metrics are now hinting at a price bottom

Bitcoin (BTC) played wait-and-see with traders on June 28 as Wall Street opened to flat performance.BTC/USD 1-hour candle chart (Bitstamp). Source: TradingViewBollinger eyes “logical place” for Bitcoin bottomData from Cointelegraph Markets Pro and TradingView showed BTC/USD circling $21,000 on Bitstamp, refusing to commit to a firm trend.The pair nonetheless avoided fresh signs of weakness, leading Cointelegraph contributor Michaël van de Poppe to believe that an attack on important levels — notably the 200-week moving average near $22,400 — could be next. #Bitcoin bounced upwards after sweeping the lows at $20.6K.Honestly, was expecting a further correction towards $20.3K. Still long on my positions on $FTM, $ADA, $AVAX & $ETH, as I’m still assuming we’ll see continuation towards $22.4K and possibly $23.1K. pic.twitter.com/dbwYQiuZZL— Michaël van de Poppe (@CryptoMichNL) June 28, 2022″In the past, Bitcoin has been a steal under its realized price, i.e., aggregate cost basis of all coins in supply. The realized price is currently sitting at around $22,500,” popular trading account Game of Trades added.While few expected a clear bullish trend to emerge, long-term perspectives also placed importance on current price levels.Among them was John Bollinger, creator of the Bollinger bands volatility indicator, who in a fresh take on BTC/USD flagged the culmination of a trend years in the making. The next move, he suggested, could well be higher after a “picture perfect” double top pattern on Bitcoin in 2021.Picture perfect double (M-type) top in BTCUSD on the monthly chart complete with confirmation by BandWidth and %b leads to a tag of the lower Bollinger Band. No sign of one yet, but this would be a logical place to put in a bottom.https://t.co/KsDyQsCO1F— John Bollinger (@bbands) June 27, 2022

Research: “Almost all” Bitcoin metrics at all-time lowsFurther analysis of whether the bottom is in for Bitcoin came from on-chain analytics firm Glassnode as the week began.Related: 3 charts showing this Bitcoin price drop is unlike summer 2021In its latest weekly newsletter, “The Week On-Chain,” Glassnode dissected a raft of on-chain metrics in various stages of signaling a bottom formation.In an unprecedented macro environment, however, nothing was certain.”Within the current macroeconomic framework, all models and historical precedents are likely to be put to the test,” it concluded. “Based on the current positioning of Bitcoin prices relative to historical floor models, the market is already at an extremely improbable level, with only 0.2% of trading days being in similar circumstances.”It noted that those who had bought BTC in 2020 and 2021 had provided the driving force behind recent selling.”Almost all macro indicators for Bitcoin, ranging from technical to on-chain, are at all-time lows, coincident with bear market floor formation in previous cycles. Many are trading at levels with just single-digit percentage points of prior history at similar levels,” the newsletter added.Sentiment was no different on the day, with the Crypto Fear & Greed Index at 10/100 or “extreme fear,” also constituting a classic reversal level in bear markets gone by.Crypto Fear & Greed Index (screenshot). Source: Alternative.meThe views and opinions expressed here are solely those of the author and do not necessarily reflect the views of Cointelegraph.com. Every investment and trading move involves risk, you should conduct your own research when making a decision.

Čítaj viac

3 charts showing this Bitcoin price drop is unlike summer 2021

Bitcoin (BTC) bear markets come in many shapes and sizes, but this one has given many reason to panic.BTC has been described as facing “a bear of historic proportions” in 2022, but just one year ago, a similar feeling of doom swept crypto markets as Bitcoin saw a 50% drawdown in weeks.Beyond price, however, 2022 on-chain data looks wildly different. Cointelegraph takes a look at three key metrics demonstrating how this Bitcoin bear market is not like the last.Hash rateEveryone remembers the Bitcoin miner exodus from China, which effectively banned the practice in one of its most prolific areas.While the extent of the ban has since come under suspicion, the move at the time saw huge numbers of network participants relocate — mostly to the United States — in a matter of weeks. As a result, Bitcoin’s network hash rate — the computing power dedicated to mining — roughly halved. At the time, this was unprecedented, while miners felt that they had no choice but at least temporarily to cease operations.This time around, it is not red tape but simple math threatening miners. The BTC price dip to 19-month lows has put mounting pressure on the profitability of mining operations. As Cointelegraph reported, however, a mass capitulation event may not necessarily occur, even at current levels, amid suggestions that miners who needed to sell BTC inventory have already done so. Hash rate supports that thesis, having dipped by a maximum of around 20% from all-time highs before rebounding, according to estimates from data resource MiningPoolStats.Bitcoin estimated hash rate chart (screenshot). Source: MiningPoolStatsActive addressesThe July 2021 drawdown was accompanied by a slowdown in Bitcoin network activity. Active addresses, as measured by on-chain analytics platform CryptoQuant, saw a noticeable drop through June last year before rebounding in line with price in Q3.This time, no such dip has taken place, indicating that the market is more occupied in moving their BTC. This has a number of implications — hodlers may have become sellers due to low prices; traders may be seeking to profit from volatility; others may be looking to “buy the dip.”It is worth noting, however, that overall on-chain volume remains low, and that means that buy-side support is likely insufficient to end the downward price trend, analysts argue.Bitcoin active addresses chart. Source: CryptoQuantExchange reservesFinally, and despite the broadly lower volumes mentioned above, Bitcoin exchanges are losing coins around $20,000 — and fast.Related: These 3 metrics suggest the Bitcoin price crash is not overNormally, price collapses trigger inflows to exchanges as panicking traders prepare to sell or short. This time, it would appear, really is different in that respect, as exchange users are removing coins from accounts, not loading up.21 major exchanges tracked by CryptoQuant currently have a balance of 2.419 million BTC, down from 2.544 million at the start of Q2. Exchange reserves last year conversely rose throughout the Q2 downtrend, only resuming their own drop as BTC/USD recovered.Bitcoin exchange reserves chart. Source: CryptoQuantThe views and opinions expressed here are solely those of the author and do not necessarily reflect the views of Cointelegraph.com. Every investment and trading move involves risk, you should conduct your own research when making a decision.

Čítaj viac

Bitcoin price dips under $21K while exchanges see record outflow trend

Bitcoin (BTC) sold off into the June 27 Wall Street open as United States equities fell.BTC/USD 1-hour candle chart (Bitstamp). Source: TradingView$25,000 eyed as bulls’ line in the sandData from Cointelegraph Markets Pro and TradingView showed BTC/USD following stock markets downhill as the last week of June began.At the time of writing, the pair traded below $21,000, having hit its lowest in three days after a broadly stable weekend.Amid a general lack of bullish conviction among traders, expectations for a further drop stayed present, with Bitcoin still below the crucial 200-week moving average (WMA) at $22,430.”Bitcoin says NO against $21K support. That’s all fine. We have got levels structured,” Cointelegraph contributor Michaël van de Poppe wrote in a Twitter debate on the day.A further post argued that further lows would come to entice traders to open long positions. Support lay at $20,325 and around $20,100, and should neither hold, a dip toward $19,000 could result.Fellow trader and analyst Credible Crypto, meanwhile, laid down the requirements to be sure that this month’s $17,600 lows would not be challenged. For him, a trip to the low $30,000 range would need to ensue.”If we manage to reclaim $25,000, push up to the low $30,000s — $28, $29, $30,000 — at that point, I don’t think we’re going to see new lows,” he said in a video update.”So if we’re going to see new lows, I’d expect it to happen before we reclaim $25,000.”Bitcoin remained on track to close its first month ever under the 200WMA on the day, singling out the current bear market among previous ones.BTC/USD 1-week candle chart (Bitstamp) with 200WMA. Source: TradingViewBTC drains from exchange walletsMeanwhile, evidence of investors buying the dip continued to mount.Related: Google users think BTC is dead — 5 things to know in Bitcoin this weekAfter whales made the headlines for adding coins around $20,000, exchanges more broadly saw major decreases in BTC supplies in recent days.According to data from on-chain analytics firm Glassnode, June 26 saw the largest cumulative change in BTC not kept on exchanges.The 30-day average change in supply kept on exchanges was down 153,849 BTC as funds moved elsewhere.Bitcoin exchange net position change chart. Source: GlassnodeAs Cointelegraph reported, metrics such as the Mayer Multiple continue to show the potential for outsized gains by buying BTC at current levels.The views and opinions expressed here are solely those of the author and do not necessarily reflect the views of Cointelegraph.com. Every investment and trading move involves risk, you should conduct your own research when making a decision.

Čítaj viac

Získaj BONUS 8 € v Bitcoinoch

nakup bitcoin z karty

Registrácia Binance

Burza Binance

Aktuálne kurzy