Autor Cointelegraph By William Suberg

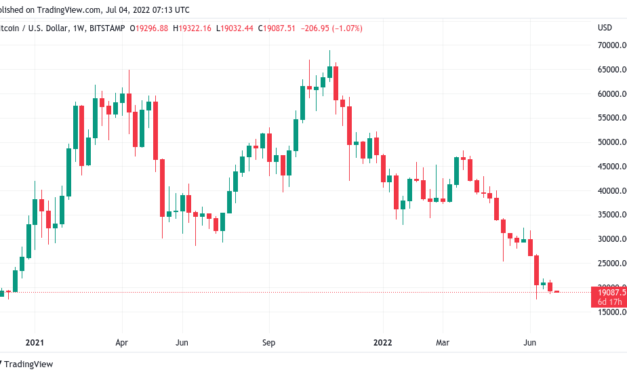
Bitcoin price spikes to $20K as whale bought BTC confirms support

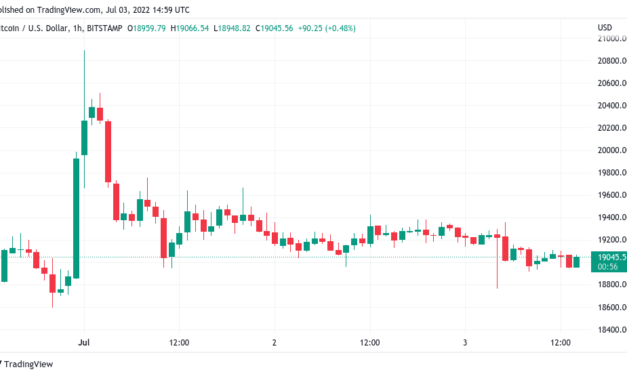
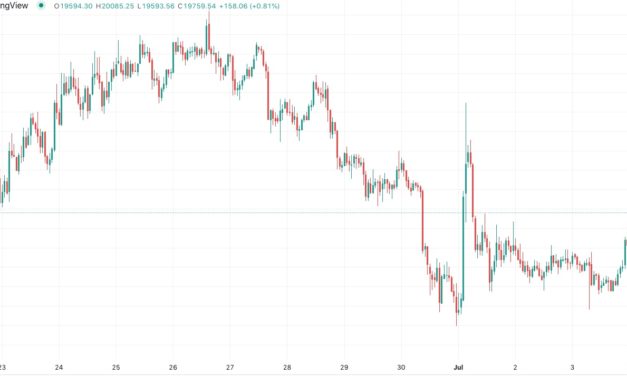
Bitcoin (BTC) rose to clip $20,000 for the first time in five days on July 4 as the Independence Day holiday brought some unexpected gains.BTC/USD 1-hour candle chart. Source: Tradingview.com$20,000 briefly reappearsData from Cointelegraph Markets Pro and TradingView showed BTC/USD spiking to $20,085 on the day, its best performance since June 30.The pair had spent most of the holiday weekend at around $19,000, but the absence of Wall Street trading ultimately proved no obstacle for bulls. Thinner weekend order books likely exacerbated volatility compared to underlying volumes, but nonetheless, Bitcoin was up 3% on the day at the time of writing.Not going to zero just yet #BTC pic.twitter.com/8KuliZn0QC— Material Scientist (@Mtrl_Scientist) July 4, 2022″Bitcoin has successfully created Bullish Divergence on the Daily Time Frame for the first time since breaking below $20,000,” popular analyst Matthew Hyland noted.On-chain analytics resource Whalemap meanwhile confirmed that whales buying coins at $19,200 had once again provided support for the market.Yep https://t.co/0SrIWe72OR— whalemap (@whale_map) July 4, 2022

As Cointelegraph reported, whales had expressed a keen interest in levels immediately below $20,000, conspicuously not choosing to wait until much-vaunted levels at $16,000 and below appeared.”Flipping $19.5K is a trigger for Bitcoin,” Cointelegraph contributor Michael van de Poppe added.Altcoins meanwhile made the most of Bitcoin’s spike, with Ether (ETH) rising almost 6% to pass $1,100.ETH/USD 1-hour candle chart. Source: Tradingview.comOthers in the top ten cryptocurrencies by market cap broadly saw daily gains of around 5%.The views and opinions expressed here are solely those of the author and do not necessarily reflect the views of Cointelegraph.com. Every investment and trading move involves risk, you should conduct your own research when making a decision.

Čítaj viac

'Wild ride' lower for BTC? 5 things to know in Bitcoin this week

Bitcoin (BTC) starts a new week still in holiday mode with United States financial markets off for Independence Day.The largest cryptocurrency, stuck below the increasingly daunting $20,000 mark, continues to feel the pressure from the macro environment as talk of lower levels remains omnipresent.After a quiet weekend, hodlers find themselves stuck in a narrow range while the prospect of a breakout to the upside appears increasingly hard to believe.As one trader and analyst singles out July 4 as the site of a “wild run to the downside” for crypto markets, the countdown is on for Bitcoin to weather the aftermath of the latest Federal Reserve rate hike.What else could the coming week have in store? Cointelegraph takes a look at the potential market-moving factors for the days ahead.BTC price bides its time over long weekendBitcoin emerged from the weekend unscathed, but the classic pitfalls of off-peak trading remain.The United States will not return to trading desks until July 5, providing ample opportunity for some classic weekend price action in the meantime.So far, the market has held off when it comes to volatility — with the exception of a brief spike to $18,800, BTC/USD has circled the area between $19,000 and $19,500 for several days.Even the weekly close provided no real trend change, data from Cointelegraph Markets Pro and TradingView showed, with the psychologically significant $20,000 unchallenged.BTC/USD 1-week candle chart (Bitstamp). Source: TradingView”While below the range low we can expect a drop down to $18,000,” popular trading account Crypto Tony reiterated to Twitter followers as part of a fresh update on July 4. “Been a very boring few days in the markets, and this is classic for a mid range.” In terms of targets to the downside, others continued to eye the area around $16,000.In 2018, The Orange MA was the Bottom. In 2020, The Green MA was Bottom. Currently holding the Green MA (16-17K). If it breaks then there is a Possibility of Next Bottom Blue MA (12-13K) $BTC pic.twitter.com/rZILTAOlXf— Trader_J (@Trader_Jibon) July 3, 2022With no meaningful Bitcoin futures gap and flat performance on Asian markets, meanwhile, there was little to be had in terms of short-term price goals for short-timeframe traders.The U.S. dollar, meanwhile, continued to hold near twenty-year highs after returning from its latest retracement defiant.The U.S. dollar index (DXY) stood above 105 at the time of writing.U.S. dollar index (DXY) 1-hour candle chart. Source: TradingViewGold nears “blast off” against U.S. equitiesWith Wall Street closed for Independence Day, U.S. equities can take a breather on Monday.For one popular chartist, however, attention is focusing on the strength of stocks versus gold in the current environment. In a Twitter thread on the day, gold monitor Patrick Karim specifically flagged the precious metal as being about to hit a historical “blast off” zone against the S&P 500. After bottoming out at the end of 2021, the ratio of gold to the S&P has recovered throughout this year, and is now about to cross a boundary, which has historically led to significant upside afterward.“Gold closing in on ‘blast off zone’ versus US equities. Previous take-offs have unleashed important gains for Silver & Miners,” Karim commented.The situation cannot be said to be the same in U.S. dollar terms, with USD strength keeping XAU/USD firmly in its place below $2,000 since March.Nonetheless, for silver fans, the implications are that even a modest push-through for the XAU/SPX ratio will bring significant returns.Note you won’t need to get back to previous 2011 highs for the #gold versus #spx ratio to have MUCH higher nominal prices for silver & miners.Think about that for a moment.— Patrick Karim (@badcharts1) July 3, 2022

The forecast again calls into question the extent of Bitcoin’s ability to break with macro trends. A breakout against BTC for gold would be the natural knock-on effect should Karim’s scenario play out thanks to ongoing correlation with equities.“After escaping the sideways pattern that had formed for a 1.5 year period, the correlation coefficient increased sharply to 86% vs S&P 500,” popular trader and analyst CRYPTOBIRB summarized at the weekend. “Now, at 0.78 ratio it remains strongly positive.”Fellow analyst Venturefounder noted that Bitcoin also remains tied to moves in the Nasdaq.Meanwhile #Bitcoin and #NASDAQ are still trending together.Note previous bottoms (Dec 2018 & Mar 2020) happened as #BTC and $QQQ correlation at peak, suggesting macro has always influenced BTC bottoms. We can predict more likely that macro calls bottom for BTC again this time. pic.twitter.com/szmS4c6WV8— venturef◎undΞr (@venturefounder) June 26, 2022

Against the dollar, Cointelegraph meanwhile reported, Bitcoin’s inverse correlation is now at 17-month highs.Crunch time for Hayes’ “wild ride to the downside”July 4, apart from being Independence Day, is being watched by one market player in particular as a public holiday like no other — at least for Bitcoin.With markets closed and BTC price action already teetering on the edge of support, Arthur Hayes, former CEO of derivatives platform BitMEX, has singled out this long weekend as one long day of reckoning for crypto markets.The reasoning seems logical. The end of June saw the Federal Reserve raise key rates by 75 basis points, providing fertile ground for an adverse reaction from risk assets. Low-liquidity “out-of-hours” holiday trading increases the potential for volatile price moves up or down. Combined, the cocktail, Hayes warned last month, could be potent.“By June 30 (second quarter end), the Fed will have enacted a 75bps rate hike and begun shrinking its balance sheet. July 4 falls on a Monday, and is a federal and banking holiday,” he wrote in a blog post. “This is the perfect setup for yet another mega crypto dump.”So far, however, signs of what Hayes says will be a “wild ride to the downside” have not materialized. BTC/USD has stayed practically static since late last week.The deadline should be Tuesday, July 5, as the return of traders and their capital could provide liquidity needed to steady the markets as well as buy up any coins going cheap in the event of a last-minute downturn. Hayes added that his prior forecasts of BTC/USD bottoming at $27,000 and ETH/USD at $1,800 already “lay in tatters” in June.Mining difficulty is still risingDespite considerable concern over miners’ ability to withstand the current BTC price downturn, Bitcoin’s network fundamentals remain calm.An impressive testament to miners’ resolve to stay on the network, difficulty is not planning to reduce at the upcoming readjustment this week.After decreasing by a modest 2.35% two weeks ago, difficulty, which automatically rises and falls to take into account fluctuations in miner participation, will hardly change at all this time around.According to estimates from on-chain monitoring resource BTC.com, difficulty will even rise should current prices stay the same, adding 0.5% to what is a metric still near all-time highs.Bitcoin network fundamentals overview (screenshot). Source: BTC.comWhen it comes to miners themselves, opinions consider that it is the less efficient players — possibly newcomers with higher cost basis — who have been forced to exit.Data uploaded to social media by Charles Edwards, CEO of asset manager Capriole last week meanwhile puts the production cost for miners en masse at around $26,000. Of that, $16,000 is electricity, meaning that miner overheads directly influence their ability to limit losses in the current environment.“We traded below Electrical Cost in June, however the floor has since dropped as inefficient miners capitulate,” Edwards noted.Bitcoin miner production cost chart. Source: Charles Edwards/ TwitterA sea of lowsBitcoin on-chain metrics pointing to record overselling is nothing new this year and in recent weeks especially. Related: Top 5 cryptocurrencies to watch this week: BTC, SHIB, MATIC, ATOM, APEThe trend continues in July, as the network returns to scenarios not seen since the aftermath of the March 2020 cross-market crash.According to on-chain analytics firm Glassnode, the number of coins being spent at a loss is now the highest since July 2020. Glassnode analyzed the weekly moving average of unspent transaction outputs (UTXOs) in loss.Bitcoin UTXOs in loss chart (7-day moving average). Source: GlassnodeSimilarly, the percentage of UTXOs in profit hit a two-year low of just over 72% on July 3.Bitcoin % UTXOs in profit chart (7-day moving average). Source: GlassnodeBear markets can produce some welcome, if rare, silver linings. Bitcoin transaction fees, once painfully high during bullish periods of intense network activity, are now also at their lowest since July 2020. The median fee, Glassnode reveals, is $1.15.Bitcoin median transaction fee chart. Source: GlassnodeAs Cointelegraph reported, the same is true for Ethereum network gas fees.The views and opinions expressed here are solely those of the author and do not necessarily reflect the views of Cointelegraph.com. Every investment and trading move involves risk, you should conduct your own research when making a decision.

Čítaj viac

Bitcoin addresses in loss hit all-time high amid $18K BTC price target

Bitcoin (BTC) meandered into the weekly close on July 3 after weekend trading produced a brief wick below $18,800.BTC/USD 1-hour candle chart (Bitstamp). Source: TradingViewBollinger bands signal volatility dueData from Cointelegraph Markets Pro and TradingView followed BTC/USD as it stuck to $19,000 rigidly for a third day running.The pair had gone light on volatility overall at the weekend, but at the time of writing was still on track for the first weekly close below its prior halving cycle’s all-time high since December 2020.The previous weekend’s action had produced a late surge which saved bulls from a close below $20,000.Momentum remained weak throughout the following week’s Wall Street trading, however, and traders were unconvinced about the potential for a significant relief bounce.“Looking for a push down to the lower support zone at $18,000 while we are below $19,300. Quick scalp and tight invalidation,” popular Twitter account Crypto Tony wrote in an update to followers on the day.“I can’t really trust this move because it’s ‘weekend pa,’” fellow account Ninja continued in part of a further post, adding that “if bulls can’t push to $19.7k, I don’t think the dump is over.”Up or down, incoming volatility was being keenly eyed by commentators as the weekly close drew near. Popular analyst Matthew Hyland noted that the Bollinger bands indicator was signaling that price conditions would soon become more erratic.#Bitcoin Bollinger Bands tightening on the daily time frame as displayed on the width indicator: pic.twitter.com/c0bqmMfdSi— Matthew Hyland (@MatthewHyland_) July 3, 2022On daily timeframes, BTC/USD traded near the bottom Bollinger band, threatening a drop below as an expression of volatility similar to that which occurred in May.BTC/USD 1-day candle chart (Bitstamp) with Bollinger bands. Source: TradingViewUnderwater addresses surpass March 2020 peakFresh data meanwhile showed just how much pain the average hodler was going through after the worst monthly losses since 2011.Related: Bitcoin indicator that nailed all bottoms predicts $15.6K BTC price floorAccording to on-chain monitoring firm Glassnode, the weekly moving average number of unique BTC addresses now at a loss reached a new all-time high of 18.8 million on July 3.As Cointelegraph previously reported, in previous capitulation events, 60% of the supply needed to see unrealized losses.Bitcoin addresses in loss chart. Source: Glassnode”Almost $40 Billion in Bitcoin Net Realized Losses since May 1st,” analytics account On-Chain College summarized as June came to a close. “Some have quit, some have stuck around. One thing is for sure- if you’ve been in this space over the last year and you’re still here, you’ve been through quite a lot of volatility.”The views and opinions expressed here are solely those of the author and do not necessarily reflect the views of Cointelegraph.com. Every investment and trading move involves risk, you should conduct your own research when making a decision.

Čítaj viac

Bitcoin indicator that nailed all bottoms predicts $15.6K BTC price floor

Bitcoin (BTC) needs to go lower before putting in a macro bottom, one of the market’s most accurate indicators shows.Data from sources including on-chain analytics firm Glassnode shows Bitcoin’s MVRV-Z Score is almost — but not quite — signaling a price reversal.MVRV-Z Score inches towards macro bottomAmid ongoing debate whether if, or when, BTC/USD will go beyond its current macro lows of $17,600, new figures suggest that the market easily has further to fall.As noted by Filbfilb, co-founder of trading suite Decentrader, the MVRV-Z score is now in its classic green zone, but not yet at the point which has accompanied price bottoms in the past.MVRV-Z measures how high or low the Bitcoin spot price is relative to what is referred to as its “fair value.” It uses market cap and realized price data along with standard deviation to create what has turned out to be one of the most efficient Bitcoin top and bottom prediction tools.MVRV-Z has caught every macro top and bottom on BTC/USD in its history, and done so with an accuracy of two weeks, data resource LookIntoBitcoin notes.The metric has only gone below its green zone a handful of times, the last being in March 2020, but more downside pressure would deliver a repeat performance.“This chart is *the one* for me,” Filbfilb commented about the latest readings. “We normally bottom when MC Bitcoin MVRV-Z Score chart. Source: Glassnode$16,000 bottom zone gains traction$15,600 would tie in with various existing predictions of where Bitcoin is due to bottom. Related: Bitcoin will see ‘long bear market’ says trader with BTC price stuck at $19KIn an update to Twitter followers at the weekend, meanwhile, popular account CryptoBullet included that area as one of several important support zones to watch.$16,000, it confirmed, also marks the average deviation from Bitcoin’s 50-month moving average.Some very important #BTC levels:16k – Average Deviation from MA50 (-25%)14k – 2019 Echo Bubble Top12.2k – Celsius Liquidation10.7k – Key Horizontal Level https://t.co/hEcnj8wsak pic.twitter.com/1Xke0F7WSe— CryptoBullet (@CryptoBullet1) July 2, 2022

Bitcoin’s relative strength index, or RSI, is already at its lowest ever, another indication of the oversold nature of a market now below its previous halving cycle’s peak of nearly $20,000.The views and opinions expressed here are solely those of the author and do not necessarily reflect the views of Cointelegraph.com. Every investment and trading move involves risk, you should conduct your own research when making a decision.

Čítaj viac

Bitcoin will see ‘long bear market’ says trader with BTC price stuck at $19K

Bitcoin (BTC) failed to reclaim recent losses into July 2 as traders prepared for stagnant price action to continue.BTC/USD 1-hour candle chart (Bitstamp). Source: TradingView”Downtrend acceleration” still in forceData from Cointelegraph Markets Pro and TradingView tracked a limp BTC/USD as it chopped around the $19,000 mark into the weekend.The Wall Street trading week had finished without surprises, with United States equities practically stagnant — providing little impetus for crypto volatility. The U.S. dollar index, or DXY, fresh from a retest of twenty-year highs, ran out of steam to circle 105 points.U.S. dollar index (DXY) 1-hour candle chart. Source: TradingViewOrder book data from largest global exchange Binance showed BTC/USD caught between buy and sell liquidity close to spot price, ensuring a lack of volatility until traders maneuvered or added significantly to bids or asks.BTC/USD order book data (Binance). Source: Material IndicatorsZooming out, the outlook hardly seemed any more optimistic for bulls.For popular trading account Altcoin Sherpa, current conditions promised an extended period of uninspiring performance from Bitcoin which could last much of 2022.“Its gonna take months to chop around and accumulate once the bottom is found,” it told Twitter followers.“And the bottom might not even come for another few months from today. Hunker down for a long bear market IMO.”The sentiment was echoed by trader and analyst Rekt Capital, who argued that Bitcoin had not yet made new macro lows or started to consolidate.#BTC may still very well be in the “Downtrend Acceleration” phase of its correctionBut this phase will precede the “Multi-Month Consolidation” phaseWhich will precede the “New Macro Uptrend” phase$BTC #Crypto #Bitcoin— Rekt Capital (@rektcapital) July 1, 2022“Deleverage yourself. Get your Bitcoin into cold storage. Sit tight,” Checkmate, lead on-chain analyst at research firm Glassnode added.Will volume all-time highs echo 2018?The next week or two could prove to be this cycle’s lows, meanwhile, lending a degree of hope to those concerned that the bottom is still months away.Related: Price analysis 7/1: BTC, ETH, BNB, XRP, ADA, SOL, DOGE, DOT, LEO, SHIBIn a Twitter thread on the day, economist, trader and entrepreneur Alex Krueger noted that volume denominated in BTC hit all-time highs last month.”As a general rule, trading volume is the highest when markets capitulate,” he explained.As a general rule, trading volume is the highest when markets capitulate, and such capitulation creates major bottoms.This weekly chart includes the aggregated bitcoin volume for most BTC pairs (spot & perpetuals across exchanges).Volume hit its all time high two weeks ago. pic.twitter.com/6ONLibQiL2— Alex Krüger (@krugermacro) July 2, 2022

In the 2018 bear market, he added, the volume all-time high in fact occurred several weeks before the price bottom, and should this time follow the trend, July could be the site of the next.Previously, Rekt Capital had argued that buy-side volume had not been strong enough to sustain fresh price upside in the long term, while also highlighting the 2018 volume moves.The views and opinions expressed here are solely those of the author and do not necessarily reflect the views of Cointelegraph.com. Every investment and trading move involves risk, you should conduct your own research when making a decision.

Čítaj viac

Získaj BONUS 8 € v Bitcoinoch

nakup bitcoin z karty

Registrácia Binance

Burza Binance

Aktuálne kurzy