Autor Cointelegraph By William Suberg

Key Bitcoin chart 'will confirm bottom is in' by July 15, says trader

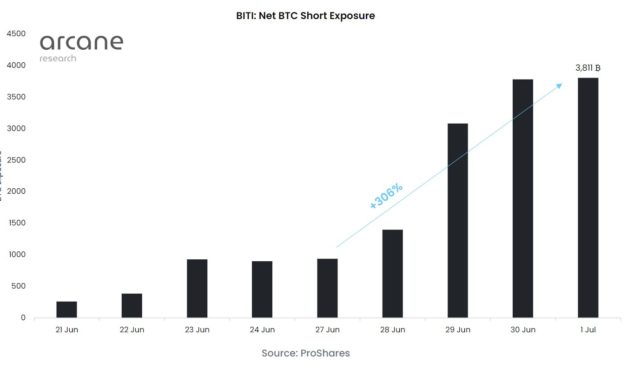
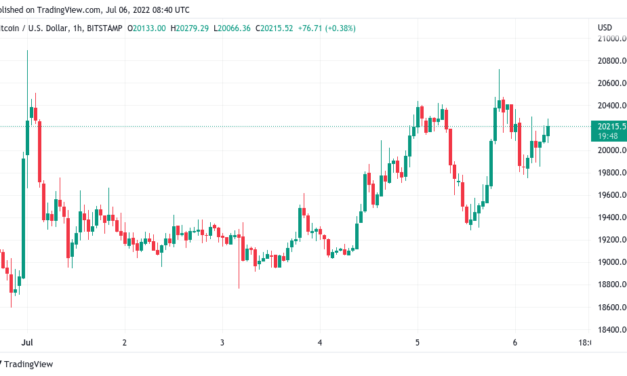
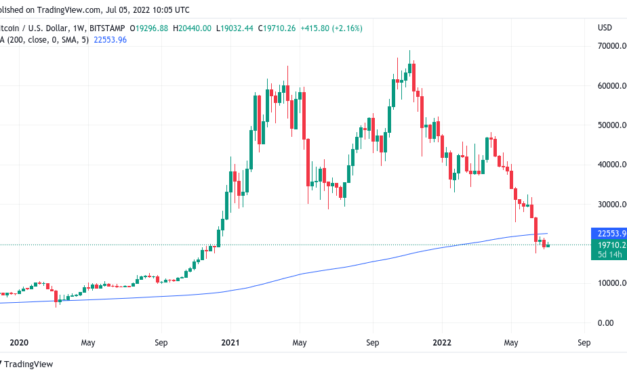
Bitcoin (BTC) is due to give a definitive signal that a macro bottom is in this month, one analyst has concluded.In a Twitter thread on July 6, popular commentator Wolf eyed key moving average data as proof that BTC price action will not be going lower.Key chart crossover eyed as end to bear market lossesAmid repeated calls for BTC/USD to revisit levels not seen since Q4 2020, one simple historical trend is now saying that the pair has already seen its latest macro lows.Analyzing the 3-day chart, Wolf argued that the 100-day moving average (MA) crossing the 200MA will act as a price floor signal — just like in previous bear markets.“Negative 3d MA100 will cross positive 3d MA200 by half July, that would confirm that bottom is in,” he wrote.Specifically, the crossover of the two MAs is due on or by July 15 — in just a week’s time — after which future trajectory should be confirmed. Should Bitcoin avoid major downside in the meantime, $17,600 will thus remain as the latest long-term BTC price bottom.Negative 3d MA100 will cross positive 3d MA200 by half July, that would confirm that bottom is in. pic.twitter.com/WgPMUkWIoy— Wolf (@IamCryptoWolf) July 7, 2022Despite historical precedent, such an outcome is nonetheless far from certain. Prior to the July 15 deadline, crypto markets will have to weather an ongoing macro economic storm, which has so far proved deadly for risk assets across the board.July 13 will be of particular interest to market participants, this date marking the release of Consumer Price Index (CPI) data from the United States for the month of June. As Cointelegraph reported, inflation is already at 40-year highs, and CPI readouts have shown a consistent uptrend throughout 2022.The faster inflation is shown to be accelerating, the more likely a reaction from the Federal Reserve, with monetary tightening having a direct negative impact on risk asset performance.Moving averages stack up as resistanceBTC/USD meanwhile circled $20,500 at the time of writing on July 7, approaching weekly highs.Related: World’s first short Bitcoin ETF sees exposure explode 300% in daysIn a thread of his own on July 6, analyst Keith Alan flagged various other daily, weekly and monthly MAs as zones of interest should Bitcoin manage to sustain upwards momentum.”Continued rejections at the 21 DMA would indicate there isn’t enough bullish sentiment to push higher, which brings downside targets into focus,” he explained.He noted, however, that should a resistance/support flip (R/S) occur, the 50-month MA would come into play, followed by the essential 200-week MA which has formed a key focus in prior bear markets.1/8 Yesterday #Bitcoin retested the 21-Day Moving Average. After reclaiming it briefly, price fell back down, marking another failed attempt. Price remains in range of another retest. Here’s a on why this level warrants some attention. #NFA pic.twitter.com/gfbWBXtTRk— Keith Alan (@KAProductions) July 6, 2022

As of July 7, the 21-day MA, 50-month MA and 200-week MA stood at $20,300, $21,570 and $22,560 respectively, data from Cointelegraph Markets Pro and TradingView showed.The views and opinions expressed here are solely those of the author and do not necessarily reflect the views of Cointelegraph.com. Every investment and trading move involves risk, you should conduct your own research when making a decision.

Čítaj viac

World's first short Bitcoin ETF sees exposure explode 300% in days

Bitcoin (BTC) remains a popular institutional investment target in July, but the money is not betting on a bright future.According to data from research firm Arcane Research published July 6, institutional flows focused on products offering exposure to shorting BTC in the first week of the month.Shorting Bitcoin is the name of the gameSince launching in the United States in late June, the ProShares Short Bitcoin Strategy ETF (BITI), the first exchange-traded fund (ETF) to be “short” BTC, has proved a hit.That trend has only accelerated in July, with short exposure jumping over 300% in days, data confirms.”BITI, the first inverse BTC ETF, grew further last week,” Arcane summarized in Twitter comments. “After becoming the second-largest bitcoin-related BTC ETF in the U.S. after only four days of trading, the net short exposure has grown further and increased by more than 300% last week.”ProShares Short Bitcoin Strategy ETF (BITI) exposure chart. Source: Arcane Research/ TwitterThe timing for BITI in the U.S. is conspicuous in itself, coming as BTC/USD plumbed multi-year lows of $17,600.As Cointelegraph reported, expectations among analysts remain skewed to the downside, and the BITI inflows appear to confirm that institutional sentiment is likewise.Separate data published by digital asset investment firm CoinShares on July 4, meanwhile, put weekly inflows into Short BTC products at $51 million — easily the majority of the week’s total of $64 million.While long BTC investments were just $20 million, CoinShares nonetheless highlighted persisting demand for such products despite shorts stealing the limelight.”This highlights investors are adding to long positions at current prices, with the inflows into short-Bitcoin possibly due to first-time accessibility in the US rather than renewed negative sentiment,” it wrote.Business (or lack of) as usual for GBTCTesting times, meanwhile, remain for the stalwart institutional Bitcoin investment vehicle, the Grayscale Bitcoin Trust (GBTC).Related: Bitcoin price approaches potential springboard to $23K as DXY cools surgeAfter U.S. regulators rejected Grayscale’s application to convert the Trust to a Bitcoin spot ETF, the firm began legal action, a sign of the frustration facing an industry dealing with both regulatory scrutiny and declining asset prices.The so-called GBTC premium, the difference between Bitcoin spot price and shares of GBTC, has been negative for over a year, at several points becoming a more than 30% discount.GBTC premium vs. asset holdings vs. BTC/USD chart. Source: CoinglassThe views and opinions expressed here are solely those of the author and do not necessarily reflect the views of Cointelegraph.com. Every investment and trading move involves risk, you should conduct your own research when making a decision.

Čítaj viac

Bitcoin price approaches potential springboard to $23K as DXY cools surge

Bitcoin (BTC) approached the July 6 Wall Street open near $20,000 as a fresh battle between support and resistance loomed.BTC/USD 1-hour candle chart (Bitstamp). Source: TradingViewWhale levels close byData from Cointelegraph Markets Pro and TradingView showed BTC/USD wedged in a tight trading range with liquidity creeping closer to spot on the day.After recovering 6% losses from the day before, order book data confirmed that support and resistance was now almost shoulder-to-shoulder.According to on-chain monitoring resource Whalemap, a cluster of whale positions between $20,546 and $21,327 meant that this large area was now the zone to beat.Buyer interest, meanwhile, stayed at around $19,200, this also formed of whale bids which formed after BTC/USD dipped to multi-year lows of $17,600 in Q2.#Bitcoin’s range from a whale perspective. Let’s see how this range resolves. pic.twitter.com/UsN7NrF3AC— whalemap (@whale_map) July 5, 2022“D1 close above 20.5k and maybe we’ll finally get D1 trend retest,” popular trader Pierre meanwhile tweeted in a fresh update. “Warned few weeks ago this was setting up like May for a lot of chop while D1 trend would catch down with price. So far that’s exactly what we got, I’d just like a proper D1 trend retest, last one was at 32k…”An accompanying chart showed moving averages between 10 days and 30 days keeping spot in check.At $20,200 at the time of writing, BTC/USD thus traded immediately below an important line in the sand on lower timeframes. For Cointelegraph contributor Michaël van de Poppe, breaking through this could open up the path to the other side of resistance at $23,000.This one did crack the resistance and ran towards the next area of resistance at $20.3K.I’m expecting #Bitcoin to consolidate for a bit here, but breaking the next resistance zone is a trigger for continuation towards $23K and a summer relief rally. https://t.co/e8tFtrnEsz pic.twitter.com/DnQHcCL3dF— Michaël van de Poppe (@CryptoMichNL) July 5, 2022

Industry news meanwhile had little impact on BTC price action, this coming in the form of crypto exchange Voyager Digital filing for bankruptcy, the latest domino in a chain reaction sparked by the breakdown of lending platform Celsius.USD takes a breatherOn macro, Asian markets drifted lower, with Hong Kong’s Hang Seng down 1.2% and the Shanghai Composite Index down 1.4% at the time of writing.Related: ARK Invest ‘neutral to positive’ on Bitcoin price as analysts await capitulationThe U.S. dollar index (DXY), fresh from a surge to new twenty-year highs, meanwhile consolidated immediately below the peak, still above 106.”First time we’re seeing such a recovery after a severe correction + strength on the $DXY,” Van de Poppe added. “Strength on the equities as well. Wouldn’t be surprised if this continues in the coming period, despite the overall sentiment being ultra bearish.”U.S. dollar index (DXY) 1-month candle chart. Source: TradingViewThe views and opinions expressed here are solely those of the author and do not necessarily reflect the views of Cointelegraph.com. Every investment and trading move involves risk, you should conduct your own research when making a decision.

Čítaj viac

Bitcoin faces fresh pressure as US dollar crushes gold, risk assets

Bitcoin (BTC) hit daily lows on the July 5 Wall Street open as the U.S. dollar saw a violent surge higher. BTC/USD 1-hour candle chart (Bitstamp). Source: TradingViewUSD sets yet another 20-year recordData from Cointelegraph Markets Pro and TradingView showed BTC/USD retreating to $19,281 on Bitstamp as the Independence Day long weekend concluded with a bump.The pair had seen last-minute gains the day prior, these fizzling as the return of Wall Street trading was accompanied by USD strength laying waste to gains across risk assets and safe havens.Bitcoin traded down $1,000 on the day, while spot gold shed over 2% and U.S. equities markets also fell. The S&P 500 was down 2.2% at the time of writing, while the Nasdaq Composite Index lost 1.7%.XAU/USD 1-hour candle chart. Source: TradingViewThe U.S. dollar index (DXY), on the contrary, hit 106.59, a level not seen since December 2002 and above previous breakouts from Q2 this year.Bitcoin analysts thus waited for signs of a trend reversal to provide some relief to crypto markets.Waiting for Dollar Crash $DXY pic.twitter.com/HaKXIM3OFB— Trader_J (@Trader_Jibon) July 5, 2022″Euro hitting record levels, $1.033 at this point. Last seen in the years 2002-2003 and $DXY, of course, shooting up like a rocket,” Cointelegraph contributor Michaël van de Poppe commented, noting that the euro was heading towards USD parity.In additional commentary, Caleb Franzen, senior market analyst at Cubic Analytics, pointed to how the DXY shed light on investor sentiment over the health of the economy.”Over the past week, yields are falling but the dollar keeps rising. This dynamic proves that investors are rushing to safety, with heightened fears of recession,” part of a tweet read.The U.S. dollar index (DXY) 1-month candle chart. Source: TradingViewCrypto Fear & Greed Index hits 2-month highWhile volatility edged back into crypto markets, sentiment was yet to reflect the impact of a rampant dollar.Related: ‘Wild ride’ lower for BTC? 5 things to know in Bitcoin this weekThe Crypto Fear & Greed Index stood at 19/100 on the day, still indicative of “extreme fear” but nonetheless its highest reading since before the Terra LUNA debacle in May.Crypto Fear & Greed Index (screenshot). Source: Alternative.meAs Cointelegraph additionally reported, investment manager ARK Invest revealed that it was still “neutral to positive” on BTC under current circumstances.Analyzing Bitcoin futures market sentiment, meanwhile, Edris, a contributor to on-chain analytics platform CryptoQuant, voiced caution about making conclusions over any form of recovery.The taker buy/ sell ratio, which indicates whether buyers or sellers are in control, saw some relief on the day, Edris showed, but the move should be taken with a pinch of salt.”However, note that it could just be a consolidation or a bullish pullback before another continuation lower,” a blog post read. “So, many other factors should be considered closely in the coming weeks in order to determine if a bullish reversal or another bull trap could be expected.”Bitcoin taker buy/ sell ratio annotated chart. Source: Edris/ TwitterThe views and opinions expressed here are solely those of the author and do not necessarily reflect the views of Cointelegraph.com. Every investment and trading move involves risk, you should conduct your own research when making a decision.

Čítaj viac

ARK Invest 'neutral to positive' on Bitcoin price as analysts await capitulation

Bitcoin (BTC) has a “neutral to positive” outlook despite staying below $20,000, according to ARK Investment Management.In its latest “Bitcoin Monthly” report, the American asset management giant flagged signs that BTC price action is close to bottoming.Wood: “We’re waiting for more capitulation signals”One of Bitcoin’s most vocal supporters, ARK and CEO, Cathie Wood, have stuck with BTC exposure as the market continues to fall from all-time highs.The latest Bitcoin Monthly release confirms that conviction, with Wood, analysts and research associate David Puell suggesting that little ground remains to be covered before BTC/USD reverses.“Down 70% from its all-time high, bitcoin is trading at or below some of its most important levels: its 200-week moving average, the general cost basis of the market (realized price), the cost bases of long-term (LTH) and short-term holders (STH), and its 2017 peak,” the report reads. “Trading below these levels is atypical and suggests extremely oversold conditions. Only four times in history has bitcoin traded below price levels relative to these means.”As such, most of the losses should have already come, if history is a guide. Among indicators yet to see absolute lows are the MVRV ratio — the ratio of realized cap and the cost basis of entities hodling for different lengths of time.“Historically, global bottoms occur when the MVRV of short term holders exceeds the MVRV of long term holders,” ARK explained. “That condition has not been met, suggesting the potential for more downside.”Generally, however, Wood in particular sees little cause for concern as Bitcoin markets weather a macro storm of significant historical proportions.In the latest edition of ARK’s podcast, “In the Know,” released July 1, she described the firm’s attitude to BTC as “neutral to positive” overall.“We’re waiting for a few more capitulation signals and, of course, time will tell on the systemic side here. We haven’t heard of another stress signal in the last few days, so that’s good as well,” Wood said.Price downside still tipped to continueARK’s position meanwhile echoes those of various market commentators.Related: ‘Wild ride’ lower for BTC? 5 things to know in Bitcoin this weekAs Cointelegraph continues to report, consensus is building around a drop to around $16,000, with the majority of on-chain indicators already at lows seen either rarely or never before.$BTCLower highs all the time. Pumps have low volume and they look corrective.Main target remains $15,800-16,200 pic.twitter.com/HNAB8MXQZZ— il Capo Of Crypto (@CryptoCapo_) July 5, 2022“Historically, the 200-week MA has figured as a bottom indicator for BTC. In this cycle, things may be a bit different,” popular trader and analyst Rekt Capital told Twitter followers late last week, continuing the theme touched on by ARK. “Instead of $BTC bottoming at the 200MA, it may form a macro range below it. Anything below the 200MA will likely represent peak opportunity.”The 200-week MA currently sits at just above $22,550, data from Cointelegraph Markets Pro and TradingView shows, and has never stopped rising.BTC/USD 1-week candle chart (Bitstamp) with 200MA. Source: TradingViewThe views and opinions expressed here are solely those of the author and do not necessarily reflect the views of Cointelegraph.com. Every investment and trading move involves risk, you should conduct your own research when making a decision.

Čítaj viac

Získaj BONUS 8 € v Bitcoinoch

nakup bitcoin z karty

Registrácia Binance

Burza Binance

Aktuálne kurzy