Autor Cointelegraph By William Suberg

Bitcoin eyes best weekly gains in 3 months as BTC price slips below $21K

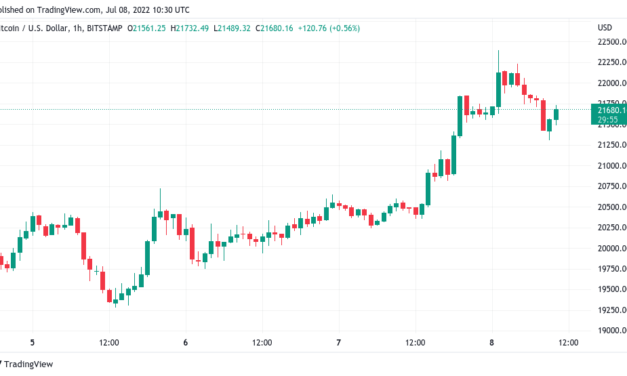
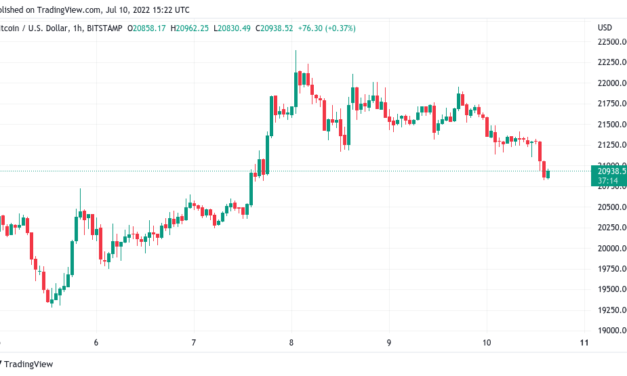
Bitcoin (BTC) hit three-day lows into the July 10 weekly close as $21,000 gave way as short-term support.BTC/USD 1-hour candle chart (Bitstamp). Source: TradingViewTrader eyes bullish divergences across marketsData from Cointelegraph Markets Pro and TradingView showed BTC/USD giving up some of its gains from earlier in the week while still looking to cap its best weekly gains since March.The pair circled $20,850 at the time of writing, around $1,600 below the week’s peak at the 200-week moving average.Despite no continuation of the breakout, Bitcoin gave some commentators cause for cautious optimism ahead of the new week beginning.“The markets are showing higher timeframe bullish divergences and the sentiment is the same as on a funeral,” Cointelegraph contributor Michaël van de Poppe summarized.“A recipe for a reversal is there, and it can accelerate quite fast. Invest when nobody is interested. Sell when everyone is interested.”Popular trader Crypto Tony meanwhile entertained the idea of a new sideways phase entering before a deeper drop, something which he imagined “would drive everyone crazy.”$BTC / $USD – Playing with ideasIf we start to reject harder and fail to reclaim the range high, we may start to see something like this shape up. Would drive everyone crazy i can imagine pic.twitter.com/wwoa8vjMRv— Crypto Tony (@CryptoTony__) July 10, 2022Macro conditions remained uncertain, with upheaval in Sri Lanka adding to a sense of nervousness engendered by the common global theme of energy, food and financial crisis.All this crazy shit happening in the world, I just can’t see how anyone can be macro bullishwe need new buyers and retail, without that there is no continuation… only chopall pumps are an opportunity to exit and buy lower$BTC pic.twitter.com/npAKi1L8uw— Ninja (@Ninjascalp) July 10, 2022

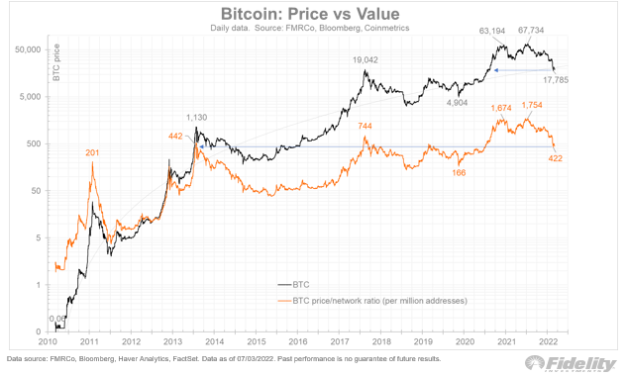
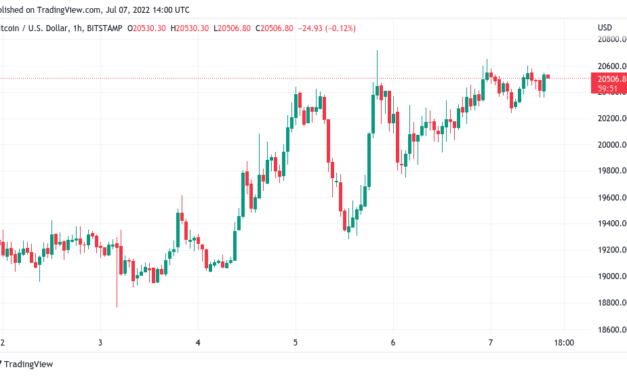
Attention focused on the U.S. dollar Index (DXY), which had ended the week back on support after spiking to fresh highs not seen in twenty years.U.S. dollar Index (DXY) 1-hour candle chart. Source: TradingViewRisk Reserve hits all-time lowsThose seeking a golden buying opportunity on BTC meanwhile got a fresh key signal from the Reserve Risk indicator.Related: Bitcoin ‘cheap’ at $20K as BTC price to wallet ratio mimics 2013As noted by commentator Murad over the weekend, Reserve Risk, which shows long-term holder sentiment, hit its lowest-ever levels at July’s prices.”Either this indicator is broken or we are in the high timeframe bottoming zone,” he said in part of Twitter comments alongside data from on-chain analytics firm Glassnode. “I lean towards the latter.”Bicoin Risk Reserve vs. BTC/USD chart. Source: @MustStopMurad/ TwitterReserve Risk, as Cointelegraph reported, has been rediscovering its green “buy” zone since March, this corresponding to optimal chances to invest with “outsized returns” as a result.The views and opinions expressed here are solely those of the author and do not necessarily reflect the views of Cointelegraph.com. Every investment and trading move involves risk, you should conduct your own research when making a decision.

Čítaj viac

Bitcoin 'cheap' at $20K as BTC price to wallet ratio mimics 2013

Bitcoin (BTC) has not been this good value since it cost $1,130, one analyst argues as BTC offers a “compelling” risk/reward ratio.In a Twitter thread on July 7, Jurrien Timmer, director of global macro at asset manager Fidelity Investments, simply described $20,000 Bitcoin as “cheap.”Timmer: “In other words, Bitcoin is cheap”While fears that crypto markets could suffer further drawdowns this year remain, some believe that current Bitcoin price levels offer the kind of value for money not seen in years.Analyzing the BTC price versus the number of non-zero addresses — wallets with a positive balance — Timmer concluded that BTC/USD is now back at where it was at the peak of the 2013 bull market.At the time, BTC/USD managed to hit around $1,130 before spending several years consolidating thanks to the demise of exchange Mt. Gox.“I use the price per millions of non-zero addresses as an estimate for Bitcoin’s valuation, and the chart below shows that valuation is all the way back to 2013 levels, even though price is only back to 2020 levels,” Timmer explained. “In other words, Bitcoin is cheap.”The Bitcoin price/network ratio is not the only encouraging sign when it comes to Bitcoin’s growth despite the current bear market. Timmer added that Bitcoin adoption still reflects the rise of the internet, and that the Bitcoin network “appears to be intact” when it comes to its growth cycles.When it comes to price/network ratio, it is further not just Bitcoin showing signs of solid investment potential.“If Bitcoin is cheap, then perhaps Ethereum is cheaper,” he wrote. “If ETH is where BTC was four years ago, then the analog below suggests that Ethereum could be close to a bottom.”Bitcoin price/network ratio vs. BTC/USD chart. Source: Jurrien Timmer/ Twitter”0.5X downside, 12X upside”$20,000 BTC should meanwhile still provide a “compelling” investment case even to those who believe that a 50% price dip is still possible.Related: This ‘biblical’ Bitcoin pattern suggests BTC price can rise 30% by OctoberThat was the conclusion of James Lavish, a former hedge fund manager turned macroeconomics expert, who drew attention to the simple maths involved in a Bitcoin bet in today’s environment.“At $20K BTC, if you believe that the downside risk is $10K and the upside potential is $250K, then at these prices there is a .5X downside and 12.5X upside. This is a 25 to 1 Reward to Risk profile,” he told Twitter followers. “This is compelling.”While hard to imagine this year, a $250,000 price tag for BTC/USD is in fact fairly modest by historical standards of price prediction. Among its adherents is billionaire Tim Draper, who nonetheless initially insisted that Bitcoin would cost a quarter of a million dollars by 2022.The views and opinions expressed here are solely those of the author and do not necessarily reflect the views of Cointelegraph.com. Every investment and trading move involves risk, you should conduct your own research when making a decision.

Čítaj viac

Bitcoin price builds best weekly candle since March despite new DXY peak

Bitcoin (BTC) is on track for its biggest weekly gains since March, but not everyone is convinced the good times will last.BTC/USD 1-hour candle chart (Bitstamp). Source: TradingViewCrypto sentiment highest since early MayData from Cointelegraph Markets Pro and TradingView shows that at the time of writing, BTC/USD is up over $2,000 this week — nearly 12%.After spending several days trapped in a narrow range, the pair managed to exit to the upside, the gains accelerating overnight into July 8 to see highs of $22,401 on Bitstamp.#bitcoin nicely bounced back to 200WMA and Realized Price levels (both at ~$22K). Let’s see if it holds. Btw BTC $24.8K would flip RSI back at 45. pic.twitter.com/62yU8wJtuP— PlanB (@100trillionUSD) July 8, 2022Those highs alone are noteworthy, coinciding with Bitcoin’s 200-week moving average (MA), an essential level in bear markets which has acted as resistance since last month.While consolidating around $1,000 lower, Bitcoin nonetheless is showing the potential for a trend turnaround. Beating out the 200-week MA, however, will be no easy task.“Well, Bitcoin, $22.3K was reached and all the highs have been taken for now,” Cointelegraph contributor Michaël van de Poppe summarized in a Twitter update. “Some consolidation and build-up is required (might retest $20.7Kish) before markets are ready to break above 200-Week MA, which will be a heavy one.”BTC/USD 1-week candle chart (Bitstamp) with 200-week MA. Source: TradingViewVan de Poppe previously suggested that there is “probably an insane amount of liquidity above the 200-Week MA,” and that breaking through could see a run as high as $30,000.“And then the sentiment will flip too,” he added.Signs of change in the overall market mood were already visible on the day, however, with the Crypto Fear & Greed Index hitting its highest levels since May 7. At 20/100, the Index remains in its “extreme fear” zone.Crypto Fear & Greed Index (screenshot). Source: Alternative.meAnother day, another two-decade DXY highThe latest price action is meanwhile not without its naysayers, some of whom expect deeper macro lows to enter before any significant recovery.Related: Bitcoin faces Mt. Gox ‘black swan’ as trustee prepares to unlock 150K BTC“Lot of people expecting 22k-23k. It’s the new 52k when price was at 47k-48k or the new 35k when price was at 31k-32k. 16k comes first imo,” popular trader Il Capo of Crypto argued on July 7.Later, he noted that Bitcoin was increasing despite renewed strength in the U.S. dollar index (DXY), and that “spoofing” on major exchanges was adding to the chances of the latest move being a fakeout.“DXY going parabolic. Bitcoin going up a bit and people getting euphoric and calling for 40k. Not a single bullish sign to support this move up and price is still at 21k-22k (resistance),” he warned Twitter followers. “Rejection will be strong. Altcoins could drop 45-50%. There will be no mercy.”DXY stood at 107.3 at the time of writing, marking new twenty-year highs. U.S. dollar strength is traditionally inversely correlated with cryptoasset performance.U.S. dollar index (DXY) 1-month candle chart. Source: TradingViewThe views and opinions expressed here are solely those of the author and do not necessarily reflect the views of Cointelegraph.com. Every investment and trading move involves risk, you should conduct your own research when making a decision.

Čítaj viac

Bitcoin faces Mt. Gox 'black swan' as trustee prepares to unlock 150K BTC

Bitcoin (BTC) faces a new selling threat in the near future as users of defunct exchange Mt. Gox prepare to get their BTC back.In fresh correspondence dated July 6, attorney Nobuaki Kobayashi, appointed trustee in the Mt. Gox rehabilitation process, confirmed that he was “preparing to make repayments” to account holders.Cash, Bitcoin or Bitcoin Cash?Over eight years after Mt. Gox imploded, it appears that those who lost money are about to receive BTC.The event has been long coming, as have concerns over its impact on the market. The price of Bitcoin at the time was a fraction of the current $20,900, commentators have noted, leading to suspicions that recipients could instantly sell large amounts of BTC on the market, pressuring prices.In the official correspondence, Kobayashi did not give an exact date for the repayments to begin.”The Rehabilitation Trustee is currently preparing to make repayments (‘Repayments’) in accordance with the approved rehabilitation plan of which confirmation order of the Tokyo District Court (the “Court”) was made final and binding on November 16, 2021 (the “Rehabilitation Plan”),” it reads.Those owed now have the choice of receiving outstanding funds as an “Early Lump-Sum Repayment or not,” it continues, as well as receiving all or part of them in BTC or embattled altcoin Bitcoin Cash (BCH). “The deadline for the Choice and Registration will be set by the Rehabilitation Trustee with the permission of the Court,” the correspondence adds.Mt. Gox trustee balance chart. Source: GlassnodeThe rehabilitation plan was originally approved in 2018 and confirmed in October 2021. Out of the initial 850,000 BTC lost by Mt. Gox’s decline, only a reported 150,000 BTC has been recovered.Potential black swans still to come:1. Mt Gox victims finally get their bitcoin released2. Tether collapse unable to redeem3. Total stockmarket crash4. Taiwan invasion5. Ukraine escalation6. Satoshi alive and moves some $btc from genesis wallet7. Schiff buys bitcoin— EloniusMunk (@EloniusMunk) June 18, 2022Reacting, Ki Young Ju, CEO of on-chain analytics platform CryptoQuant, advised traders to set price alarms for when the payouts began. “It’s still quiet for now,” he tweeted, while another Twitter user included Mt. Gox as top of the list of “black swan” events which could impact BTC.Celsius loan repayment boosts BTCBTC/USD was unfazed by the prospect of the payouts on the day.Related: Celsius pays down 143M in DAI loans since July 1Instead, news that crypto lending platform Celsius had completed repayments of its own in the form of a $44 million loan to MakerDAO sent the market to nine-day highs of near $21,000.As Cointelegraph reported, volatility was already expected to hit Bitcoin, which had been consolidating in an increasingly narrow range for several days, data from Cointelegraph Markets Pro and TradingView showed.BTC/USD 1-hour candle chart (Bitstamp). Source: TradingViewThe views and opinions expressed here are solely those of the author and do not necessarily reflect the views of Cointelegraph.com. Every investment and trading move involves risk, you should conduct your own research when making a decision.

Čítaj viac

Bitcoin price clings to $20K as Bollinger bands close in for volatility

Bitcoin (BTC) said “no” to volatility for a third day on July 7 as Wall Street trading began with little change in mood.BTC/USD 1-hour candle chart (Bitstamp). Source: TradingViewNext move “likely sets direction going forward”Data from Cointelegraph Markets Pro and TradingView followed BTC/USD as it fluctuated just north of $20,000, retaining a pattern characteristic of the week so far.The pair stayed well within a defined range overnight, leading analysts to assume that a break up or down was next as a short-term prospect.“Bitcoin strong consolidation at $20k, this can’t go on forever, triangle primed to break to upside or downside. But RSI bullish divergence tho,” Venturefounder, a contributor to on-chain analytics platform CryptoQuant, told Twitter followers July 6. “BTC going above $21,700 makes a higher high, going below $18,800 makes a lower low, the next move likely sets the direction forward.”Bullish signals on Bitcoin’s relative strength index (RSI) referred to be Venturefounder often precede BTC price followthrough, making the current RSI chart a key reference point on low timeframes.Confirming the likelihood for volatility to return, meanwhile, Bollinger bands on the daily chart stayed narrow — a classic prelude to a trend taking shape.BTC/USD 1-day candle chart (Bitstamp) with RSI, Bollinger bands. Source: TradingViewRegarding what direction that trend could take, all bets remained off on the day as caution summarized sentiment.“Still not convinced with this type of price action,” crypto trader Ninja commented. “below $20.6k is distribution imo, and any pumps shall be faded… the nuke is not over.”Ninja additionally noted that short interest was building on exchange platform Bybit on the day, advising a hands-off approach until those positions unwound.Calm before the CPI stormOn macro markets, the U.S. opened to modest gains, with the S&P 500 and Nasdaq Composite Index up 1% and 1.3% respectively within the first 30 minutes.Related: Bitcoin bulls may have to wait until 2024 for next BTC price ‘rocket stage’A week before May’s Consumer Price Index (CPI) data release, markets remained free of turbulence over inflation signals, in turn keeping additional headwinds from impacting crypto asset performance.With opinions still mixed over how U.S. economic policy will change through 2023, trader Crypto Tony acknowledged that a true return to form for Bitcoin and altcoins may take longer than many realize.“Personally on my worse case scenario update i do not think we see the start of the next impulse until later next year and a new bull run peak until 2024 – 2025,” he tweeted on the day. “I am already positioned at 22-24k and will add if we drop to 17 – 15k.”Earlier, meanwhile, Cointelegraph reported on one trader’s theory that Bitcoin will confirm where the latest macro bottom is by July 15.The views and opinions expressed here are solely those of the author and do not necessarily reflect the views of Cointelegraph.com. Every investment and trading move involves risk, you should conduct your own research when making a decision.

Čítaj viac

Získaj BONUS 8 € v Bitcoinoch

nakup bitcoin z karty

Registrácia Binance

Burza Binance

Aktuálne kurzy