Autor Cointelegraph By William Suberg

Bitcoin circles $20K pre CPI amid warning Fed risks ‘blowing up’ economy

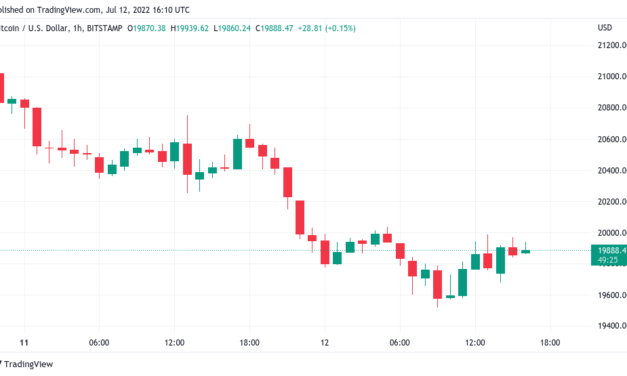
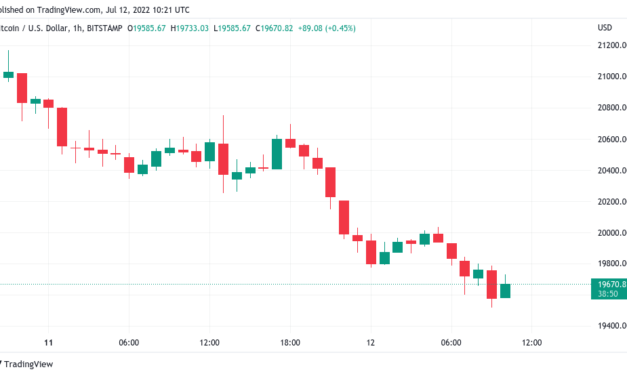
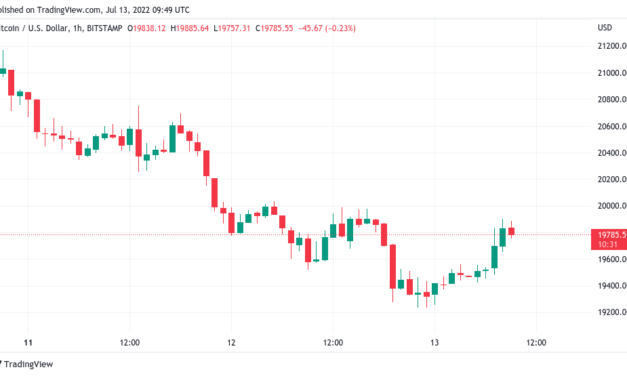
Bitcoin (BTC) rebounded from overnight lows on July 13 as markets nervously waited for United States inflation data.BTC/USD 1-hour candle chart (Bitstamp). Source: TradingViewCountdown to “highly elevated” inflation revealData from Cointelegraph Markets Pro and TradingView showed BTC/USD climbing from $19,250 to $19,900 at the time of writing, up 3.3% on the day.With three hours to go until the release of Consumer Price Index (CPI) data for June, crypto markets showed little sign of advance volatility.Previously, the U.S. government had warned that the CPI figures were expected to be “highly elevated,” with unofficial projections from other sources indicating a year-on-year inflation increase of nearly 9%.NEW #inflation record high on the year!At least that’s what I’m now forecasting for June CPI, released in 5 daysI forecast 8.8% year over year, breaking the previous 41 year record of 8.6% set last monthMonth over month this would be 1.2% pic.twitter.com/5IochMzP6f— TheHappyHawaiian (@ThHappyHawaiian) July 9, 2022“CPI coming out at 8.8% today. Watch. I’ve got a strong feeling this is the number,” popular crypto YouTuber Ben Armstrong agreed.Biding its time meanwhile was the U.S. dollar index (DXY), which lingered at just above 108 after a corrective move from fresh twenty-year highs.U.S. dollar Index (DXY) 1-hour candle chart. Source: TradingViewAnalyzing the potential for the Federal Reserve to continue interest rate hikes to tame inflation, meanwhile, one analyst argued that there was already little, if any, room for maneuver.“We are at the point where the fed would usually halt rate hikes and begin easing again,” Reddit and Twitter user TheHappyHawaiian explained. “As they gear up for 75bp in a couple weeks, they would be knowingly blowing up the system.”An accompanying “Fed Pivot Indicator” chart showed Fed rate direction change over the past thirty-three years, and suggested that hikes had already hit their maximum allowed levels.Fed Pivot Indicator chart. Source: @TheHappyHawaiian/ TwitterTrader highlights $22,000 importanceAltcoins were somewhat predictably in lockstep with BTC ahead of the inflation numbers.Related: Ethereum price risks ‘bear flag’ breakdown, 20% drop against BitcoinEther (ETH), after losing 8% the day prior, circled $1,075 at the time of writing, still down 6.3% over the past seven days.ETH/USD 1-hour candle chart (Binance). Source: TradingViewOther tokens in the top ten cryptocurrencies by market cap were static on daily timeframes.For Cointelegraph contributor Michaël van de Poppe, however, there was still reason to believe that selling pressure was circumstantial rather than a longer-term trend.“Yes, the markets should have been correcting, but right now, the valuations of crypto and Bitcoin are way lower than what they should be, due to forced selling from 3AC, $LUNA, and more,” he argued. “That’s why a break through $22K is going to accelerate the price to $30K as well.”The views and opinions expressed here are solely those of the author and do not necessarily reflect the views of Cointelegraph.com. Every investment and trading move involves risk, you should conduct your own research when making a decision.

Čítaj viac

'Very small chance' BTC price could hit $24K, says trader as US dollar cools

Bitcoin (BTC) fought to reclaim $20,000 on the July 12 Wall Street open as the U.S. dollar cooled its surge to new two-decade highs.BTC/USD 1-hour candle chart (Bitstamp). Source: TradingViewDollar bull run takes fresh breatherData from Cointelegraph Markets Pro and TradingView revealed a tug-of-war between buyers and sellers following seven-day lows for BTC/USD.The intraday losses had come at the hands of a rampant U.S. Dollar Index (DXY), which hit its highest levels since October 2002 at risk assets’ expense thanks to inverse correlation.U.S. dollar Index (DXY) 1-hour candle chart. Source: TradingViewA subsequent pause gave U.S. equities room to breathe, with both the S&P 500 and Nasdaq stemming losses on the day. Good to note how quickly risk assets tend to move up when $DXY even goes down the slightest amount.Way more responsive to DXY’s downside than it’s upside.When DXY does cool down we’re due for some solid bounces I reckon.— Daan Crypto Trades (@DaanCrypto) July 12, 2022With the July 13 Consumer Price Index (CPI) print in focus, however, optimism around crypto on shorter timeframes was barely perceptible.For popular trader and analyst Crypto Ed, there was “more pain to come” for both BTC and stocks.”There is a very small chance that we see a double correction towards $24,000 or $25,000,” he forecast in a fresh video update, analyzing potential Elliott Wave moves after Bitcoin’s spike to $22,400 last week.The chances of significant relief were “small,” however, with the option of “nuking down” also on the table. Bitcoin hodlers face “remarkable pressure”For on-chain analytics firm Glassnode, meanwhile, there were already signs from the market that Bitcoin could be in the latter part of its bear cycle.Related: US inflation data will be ‘messy’ — 5 things to know in Bitcoin this weekIn the latest edition of its weekly newsletter, “The Week On-Chain,” analysts argued that long-term holders — those least likely to capitulate — were under “remarkable pressure” to sell. There was, however, still room left to drop if Bitcoin was to repeat previous bear market behavior.”The present market structure has many hallmarks of the later stage of a bear market, where the highest conviction cohorts, the long-term holders and the miners, are under remarkable pressure to surrender,” it concluded.”The volume of supply at a loss has now reached 44.7%, of which a majority is carried by the Long-Term Holder cohort. However, this remains at a less severe level compared to previous bear cycles.”Charts supporting the thesis included Long-Term Holder Spent Output Profit Ratio (LTH-SOPR), a metric which tracks average profit or loss of LTH coins being spent. LTH addresses are those holding coins for at least 155 days.”LTH-SOPR is currently trading at 0.67, indicating the average LTH spending their coins is locking in a 33% loss,” Glassnode noted.Long-Term Holder Spent Output Profit Ratio (LTH-SOPR) annotated chart. Source: GlassnodeThe views and opinions expressed here are solely those of the author and do not necessarily reflect the views of Cointelegraph.com. Every investment and trading move involves risk, you should conduct your own research when making a decision.

Čítaj viac

Bitcoin price hits 7-day low as US warns of 'highly elevated' CPI data

Bitcoin (BTC) carried through threats of new local lows July 12 as the White House warned of “highly elevated” inflation.BTC/USD 1-hour candle chart (Bitstamp). Source: TradingViewWhite House warns ahead of “decisive day”Data from Cointelegraph Markets Pro and TradingView showed BTC/USD approaching $19,500 prior to the Wall Street open, down over 4% on the day.Having failed to hold $20,300 support, the pair appeared to react badly to comments on the inflation outlook from White House press secretary Karine Jean-Pierre.Markets were already primed for higher than expected figures for June from the Consumer Price Index (CPI), which made new forty-year highs in May.“So on Wednesday, we will have new CPI inflation data, and we expect the headline number, which includes gas and food, to be highly elevated, mainly because gas prices were so elevated in June,” she told reporters at a press briefing July 11.The trip to $19,520 meanwhile marked Bitcoin’s lowest levels in a week.“Tomorrow is going to be decisive,” Cointelegraph contributor Michaël van de Poppe told Twitter followers. He added that the worst of the reaction should come before the CPI data release, but that the U.S. dollar index (DXY), itself at its highest in two decades, remained a source of interest.“Honestly saying, ‘sell the rumor, buy the news’ seems to be an implication,” the tweet continued. “Charts to watch tomorrow: $DXY and the yields on the government bonds + reaction on Brent oil.”Particularly high inflation risks losses across risk assets due to the associated risk of central bank monetary tightening to tame it, as is already being seen in the U.S. DXY, as Cointelegraph reported, often makes decisive moves upward in times of financial weakness.Psst… the dollar $DXY is telling us that inflation hasn’t peaked.— Caleb Franzen (@CalebFranzen) July 11, 2022DXY stood at 108.47 at the time of writing, having spiked higher into the new week to reach its strongest levels since October 2002.U.S. dollar Index (DXY) 1-month candle chart. Source: TradingView“Not interested into longs going into CPI tomorrow, personally looking at a regain of $20.3K and/or $19.3-19.5K region,” Van de Poppe added about potential plans to trade the upcoming turbulence.Ethereum price sheds 8%On altcoins, daily losses trended over 5%, but the top ten cryptocurrencies by market cap were led by Ether (ETH), down 8% in 24 hours.Related: Price analysis 7/11: BTC, ETH, BNB, XRP, ADA, SOL, DOGE, DOT, SHIB, AVAXETH/USD traded at $1,060 at the time of writing, approaching daily support levels in place since mid-June”If things stay the same and Altcoins continue to struggle to breach key resistances… Altcoins may need to experience at least an extra -30% of downside,” popular trader and analyst Rekt Capital commented at the start of the week.ETH/USD 1-day candle chart (Bitstamp). Source: TradingViewThe views and opinions expressed here are solely those of the author and do not necessarily reflect the views of Cointelegraph.com. Every investment and trading move involves risk, you should conduct your own research when making a decision.

Čítaj viac

Bitcoin risks new lows as $20K looms amid dollar euro parity

Bitcoin (BTC) headed for $20,000 after the July 11 Wall Street open amid fresh warnings to “prepare for new lows.”BTC/USD 1-hour candle chart (Bitstamp). Source: TradingView$20,300 eyed as next support zone to holdData from Cointelegraph Markets Pro and TradingView showed BTC/USD failing to recover losses that had immediately followed the weekly close at $20,850. The pair had nonetheless locked in its best week’s gains since March, these nonetheless apt to unravel as market uncertainty lingered.For on-chain analytics resource Material Indicators, the level to watch was a trendline acting as support since June.“BTC fell back below the 21-ay Moving Average after the Sunday close,” it wrote in a summation-like Twitter post alongside a heatmap of buy and sell interest on major exchange Binance.“FireCharts shows some bid liquidity in close range, but it may not be enough. If price falls below the trend line, prepare for new lows.”BTC/USD order book data (Binance) with trend line. Source: Material Indicators/ TwitterOthers predictably focused on the July 13 United States Consumer Price Index (CPI) data release, this tipped to spark downside across risk assets should June’s inflation significantly outpace estimates.Blockware analyst Joe Burnett additionally highlighted the potential for miners, already facing tight margins, to capitulate more heavily should BTC price action beat its prior lows.32 days since the start of Bitcoin’s miner capitulation.If CPI comes in hot, US equities make new lows, and Bitcoin drops sharply below $20k, get ready for the next wave of capitulations. pic.twitter.com/pKfchsILmf— Joe Burnett ()³ (@IIICapital) July 11, 2022″Crucial support now around $20.3K. Has to hold and, if the markets does, new highs pos,” Cointelegraph contributor Michaël van de Poppe nonetheless countered.Hayes sees start of fiat “doom loop”Macro takes were hardly any more optimistic. For Arthur Hayes, former CEO of derivatives trading platform BitMEX, confirmation was in that at least the U.S. dollar and the euro were beginning a “doom loop” to oblivion thanks to hitting parity.Related: US inflation data will be ‘messy’ — 5 things to know in Bitcoin this weekCentral banks would now have no option but to adopt yield curve control (YCC), sparking the disintegration of the currency which could ultimately leave Bitcoin on top as the new global standard — a prediction previously laid out in a blog post in April.The #DoomLoop has begun. 1 USD = 1 EUR. Prepare yourselves for YCC and $BTC = $1 million. But please be patient, these things take time. pic.twitter.com/mR8SsBx0fv— Arthur Hayes (@CryptoHayes) July 11, 2022

“$1 = 1€. Foreign currencies crashing against the dollar. And US dollar losing purchasing power fast (CPI est. 8.8%),” PlanB, creator of the Stock-to-Flow Bitcoin price models, added. “When money dies .. again.”The U.S. dollar index (DXY) continued its unrelenting surge higher on the day as the European gas crisis pressured the euro, hitting nearly 108.2 — a new twenty-year high.U.S. dollar Index (DXY) 1-month candle chart. Source: TradingViewThe views and opinions expressed here are solely those of the author and do not necessarily reflect the views of Cointelegraph.com. Every investment and trading move involves risk, you should conduct your own research when making a decision.

Čítaj viac

US inflation data will be 'messy' — 5 things to know in Bitcoin this week

Bitcoin (BTC) starts another week in a precarious position near $20,000 ahead of fresh macro upheaval.After admittedly sealing its best week’s gains since March, the largest cryptocurrency is struggling to hold onto its recently-reclaimed levels.Major resistance zones remain overhead, and with inflation data due for release later in the week, the coming days could prove unnerving for risk-assets everywhere.At the same time, crypto market sentiment is showing signs of recovery, and on-chain metrics continue to underscore what should be Bitcoin’s latest macro price bottom. With conflicting data everywhere, Cointelegraph takes a deeper look at potential market moving factors for the week ahead.200-week moving average causes headachesAt around $20,850, the June 10 weekly close was hardly anything special for BTC/USD, but the pair still managed its best seven days’ growth in several months.Ending Sunday a full $1,600 higher than its position at the start of the week, Bitcoin thus sealed progress not seen since March.The success did not last, however, as the hours following the weekly close turned negative. At the time of writing, BTC/USD was targeting $20,400, data from Cointelegraph Markets Pro and TradingView showed.BTC/USD 1-hour candle chart (Bitstamp). Source: TradingViewBitcoin’s ability to hold current levels could be key in deciding the mood this Summer, as relief on global equities would provide an opportunity for crypto to erase some of its losses from recent months.Commentators including trading suite Decentrader thus eyed the weekly chart with interest.Weekly look on $BTC futures. Current candle is set to close on a bullish engulfing bar above the Moonraker and weekly vwap. Momentum is turning up as well. If stocks continue to turn up and have a summer rally $BTC and crypto should likely follow. https://t.co/tlkrnTsG33— Decentrader (@decentrader) July 10, 2022Others were less enthusiastic, noting that BTC/USD had still performed another close below the essential 200-week moving average (WMA) at around $22,500. In previous bear markets, the 200 WMA acted as a general support level, with Bitcoin wicking below it briefly to put in macro bottoms. This time, however, appears to be different, as $22,500 has been absent from the chart for a month.#BTC weekly candle has rallied +15% but is still holding resistance under the 200MA for 3 weeks. Lower time frames are a bit more bullish, indicators are cooling off but markets remain fearful.Will #Bitcoin break back above the weekly 200MA before the weekly close? pic.twitter.com/NZXbxK8Oi2— Steve Courtney ~ Crypto Crew University (@CryptoCrewU) July 8, 2022

Zooming out, meanwhile, popular trader TechDev advocated a more optimistic outlook for the rest of 2022. By the end of the year, he argued at the weekend, a reclaim of further important WMAs should result in Bitcoin ending its “reaccumulation phase” altogether.“BTC flipping 32-35K likely confirms end of reaccumulation and this year+ correction,” TechDev told Twitter followers. “Most probable to occur imo once both 100W and 50W EMAs are in this range. 100W currently at 34.8K and 50W at 37.2K.”Elsewhere, continued asset liquidation from embattled crypto lending platform Celsius added to selling pressure.Celsius continues to send its remaining cryptoassets to exchanges. Few hours ago, 2,000 wBTC was transferred from the main wallet, and after a series of hops eventually hit Coinbase and Binance. Remaining key assets:410k stETH ($479mm)16k wBTC ($342mm) pic.twitter.com/ae6viYL1Jk— light (@lightcrypto) July 10, 2022

Relentless dollar is back as Asia markets dipAsian stocks trended down on July 11 as the start to the macro week was clouded by news of social unrest in China. As protesters demanded the release of frozen funds amid a scandal involving both banking officials and local authorities accused of abusing COVID-19 tracking apps, markets felt the strain.At the time of writing, the Shanghai Composite Index traded down 1.5%, while Hong Kong’s Hang Seng was 3.1% lower.Europe fared somewhat better with modest growth for the FTSE 100 and Germany’s DAX, with the United States still to open. Prior to Wall Street returning, however, the U.S. dollar index (DXY) was already making fresh strides higher, cancelling out a retracement which had provided a cooler end to last week.DXY was at 107.4 on July 11, just 0.4 points off twenty-year highs seen days prior.Analyzing the situation, one analyst at trading firm The Rock described DXY as “about as extreme as it gets” in terms of year-to-date growth.“Based on the extreme rally so far this year, the DXY is now up 16% year on year,” he wrote. “This is about as extreme as it gets historically speaking and, unfortunately, it typically coincides with major financial stress in markets, a recession, or both.”Bitcoin managed to buck its traditional inverse correlation to DXY last week, climbing in tandem with the index.U.S. dollar index (DXY) 1-day candle chart. Source: TradingViewInflation tipped to provide “messy week”If that weren’t enough, the age-old topic of inflation is apt to provide a further test of market resilience this week.The U.S. Consumer Price Index (CPI) readout for June is due July 13, and expectations are for the monthly figure to be even higher year-on-year.The higher inflation, and the more it diverges from those already high expectations, the more risk assets tend to react in anticipation of a reaction from policymakers. For macro analyst Alex Krueger, the likely trajectory for this week is thus clear.“Going to be messy,” he summarized on Twitter. Themes this week#1 CPI Inflation. Consensus is higher: 8.8% yoy, 1.1% mom. My view: comes in even higher, large dip gets bought.#2 Earnings. Mostly financials this week. Should be OK.#3 European gas crisis. Exerts downwards pressure on risk and the euro.Going to be messy. https://t.co/LCmt2GRcHl— Alex Krüger (@krugermacro) July 10, 2022

CPI, while stripping out many of the leading inflation indicators, even caught the attention of mainstream commentators over the weekend in a grim hint that this week’s figures could put the cat among the pigeons.“As next week’s US CPI inflation print may get very close to 9%, some will be quick to point out that this measure is backward-looking,” economist Mohamed El-Erian reacted.“Yes…but it Captures the pain that many are feeling, particularly the less fortunate segments of society; and Influences inflation expectations.”Any knee-jerk reaction meanwhile could definitively spook Bitcoin markets in line with other risk assets, or at least spark major volatility, as seen during previous CPI events.MACD hints at price bottom in progressWith multiple Bitcoin price metrics either flashing “bottom” or even hitting all-time lows, the space is not short of signals suggesting a BTC investment at current prices has a historically unrivaled risk/reward ratio.This week, the latest metric to join the herd is the moving average convergence/divergence (MACD) on the weekly chart.MACD effectively tracks a chart trend already playing out. It involving subtracting the 26-period exponential moving average (EMA) from the 12-period EMA.When the resulting value is below zero, Bitcoin tends to be in a bottoming scenario, meaning that the recent trip to $17,600 could be so too should historical norms repeat.A #Bitcoin capitulation of price, when the weekly MACD is below the zero-line, has always marked the bottom. pic.twitter.com/5U1Q13Ybju— dave the wave (@davthewave) July 10, 2022

Commentator Matthew Hyland meanwhile noted a similar MACD structure still playing out on the 3-day chart.“3-Day MACD is still on a bullish cross,” market analyst Kevin Svenson added. “Despite the pullback, I remain bullish here for the medium term.”As Cointelegraph reported, Bitcoin’s relative strength index (RSI) is already at its most “oversold” levels in history. Last week, meanwhile, one trader called July 15 as the key date by which another chart feature will call the bottom, this one composed of two separate MAs.2-month highs for Crypto Fear & Greed IndexAs a modest silver lining, the average crypto investor is slowly getting their confidence back, the latest data suggests.Related: Top 5 cryptocurrencies to watch this week: BTC, UNI, ICP, AAVE, QNTBuilding on previous strength, crypto market sentiment hit its highest levels since early May over the weekend, and is now at 22/100.While still in “extreme fear” territory, the Crypto Fear & Greed Index’s renaissance provides a clear contrast to the events of the past two months, during which it dipped as low as 8/100 — below even some previous bear market bottoms.Crypto Fear & Greed Index (screenshot). Source: Alternative.meThe views and opinions expressed here are solely those of the author and do not necessarily reflect the views of Cointelegraph.com. Every investment and trading move involves risk, you should conduct your own research when making a decision.

Čítaj viac

Získaj BONUS 8 € v Bitcoinoch

nakup bitcoin z karty

Registrácia Binance

Burza Binance

Aktuálne kurzy