Autor Cointelegraph By William Suberg

100X Bitcoin energy use would mean 'absurd' $20M BTC price — developer

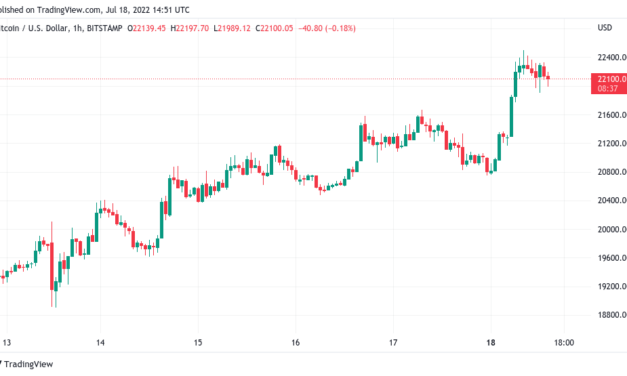
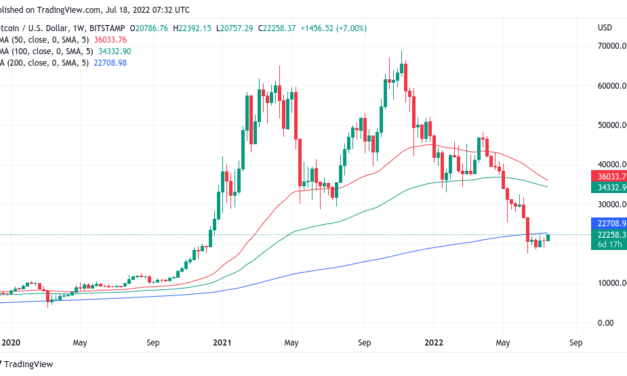
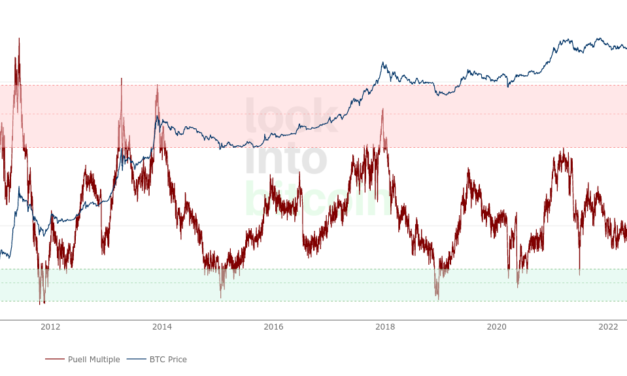
A new contributor to the Bitcoin (BTC) energy debate says that 1 BTC would have to cost $20 million to use 100 times its current energy demands.In a Twitter debate on July 18, Sjors Provoost, a Bitcoin developer and author of “Bitcoin: A Work in Progress,” cast doubt on the largest cryptocurrency’s future energy use.Bitcoin could survive on “waste energy breadcrumbs”How much energy Bitcoin uses to survive has become a topic of friction which has gone from within the industry to global government.Throughout the process, Bitcoin proponents have complained that a combination of bias and lack of understanding of network principles are leading those in power to make incorrect conclusions about how and why Bitcoin uses the energy it does.While critics argue that Bitcoin must reduce its energy consumption, others explain that Bitcoin in fact uses energy which would often otherwise be wasted or inaccessible.Discussing the status quo, fellow developer Matt Odell published a graphic showing that Bitcoin mining currently only uses 0.49% of the world’s wasted electricity, and 0.16% of electricity overall.Responding, Provoost calculated that for energy use to increase proportionally with changes in the Bitcoin network’s preprogrammed changes, it would have to become an “absurd” $420 trillion entity.“In 10 years the block subsidy will be ~10x lower (3 halvings). In order to get 100x today’s energy use, Bitcoin would have to trade at $20M by then (plus energy cost inflation adjustment),” he wrote. “But a $420T market cap is absurd, more than ALL real estate.”Bitcoin’s halving cycles mean that the block subsidy — the amount of “new” BTC added to the supply per mined block — halves roughly every four years. Each time, the mining ecosystem competes for less BTC, and thanks to Bitcoin’s Proof-of-Work (PoW) mining algorithm, remains incentivized to do so, devoting more hardware to their endeavors. More hardware means more power, but at the same time, the smaller reward, more efficient hardware and greater impact of transaction fees on miner revenue should keep energy use in check, Sjors says.“Another 12 years later and even if Bitcoin is worth more than all the worlds real estate, the mining subsidy would not be enough for Bitcoin to use more than 1% of global energy,” he continued, noting that his calculations were not verified. “So if nothing weird happens before 2030, it can probably keep running on waste energy breadcrumbs.”Miners’ struggle is realAs Cointelegraph continues to report, Bitcoin miners face challenging times at present thanks to the BTC price dipping to levels which make the whole practice of mining unprofitable for some. Related: BTC miners ‘finally capitulating’ — 5 things to know in Bitcoin this weekThis was in evidence in recent days as over 14,000 BTC left miner wallets — a signal that miners were choosing to sell funds to stay afloat.These “capitulation” events among the mining community have traditionally accompanied macro price bottoms.Versus its most recent all-time high in November 2021, BTC/USD has lost up to 74.5%.The Puell Multiple, a metric which compares the value of newly-issued BTC relative to the 365-day moving average, currently sits near historical lows.Bitcoin Puell Multiple chart. Source: LookIntoBitcoinThe views and opinions expressed here are solely those of the author and do not necessarily reflect the views of Cointelegraph.com. Every investment and trading move involves risk, you should conduct your own research when making a decision.

Čítaj viac

Bitcoin price nears critical 200-week moving average as Ethereum touches $1.5K

Bitcoin (BTC) hovered at $22,000 at the July 18 Wall Street open as analysts warned that bulls would not break resistance in one go.BTC/USD 1-hour candle chart (Bitstamp). Source: TradingViewCan Bitcoin win back bear market support?Data from Cointelegraph Markets Pro and TradingView showed BTC/USD returning to consolidate after hitting highs of $22,500 on Bitstamp.That level represented the start of sell-side positions on exchanges clustered around the 200-week moving average (WMA), a key area which commentators argued would be hard to crack.”Not expecting continuation on Bitcoin, at this point, as we’re facing 200-Week MA & range resistance,” Cointelegraph contributor Michaël van de Poppe told Twitter followers in his latest update.Fellow trader and analyst Rekt Capital, as others, was also skeptical about the potential for Bitcoin to continue upward momentum immediately.#BTC still remains below the 200-week MA resistanceUntil that level breaks, it’s technically premature to assume this is now a sustained relief rally$BTC #Crypto #Bitcoin— Rekt Capital (@rektcapital) July 18, 2022Van de Poppe nonetheless added that a breather for the market would be profitable at current levels. He concluded:”Slight consolidation would trigger continuation and break above $22.6K would activate massive longs towards $28K. Good times.”Both Bitcoin and altcoins made the most of relief on equities markets on the day, with Asia and the United States making modest gains as the U.S. dollar retreated.The S&P 500 and Nasdaq Composite Index were up 0.7% and 1%, respectively, at the time of writing, one hour after the opening bell.”Prime time for Bitcoin,” on-chain analytics resource Whalemap meanwhile forecast, offering a more optimistic take based on major buyer interest below spot price.Prime time for #Bitcoin Bounce from whale supports at ~$21k and we are ready to pic.twitter.com/x8hcmcgUw0— whalemap (@whale_map) July 18, 2022

Data from fellow monitoring resource Material Indicators showed similar support building on the Binance order book.BTC/USD order book data (Binance). Source: Material IndicatorsEthereum preserves performanceOn altcoins, the show was still being stolen by Ether (ETH), which lingered near $1,500 after sealing its highest levels in over a month, with huge gains against BTC included.Related: BTC miners ‘finally capitulating’ — 5 things to know in Bitcoin this weekETH/USD 1-day candle chart (Binance). Source: TradingViewBeating even Bitcoin’s progress, ETH/USD was the darling of traders on the day, firmly upending the previously dire price action in place from May onwards at the start of the Terra (LUNA) — now called Terra Classic (LUNC) — debacle.This is the first time, in 110 Days, that #Ethereum has broken into a bullish trend, printing Higher Lows & Higher High.Bears in disbelief.#cryptocurrency pic.twitter.com/MA2KAYzyWu— wolf (@ImNotTheWolf) July 17, 2022

Upcoming resistance lay in the form of Ethereum’s all-time high from the previous Bitcoin halving cycle at $1,530, which it touched in early 2018.The views and opinions expressed here are solely those of the author and do not necessarily reflect the views of Cointelegraph.com. Every investment and trading move involves risk, you should conduct your own research when making a decision.

Čítaj viac

BTC miners 'finally capitulating' — 5 things to know in Bitcoin this week

Bitcoin (BTC) starts a new week nearing key resistance as the shock of the latest United States inflation data passes — can the strength continue?The July 17 weekly close may have been practically identical to the last, but BTC/USD is showing some much needed strength prior to the July 18 Wall Street open.Last week was a testing time for crypto hodlers everywhere, with inflation dictating the mood across risk assets and the U.S. dollar capping the gloomy atmosphere. With those pressures now easing — at least temporarily — the mood has room to relax.At the same time, on-chain data suggests that now is a make or break moment for Bitcoin miners, and capitulation across the market feels close.As talk over where Bitcoin’s macro bottom could lie continues, Cointelegraph takes a look at several factors primed to shape BTC price performance in the coming days.All eyes on weekly moving averagesThose watching the weekly chart on BTC will have a sense of deja vu this time around — BTC/USD finished July 17 under $100 away from where it was on July 10.The latest weekly close is something of a disappointment in and of itself, with Bitcoin erasing gains at the last minute to print a “red” candle for the past seven days. What happened next, on the other hand, had the opposite tone — a swift overnight march higher, the largest cryptocurrency adding $1,400 in under twelve hours.It all leads up to a familiar challenge on intraday timeframes — BTC/USD is approaching both $22,000 and a key trendline at $22,600 in the form of the 200-week moving average (WMA).Previously acting as support in bear markets, the 200 WMA has in fact flipped to resistance this time around, having been lost in mid-June and never reclaimed.As such, analysts are eyeing that level as a key area of interest should bulls be able to sustain upside pressure.For PlanB, creator of the Stock-to-Flow family of BTC price models, a factor beyond spot price is meanwhile reinforcing its importance. As in previous bear markets, the 200 WMA briefly went above Bitcoin’s realized price this year, providing a classic market reversal signal.Realized price refers to the average price at which all the bitcoins in existence last moved.“In the bear market of 2014/15 and 2018/19 (blue) realized price was above 200WMA and the bull market did not start until realized price and 200WMA touched,” PlanB told Twitter followers on July 17 alongside an accompanying chart. “Now realized price and 200WMA already touched at $22K. For the next bull market we need BTC above realized price and 200WMA.”As Cointelegraph reported, bulls seem to need to play a game of moving averages on longer timeframes, too. In addition to the 200 WMA, the 50-week and 100-week exponential moving averages (EMAs) also figure in forecasts.The 50 EMA currently sits at $36,000 and the 100 EMA at just above $34,300, data from Cointelegraph Markets Pro and TradingView shows.BTC/USD 1-week candle chart (Bitstamp) with 50, 100 EMA; 200 WMA. Source: TradingViewEthereum nears $1,500 in potential trendsetter moveOne catalyst that could take Bitcoin over its key resistance mark at $22,600 could come from an unlikely source — altcoins.While normally moves on Bitcoin see other cryptocurrencies before copycat moves up or down, this week, some are waiting to see if BTC/USD will follow largest altcoin Ether (ETH) higher.Amid news that its transition to Proof-of-Stake (PoS) mining could soon complete, Ethereum has outperformed in terms of price gains in recent days, and is up 25% over the past week alone.At the time of writing, ETH/USD was about to challenge $1,500 for the first time since June 12.“$eth reclaimed its 200 week moving average this week, btc will probably next week, the time to be bearish has defo to an end imo,” popular Twitter account Bluntz summarized on the day.Fellow commentator Light likewise considered that Ethereum’s strength should keep upward pressure on Bitcoin, noting liquidations among those traders ignoring the ETH moves and continuing to be short BTC.shorts had days to get out on BTC. 0 reason to be short it when ETH did what it did. A large asset in the ecosystem ripping 40% stokes risk seeking behavior everywhere else. It makes people consider that assets can in fact go up in price. It leads to catch-up/rotational flows. https://t.co/nae0WIys9M— light (@lightcrypto) July 18, 2022Cross-crypto short liquidations in the 24 hours into July 18 totaled around $132 million, data from on-chain monitoring resource Coinglass confirms.Crypto liquidations chart. Source: CoinglassGoing forward, however, not everyone is convinced that Ethereum will be able to break its overall downtrend, with the implications obvious for other tokens as a result.Cointelegraph contributor Michaël van de Poppe argued that the pull of the weekend CME futures gap on Bitcoin could provide a downside force to puncture the optimism. CME futures finished their previous trading day, July 15, at around $21,200. “With the potential of a CME gap beneath us (and Bitcoin swimming around the previous CME gap), I won’t be surprised with a fake-out move and retest lower for $ETH,” he wrote in an update. “Looking to get into longs around the $1,250-1,280 region.”ETH/USD 1-hour candle chart (Binance). Source: TradingViewDollar strength finally flips in Bitcoin’s favorOn the topic of macro movements, the landscape looks overall less frenetic than that which greeted crypto investors last week. Inflation data has come and gone, and the debate over whether inflation has or has not peaked in the U.S. thus cools until the next Consumer Price Index (CPI) print in August.The Federal Reserve will decide on how to tackle inflation as regards key interest rate hikes later this month, the Federal Open Markets Committee (FOMC) nonetheless set to meet only on July 26.Any macro cues when it comes to BTC price action will thus be coming from other areas, with geopolitical triggers high on the list of potential factors.Asian markets were stronger as the week began thanks to a modest recovery in Chinese tech stocks previously hammered by Coronavirus nerves. At the same time, the U.S. dollar, the star of recent weeks as equities worldwide felt pressure, began to consolidate its gains.The U.S. dollar index (DXY), strength in which has long been inversely correlated with cryptoasset performance, headed south under 108 on the day, having reached fresh two-decade highs the previous week. “Finally seeing a drop on the daily,” Twitter analyst IncomeSharks commented, highlighting the potential for DXY to test a trendline from May. “Even a drop to this trend line would be big for Stocks and Crypto. Would line up perfectly with a bullish week before the FED meeting.”Fellow account Rickus also felt that Bitcoin would not “break down again” despite a pullback still being possible — thanks to the DXY comedown and a stronger finish for the S&P 500.SPX had a good close before the weekend, DXY also looks a bit weak on ltf while BTC is close to resistance levels..Lines I am watching..I personally don’t think we break down again although I am looking for a pullback. pic.twitter.com/KcYRJFrrbS— Rickus (@rickus_trades) July 17, 2022

“Should give room this week for equities & crypto to bounce until it find near support,” 0xWyckoff, creator of crypto trading resource Rekt Academy, added in part of a thread about the DXY.In a separate observation meanwhile, Dan Tapiero, managing partner and CEO at 10T Holdings, noted that a macro USD high versus the Chinese yuan should mark a turnaround point for BTC.“Last 3 major BTC highs in 2014, 2018, 2021 roughly coincided with highs in Chinese RMB/lows in USD,” he noted in part of a tweet on July 18. “Suggests that Dollar peak soon would be supportive of BTC low.”U.S. dollar index (DXY) 1-day candle chart. Source: TradingViewMiners dump 14,000 BTC in daysWith so much hope that a trend turnaround could be on the cards, on-chain data showing Bitcoin miners selling inventory looks all the more bleak.According to data from on-chain analytics platform CryptoQuant, beginning July 14, miners removed a significant chunk of BTC from their reserves.The effect was that miner reserves fell to their lowest levels since July 2021, a point which also marked a BTC price low.Reserves stood at 1.84 million BTC on July 18, down 14,000 BTC versus the July 14 tally.For CryptoQuant contributor Edris, the numbers were an encouraging sign, hinting that miners were now contributing to establishing a macro BTC price floor.“Bitcoin miners are finally capitulating,” he summarized over the weekend. “BTC price has been consolidating at the $20K level for the past few weeks, making investors wonder whether an accumulation or distribution phase is going on. Looking at the Miners’ Reserve chart, it seems like the latter is the case.”Bitcoin miner reserves chart. Source: CryptoQuantMacro analyst Alex Krueger meanwhile described June’s miner sales as a “clear sign of capitulation,” adding that miners “tend to accumulate on the way up then puke when things go bad.”RSI sparks “very rare” BTC price inflection pointFinally, a “rare” event on the Bitcoin chart may just have provided the fuel for a historic turnaround, analysis suggests.Related: Top 5 cryptocurrencies to watch this week: BTC, ETH, MATIC, FTT, ETCTaking the BTC/USD chart from the beginning of Bitcoin’s lifespan, Stockmoney Lizards noted that Bitcoin’s relative strength index (RSI) is now at suitably low levels and has combined with a touch of a log chart trendline which sparked the greatest BTC price recoveries.“Current exciting and very rare situation now,” it announced at the weekend. “RSI below 45 and logaritmic bottom showed a great reversal in the past, followed by a crazy bull run. Cross = RSI

Čítaj viac

Bitcoin hodlers will 'soon see why' $21.6K BTC price pump is fake — trader

Bitcoin (BTC) spiked to one-week highs on July 17 amid warnings that traders should not trust current BTC price action.BTC/USD 1-hour candle chart (Bitstamp). Source: TradingViewBinance inflows see multi-week highData from Cointelegraph Markets Pro and TradingView showed BTC/USD reaching $21,600 on Bitstamp, its best performance since last Sunday. The pair saw a fresh leg up during the weekend, this nonetheless coming on the back of thin, retail-driven “out-of-hours” liquidity with institutions out of the picture.Weekend pumps typically are not to be trusted Let’s see how this one holds going into the weekly close tomorrow— Rager (@Rager) July 16, 2022With Bitcoin prone to “fakeout” moves both up and down in such conditions, there was thus little appetite to believe that current trajectory would endure as the weekly close loomed.”Don’t let CT noise change your vision of how things really are,” popular social media account, Il Capo of Crypto, told followers on the day, referencing Crypto Twitter narratives.”Not worried about this scam pump. Still fully out of the market, soon you will see why.”Also preparing to exit the market, it appeared, were traders, as major exchange Binance saw heightened inflows in the 24 hours to the time of writing.According to data still being compiled from on-chain analytics platform CryptoQuant, on July 17, inflows neared 17,500 BTC, the most on a single day since June 22.Binance BTC inflows chart. Source: CryptoQuantNonetheless, some commentators remained upbeat on the short-term outlook. Cointelegraph contributor Michaël van de Poppe, who had called for $21,200 to break for upside to continue, got his wish as the market picked up overnight.”Overall, strength is still there and I’m assuming further upside is happening. Crucial barrier for now; $21K,” he had explained prior to the move. As Cointelegraph reported, potential upside targets included $22,000 and the 200-week moving average at around $22,600.The latest order book data from Binance via analytics resource Material Indicators meanwhile showed a fresh wall of buy support clustered at the $21,200 breakthrough point, worth some $20 million. BTC/USD order book data chart (Binance). Source: Material IndicatorsWeekly close keeps chart narrative fluidOn weekly timeframes, the July 17 close had the potential to be significant.Related: Bitcoin is now in its longest-ever ‘extreme fear’ periodAt $21,300, Bitcoin would not only seal its second “green” weekly candle but also its highest weekly close since early June.BTC/USD 1-week candle chart (Bitstamp). Source: TradingViewA matter of $500 nonetheless stood between that outcome and continuation of the downward trend, since the July 10 close had come in at around $20,850.That event, popular trader and analyst Rekt Capital noted at the time, marked a lower high for the week, alongside “declining buy-side volume.”The new #BTC Weekly Close shows that price has formed a new Lower High on declining buy-side volume$BTC #Crypto #Bitcoin pic.twitter.com/WqrnHgMQjK— Rekt Capital (@rektcapital) July 11, 2022

The views and opinions expressed here are solely those of the author and do not necessarily reflect the views of Cointelegraph.com. Every investment and trading move involves risk, you should conduct your own research when making a decision.

Čítaj viac

Bitcoin ready to attack key trendline, says data as BTC price holds $20K

Bitcoin (BTC) consolidated higher on July 16 after the Wall Street trading week finished with modest gains for United States equities.BTC/USD 1-hour candle chart (Bitstamp). Source: TradingViewCan Bitcoin bulls reclaim the 200-week moving average?Data from Cointelegraph Markets Pro and TradingView showed BTC/USD ranging between $20,500 and $21,000 into the weekend.The pair thus preserved the majority of its comeback from the week’s lows, these following shock U.S. inflation data and sparking weakness across risk assets.Now, out-of-hours trading meant that the classic scenario of breakouts and fakeouts on thin liquidity could accompany Bitcoin into the weekly close.Eyeing order book data from Binance, the largest global exchange by volume, showed key resistance clustered around the $22,000 mark should bulls attempt to nudge the market higher.For monitoring resource Material Indicators, however, there was a distinct possibility that Bitcoin could even challenge its 200-week moving average (WMA), a key bear market trendline lost as support over a month ago.#BTC is looking for another retest of the 200 WMA, currently ~$22.6k. #FireCharts pic.twitter.com/rRvbI8cPl2— Material Indicators (@MI_Algos) July 15, 2022″It’s easy to become bullish on BTC on a green day & bearish on a red day,” popular trader and analyst Rekt Capital added in separate comments. “But $BTC is still just ranging between $19K-$22K. This will continue until either of these levels is broken Intra-range moves aren’t substantial enough to dictate changes in sentiment.”As Cointelegraph reported, that sentiment achieved an unenviable record this week, as crypto markets capped their longest-ever period in a state of “extreme fear” as per the Crypto Fear & Greed Index.Miners feel the pinchMonitoring miner behavior, meanwhile, one analyst at on-chain analytics platform CryptoQuant sounded the alarm over a potential sell-off.Related: Bitcoin miners sell their hodlings, and ASIC prices keep dropping — What’s next for the industry?14,000 BTC was transferred from miner wallets on July 15, Binh Dang showed, and while not specifically indicative of selling, the phenomenon was worth tracking.”At this point, we can not be sure that this distribution is positive or negative, so we should be careful to watch out for the next few days,” he summarized in one of CryptoQuant’s Quicktake market updates.Separately, a new indicator, the Energy Gravity Model, covering Bitcoin production costs showed that miners were likely able to pay comparatively low amounts for energy in order to mine at a profit at current BTC spot prices.”Bitcoin Energy Gravity is the maximum USD price ($ / kWh) modern mining rigs are willing to buy electricity at to make a profit. ie: breakeven electricity rate,” the model’s creator, BlockWare analyst Joe Burnett, explained in a Twitter thread.”From this maximum bid price, it is possible to get a better understanding of when the price of Bitcoin is overextended and when the price may be approaching a bottom.”Bitcoin Energy Gravity Model. Source: Joe Burnett/ TwitterThe views and opinions expressed here are solely those of the author and do not necessarily reflect the views of Cointelegraph.com. Every investment and trading move involves risk, you should conduct your own research when making a decision.

Čítaj viac

Získaj BONUS 8 € v Bitcoinoch

nakup bitcoin z karty

Registrácia Binance

Burza Binance

Aktuálne kurzy