Autor Cointelegraph By William Suberg

Bitcoin bulls miss key resistance flip as BTC price sheds 8%

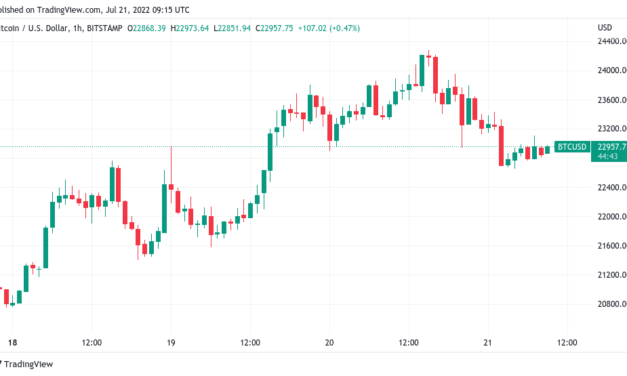
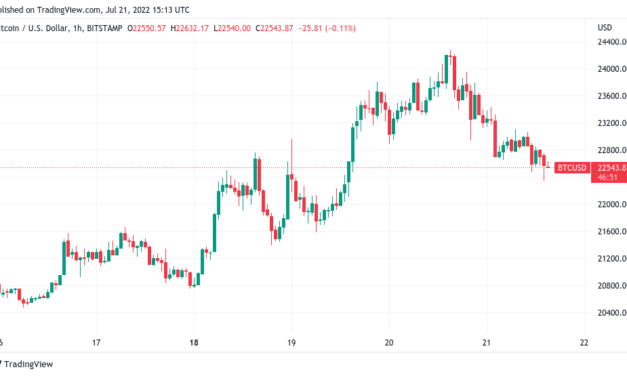
Bitcoin (BTC) extended losses on the July 21 Wall Street open after a key resistance level failed to hold as new support.BTC/USD 1-hour candle chart (Bitstamp). Source: TradingViewDollar rises to squeeze risk assetsData from Cointelegraph Markets Pro and TradingView showed BTC/USD dropping to $22,340 on Bitstamp after the opening bell, down 8% from its local top. The pair’s progress had seen a challenge from Tesla, which revealed that it had sold 75% of its BTC position at a loss. Macro events then added to Bitcoin’s woes in the form of fresh U.S. dollar strength and a surprise rate hike from the European Central Bank (ECB) to combat inflation.U.S. dollar index (DXY) 1-hour candle chart. Source: TradingViewAt the time of writing, the U.S. dollar index (DXY) had regained 107, up 0.6% in an hour as U.S. equities conversely saw modest losses. In Europe, meanwhile, the ECB decision failed to improve the fortunes of the euro, which gave back early gains as the Eurozone battled fresh political fallout in Italy.Good Morning on historic #ECB day from Italy where key interest rate should be at 6% & so 6ppts higher than current rate, acc to Taylor Rule w/Italy’s core #inflation at 3.4% way above ECB target & unemployment at 8.1% near NAIRU. ECB rates should be 7.4ppts higher for entire EZ. pic.twitter.com/1Nh8yg4e6A— Holger Zschaepitz (@Schuldensuehner) July 21, 2022″Curious to see if we get a similar breakdown on equities that like we did before,” popular trader Josh Rager tweeted, eyeing an S&P 500 fractal from late May. “Naturally, this would impact the price action of $BTC and crypto.”The macro impact had already cost Bitcoin its 200-week and 50-day moving averages at the time of writing, these both lingering at $22,800.”Unfortunately for bulls, BTC lost the 50-Day MA and the key 200-Week MA,” on-chain analytics resource Material Indicators wrote in part of its latest update, adding the nearest macro support level was now just below $20,000. Retest of the 50-Day MA validated the Trend Precognition signals on the D chart. Unfortunately for bulls, #BTC lost the 50-Day MA and the key 200-Week MA. The next technical support level is the green 21-Day MA just above the micro trend line. pic.twitter.com/r5m5HFl15i— Material Indicators (@MI_Algos) July 21, 2022

For popular trader and analyst Crypto Tony, $21,700 was now the level to preserve.Comparing 2022 to previous bear markets, meanwhile, he argued that Bitcoin should still be in line for some upside before another downmove — a perspective echoed elsewhere this week.$BTC / $USD – Update I have just gone over the prior bear markets while looking at time and the overall look. So far our move has taken 210 days while putting in the biggest drop with minimal relief I think more relief than another drop later this year pic.twitter.com/pqjDEgOy1b— Crypto Tony (@CryptoTony__) July 21, 2022

Altcoins echo loss of momentumOn altcoins, volatility was commonplace as large-cap tokens faced uncertain headwinds.Related: Price analysis 7/20: BTC, ETH, BNB, XRP, ADA, SOL, DOGE, DOT, MATIC, AVAXEther (ETH), previously the best performer in the top ten cryptocurrencies by market cap, fell up to 9.7% overnight.ETH/USD 1-hour candle chart (Binance). Source: TradingViewAt the time of writing, ETH/USD circled the $1,500 mark, while Cardano (ADA) and Solana (SOL) also lost around 10% in 24 hours.Commenting on the outlook, however, Jonah Van Bourg, head of trading at crypto liquidity provider Cumberland, pointed to Ethereum’s Proof-of-Stake transition as one factor to remain bullish on the largest altcoin.”While the price action of the recent past has been technical and highly macro-correlated, this move has been crypto-fundamental: the Sepolia testnet successfully merged to proof-of-stake on July 6th, setting the stage for an early-autumn mainnet merge,” one of a series of tweets published on the day read.The views and opinions expressed here are solely those of the author and do not necessarily reflect the views of Cointelegraph.com. Every investment and trading move involves risk, you should conduct your own research when making a decision.

Čítaj viac

BTC price battles 200-week moving average after $930M Tesla Bitcoin sale

Bitcoin (BTC) staged its first test of critical support on July 21 as news that Tesla had liquidated most of its Bitcoin holdings subsided. BTC/USD 1-hour candle chart (Bitstamp). Source: TradingViewBitcoin bulls attempt to flip key trendline to supportData from Cointelegraph Markets Pro and TradingView showed BTC/USD focusing on the $22,800 zone after dropping from multi-week highs of $24,280 on Bitstamp.The pair had reacted swiftly but comparatively modestly to the revelation by Tesla that its Bitcoin position was reduced 75%, or $936 million, in Q2.Comments by CEO Elon Musk which avoided direct criticism of the largest cryptocurrency appeared to help stem the losses. In the company’s earnings call, he stressed that the sell-off “should not be taken as some verdict on Bitcoin.”The move nonetheless put an end to several days of rampant upside, BTC/USD rising in line with stocks as U.S. dollar strength fell from twenty-year highs.$22,800 marks the 200-week moving average for the pair, a historically significant trendline lost as support in June and only passed in recent days.Interesting times here for $btc, flipped resistance and the 200 wma (blue line)Currently testing it as support which needs to hold for further upside.#crypto #btc https://t.co/SpLJELjq3L pic.twitter.com/cRKoQjaOC6— (@AskCryptoWealth) July 21, 2022For on-chain analytics resource Material Indicators, the immediate outlook was mixed. While daily timeframes expressed weakness, data still pointed to a broad recovery continuing on monthly chart.”Could mean a retest of the 50 Day Moving Average is in the near future, but also means we may not have seen the monthly high. Tune out the noise and look at the charts,” it told Twitter followers.The 50-day moving average stood in practically the same place as the 200-week moving average on the day.BTC/USD 1-day candle chart (Bitstamp) with 50, 200-day moving average. Source: TradingViewAn anatomy of a sell-offOther analysts meanwhile showed how Tesla divested itself of its BTC holdings in mid-June.Related: 100X Bitcoin energy use would mean ‘absurd’ $20M BTC price — developerOver a several-day period last month, inflows to exchanges spiked as over 63,000 BTC was released by market makers (MMs).MMs at Coinbase sent 63,638 $BTC to multiple exchanges, mostly Binance and Bitfinex, for the past 72 hours. All-time high in daily flows on June 12th.They’re executing someone(s)’ orders.Live Charthttps://t.co/WqbggqIoSD pic.twitter.com/r2gbnZ6yGG— Ki Young Ju (@ki_young_ju) June 15, 2022

According to data from on-chain analytics firm Glassnode, meanwhile, news of the sell-off was yet to be reflected in a significant reshuffling of exchange balances from panic sellers or opportunistic dip-buyers on the day.Bitcoin exchange reserve chart. Source: GlassnodeThe views and opinions expressed here are solely those of the author and do not necessarily reflect the views of Cointelegraph.com. Every investment and trading move involves risk, you should conduct your own research when making a decision.

Čítaj viac

Bitcoin may hit $120K in 2023, says trader as BTC price gains 25% in a week

Bitcoin (BTC) touched $24,000 at the July 20 Wall Street open as the good times kept rolling for crypto markets.BTC/USD 1-day candle chart (Bitstamp). Source: TradingViewBTC price rally “all macro driven”Data from Cointelegraph Markets Pro and TradingView showed BTC/USD passing its latest milestone after brief consolidation.24-hour gains for the pair remained at nearly 8% and weekly returns near 25% as Bitcoin and altcoins benefitted from a declining U.S. dollar and rising stock markets.Bitcoin’s rise had seen bulls reclaim key trendlines lost in June, but the jury remained out on whether the newfound strength could endure beyond the current weekly candle.”Bitcoin rally looking good? Yes. But BTC shall take no pride in this rally,” analyst Venturefounder commented. “BTC and NASDAQ correlation is still at 91% (historical high), and both of which are looking at the Fed policies, interest rate & recession concern forecast and $DXY for guidance. All is macro driven.”The U.S. dollar index (DXY) nonetheless showed no signs of staging its own successful recovery on the day, getting rejected at 107 after a local bottom.U.S. dollar index (DXY) 1-hour candle chart. Source: TradingViewPopular trader and analyst Josh Rager meanwhile demanded a “confident” tip to the $30,000 zone in order for Bitcoin to truly flip from bearish to bullish.Two weeks ago mentioned $BTC looked good for $28k with a breakoutSlowly but surely, would love to see this push up anoher 20%+ in order to take profits https://t.co/Mzl7wF76y2— Rager (@Rager) July 19, 2022Metric predicts up to $120,000 in 2023Zooming out, one Bitcoin price indicator led analyst TechDev to believe that BTC/USD would see a new all-time high before its next block subsidy halving in 2024.Related: 100X Bitcoin energy use would mean ‘absurd’ $20M BTC price — developerTechDev flagged the True Strength Index (TSI) for Bitcoin, a metric which uses several base calculations to determine how overbought or oversold the asset is at a particular price.The price decline since the last all-time high in November 2021 remains on-trend, he argued, and thus the potential for historical patterns to repeat themselves.As such, I expect:- Intermediate wave 5 top at 80-120K in 2023- Primary wave 4 down to 30-50K in 2024- Primary wave 5 over 200K in 2025 to conclude cycle wave 3Detailed chart with supporting evidence is forthcoming.I’m sure now that it’s written down it won’t happen.4/4 pic.twitter.com/iRx5PUSGSU— TechDev (@TechDev_52) July 20, 2022

A recovery underway in Bitcoin’s relative strength index (RSI) additionally caught the attention of Stock-to-Flow model creator PlanB.The views and opinions expressed here are solely those of the author and do not necessarily reflect the views of Cointelegraph.com. Every investment and trading move involves risk, you should conduct your own research when making a decision.

Čítaj viac

Bitcoin holds 5-week high as trader suggests ‘parabolic' bear trend is over

Bitcoin (BTC) took aim at $24,000 on July 20 after a night of solid gains put bulls in the driving seat.BTC/USD 1-hour candle chart (Bitstamp). Source: TradingViewParabolas violatedData from Cointelegraph Markets Pro and TradingView followed BTC/USD as it breached $23,800, its highest levels since June 13.Against expectations, crypto staged a recovery beyond an intra-hour “fake-out” as risk assets benefitted from declining U.S. dollar strength.The inverse correlation between the U.S. dollar index (DXY) and Bitcoin remained center stage on the day, with the greenback coming off twenty-year highs at the end of the week prior.U.S. dollar index (DXY) vs. BTC/USD 1-day candle chart. Source: TradingView“The Dollar is taking a nice hit today from the bears,” popular trader Crypto Tony told Twitter followers as the breakout took shape.“Good sign for Bitcoin as things cool off for the DXY.”$DXY has broken the Parabolic Trend (Parabola) that has been formed since Jan 7, 2021.It’s time to pay attention. pic.twitter.com/xg344NrOCw— wolf (@ImNotTheWolf) July 19, 2022Fellow analyst Wolf meanwhile eyed the breakdown of a “parabolic trend” in place on DXY throughout 2022. At the same time, as per analysis from popular trader Jibon, BTC/USD had ended its parabolic run to macro lows.#Bitcoin Parabolic Run is Over As Expected pic.twitter.com/1uuu0AfKKD— Trader_J (@Trader_Jibon) July 20, 2022

Those “expectations” referred to a strategy forecasting BTC/USD rising to $40,000 before another bearish phase puts in a fresh macro bottom.Major trendlines see a sudden testReturning to current price action, meanwhile, significance came in the form of crucial trendlines being broken.Related: 100X Bitcoin energy use would mean ‘absurd’ $20M BTC price — developerAmong them were the 200-week moving average (WMA) at $22,800 and Bitcoin’s realized price at $21,934 as of July 19, data from on-chain analytics firm Glassnode confirmed.Bitcoin realized price chart. Source: GlassnodeBoth are classic fixtures in Bitcoin bear markets, with BTC/USD usually wicking below while preserving the levels as basic support.Attention thus focused on the weekly close, which would confirm a breakout from the 200 WMA.$BTC 1DHard to believe but #bitcoin has broken the 50 DMA, 200 WMA (confirms week close), major upward resistance, & Bear Flag all in the same day.Shorting a breakout isn’t the best idea. I TP’d a bit early on longs but will reenter on a retest of support.#cryptocurrency pic.twitter.com/BDwf0f67GK— Roman (@Roman_Trading) July 19, 2022

The views and opinions expressed here are solely those of the author and do not necessarily reflect the views of Cointelegraph.com. Every investment and trading move involves risk, you should conduct your own research when making a decision.

Čítaj viac

Bitcoin lurks by $22K as US dollar falls from peak, Ethereum gains 20%

Bitcoin (BTC) hugged $22,000 on July 19 as macro conditions slowly turned to favor risk assets. BTC/USD 1-hour candle chart (Bitstamp). Source: TradingViewStocks, crypto rise as dollar weakensData from Cointelegraph Markets Pro and TradingView showed BTC/USD cooling volatility immediately below the crucial 200-week moving average (WMA).The Wall Street open saw further gains for United States equities in the face of a declining U.S. dollar, which extended its retracement after hitting its latest two-decade peak.The U.S. dollar index (DXY) stood at around 106.5 at the time of writing, down 2.6% from the high seen July 14.For Bitcoin analysts, it was thus a case of wait and see as markets bided their time between buy and sell levels.$BTC / $USD – Update These are the options on #Bitcoin right .. If we can sustain above the $21,700 range high and gain momentum, we can pump for the wave 3 ..However, if we die down i am looking for another corrective wave down .. pic.twitter.com/cLGVGdTivK— Crypto Tony (@CryptoTony__) July 19, 2022″Shared this chart before, but just like that the $DXY is tanking, resulting into risk-on assets showing some momentum,” Cointelegraph contributor Michaël van de Poppe tweeted in an update on the day alongside a DXY chart. “Yields need to drop now too, but the weakness on the Dollar could put more strength on crypto and Bitcoin.”U.S. dollar index (DXY) 1-hour candle chart. Source: TradingViewOn-chain monitoring resource Material Indicators, meanwhile, flagged the difference in strength between “psychological” levels such as $21,000 and $22,000 and the 200 WMA closer to $23,000.”IMO, resistance at $21k and $22k are psychological, whereas the 200 WMA serves as legit technical resistance. FireCharts shows more BTC bid liquidity coming in to support an R/S flip at $21k,” it told Twitter followers on the day publishing data from the Binance order book. “Looking for more bid liquidity to challenge the ever important 200 WMA.”BTC/USD order book data (Binance). Source: Material Indicators/ TwitterThe day belongs to EthereumDeja vu for altcoin traders, meanwhile, came in the form of outperformance from Ether (ETH) versus other major cryptocurrencies’ intraday gains.Related: 100X Bitcoin energy use would mean ‘absurd’ $20M BTC price — developerETH/USD, already up 25% in a week, added to its momentum overnight, climbing another 20% in just over 24 hours to briefly pass $1,600.Resistance in the form of the 2018 high at $1,530 posed little problem for bulls, with the level forming a support focus at the time of writing.”Ethereum relative to Bitcoin has closed above a key resistance,” popular trading account Game of Traders forecast.”Buckle up for some big moves.”ETH/USD 1-day candle chart (Binance). Source: TradingViewThe views and opinions expressed here are solely those of the author and do not necessarily reflect the views of Cointelegraph.com. Every investment and trading move involves risk, you should conduct your own research when making a decision.

Čítaj viac

Získaj BONUS 8 € v Bitcoinoch

nakup bitcoin z karty

Registrácia Binance

Burza Binance

Aktuálne kurzy