
Autor Cointelegraph By William Suberg

Bitcoin dips below $78K as stocks, gold fall on higher US PCE Inflation data

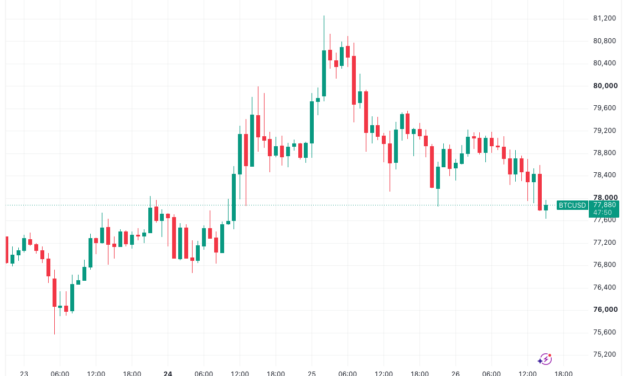
Bitcoin (BTC) slipped under $78,000 following Wednesday’s Wall Street open after US inflation data came in above expectations.Key points:Bitcoin sees further downside after US PCE inflation data came in 0.1% higher than expected in July.Markets await Nvidia Q2 earnings release as Wednesday’s next potential volatility catalyst.BTC price analysis warns over 25% weekly gains forming a bear market relief rally.Higher-than-expected PCE data pressures BitcoinData from TradingView tracked up to 1% daily BTC price losses, with US stocks also opening lower and gold breaking below $4,600 per ounce.BTC/USD one-hour chart. Source: Cointelegraph/TradingViewThe downside came after the July print of the US Personal Consumption Expenditures (PCE), known as the Federal Resrve’s “preferred” inflation gauge, hit 3.7% year-on-year, above the anticipated 3.6%.“From the preceding month, the PCE price index for July increased 0.2%. Excluding food and energy, the PCE price index also increased 0.2 %,” the Bureau of Economic Analysis’ (BEA) official release confirmed.US PCE index data (screenshot). Source: BEAMarkets appeared disappointed by the results following June’s unexpected drop in PCE gains, which included their first month-on-month decrease in six years.“US inflation continues to run at nearly double the Fed’s 2.0% target,” trading resource The Kobeissi Letter responded in a post on X.The PCE numbers come a day before the Fed’s annual Jackson Hole economic symposium, with chair Kevin Warsh due to make the keynote speech on Friday.Investors are watching for today’s Q2 earnings report from technology giant Nvidia report, anticipated to bring short-term risk-asset volatility. The company is expected to record $92.3 billion quarterly revenue, including CPU revenue that analysts at Raymond James forecast could grow from 3% to 5% of NVDA’s total by 2028, expanding its addressable market.Related: Supply absorption ‘key question’ as Bitcoin fails to reclaim $80K: AnalysisAnalyst sets key targets for BTC price monthly closeExamining recent price action, Bitcoin market participants turned to the upcoming August monthly candle close.Urging a cautious approach, trader and analyst Rekt Capital warned that BTC/USD was in danger of continuing its series of lower highs in place since October 2025. “A Monthly Close below the blue resistance would not just solidify another Macro Lower High but would also build a confluent resistance in association with the Macro Downtrend,” he commented on X alongside a chart showing a downward-sloping resistance trend line.BTC/USD one-month chart. Source: Rekt Capital on X.comRekt Capital added that unless the cycle of lower highs was broken, Bitcoin’s rebound over the past week could still be classed as a “relief rally” within the broader bear market. He focused on the 50-week exponential moving average (EMA) at $77,251 as a further trend line to reclaim and hold going forward, with Bitcoin’s last monthly close above it coming in October 2025.BTC/USD one-month chart with 50-week EMA. Source: Cointelegraph/TradingView

Čítaj viac
Supply absorption ‘key question’ as Bitcoin fails to reclaim $80K: Analysis

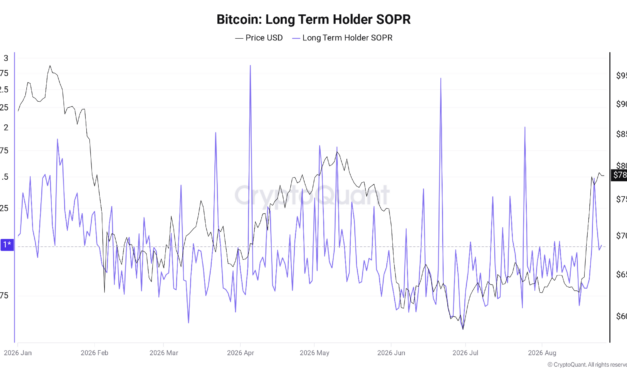
Bitcoin (BTC) remains sensitive to sell-side pressure at $80,000, even as investors broadly avoid mass profit-taking.Key points:Bitcoin investors’ unrealized profit and loss crosses above zero for all cohorts, apparently slowing price momentum.Long-term holders see a spike in profitability to 1.48, while short-term holders still account for the majority of in-profit coins moving onchain.The Coinbase premium fails to return to positive territory at -0.015, underscoring lackluster US demand.Older Bitcoin investors reactivate around 14-week highsData from onchain analytics platform CryptoQuant reveals that older coins in particular moved onchain as BTC/USD gained more than 25% over the past week. The spent output profit ratio (SOPR), which is the ratio of the current value of recently spent UTXOs to their value at creation, ticked up to 1.48 on Aug. 22, indicating increased onchain activity involving in-profit coins. Bitcoin LTH-SOPR. Source: CryptoQuantAs price consolidated around $79,500, the so-called SOPR ratio, which divides the SOPR of short-term holders (STH) by that of long-term holders (LTHs), hit 1.4, its highest reading since July 25.  STH and LTH refer to wallets that hold BTC without selling for up to six months (STH) or longer than six months (LTH). “This suggests long-term holders were realizing profits at a higher relative rate than short-term holders. The ratio has since fallen to 0.93, indicating that short-term holders’ realized performance is now relatively stronger,” CryptoQuant commented about the latest readings in a blog post on Tuesday.The SOPR ratio has formed a broad downtrend since early 2025, and at the end of June hit 0.62, its lowest levels in three years as BTC/USD dropped to $58,000. Despite only reversing modestly higher, price has still failed to stay above $80,000.Bitcoin SOPR ratio. Source: CryptoQuantCryptoQuant notes that all holder cohorts are now in profit on aggregate, presenting a potential hurdle to further gains that only sustained buyer support could overcome. “The key question is not whether Bitcoin can briefly touch $80,000, but whether new demand can absorb selling from profitable holders,” it summarized, suggesting that this demand could come from ongoing return of inflows to the US spot Bitcoin exchange-traded funds (ETFs).Bitcoin unrealized profit/loss data by wallet cohort. Source: CryptoQuantUS investor demand remains weakOther data suggests that in spite of hitting local highs, Bitcoin has not yet convinced the broader investor base to return to the market.Related: BTC RSI bullish divergence draws 2022 comparisons as analysis weighs new price trendCryptoQuant shows that the Coinbase premium — the difference in price between Coinbase’s and Binance’s BTC/USDT pairs — remains negative, moving above its zero line just briefly on hourly time frames as price broke above $78,500.“The next key signal will be whether the index can cross above zero and remain positive. If Bitcoin continues recovering while the Coinbase premium turns positive, the market could shift from ‘selling pressure is easing’ to a stronger phase of renewed U.S. spot demand,” CryptoQuant analysis stated this week.The Coinbase premium reflects US investor demand and has been broadly negative throughout 2026. As of Wednesday, it measured -0.015, up from -0.094 at the start of August.Bitcoin Coinbase premium index. Source: CryptoQuant

Čítaj viac

Bitcoin slips from $80K as gold cools with falling US bond yields

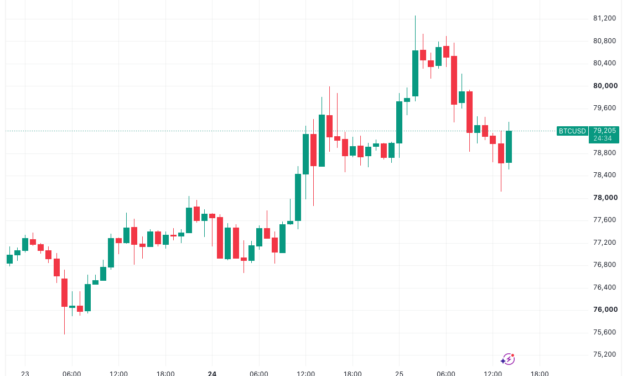
Bitcoin (BTC) fell below $80,000 into Tuesday’s Wall Street open as crypto and gold gave way to gains in US equities.Key points:Bitcoin upside momentum fizzles as $80,000 proves difficult to flip to support.Gold joins BTC price downside after multimonth highs of $4,697 per ounce as US 30-year bond yields target three-week lows.Attention switches from bonds to US inflation data and Nvidia earnings tomorrow.Bitcoin price struggles to cement $80,000 reclaimData from TradingView showed BTC/USD falling as low as $78,111 on Bitstamp after reaching new 14-week highs of $81,265.BTC/USD one-hour chart. Source: Cointelegraph/TradingViewThe $80,000 zone, which traders previously earmarked as an area of strong sell pressure, proved difficult to reclaim as US trading hours appeared to increase downside across both Bitcoin and gold. XAU/USD saw local lows of $4,605 per ounce, down nearly 2% on the day. XAU/USD one-hour chart. Source: Cointelegraph/TradingViewUS stocks moved inversely to gold and crypto last week, coming under pressure as both rallied. This divergence has continued this week, with the S&P 500 and Nasdaq Composite Index posting modest daily gains of 0.2% and 0.5%, respectively.Nasdaq Composite Index one-day chart. Source: Cointelegraph/TradingViewThe comparative strength appeared to mostly brush off a brewing trade-tariff spat between the US and Canada in which negotiations recently broke down. In his latest posts on Truth Social, US president Donald Trump accused Canada of “ripping off” the US.“Over the last 10 years, the United States lost, on average, 60 Billion Dollars a year with Canada. No more!” he pledged.US government bond yields continued to cool on the day, with 30-year yields dropping below 5.2% and eyeing their lowest levels since Aug. 7. Last week’s crypto surge came as yields hit heights not seen since January 2007 and the US Treasury announced bigger debt buyback operations to tame the upside.US 30-year bond yield one-day chart. Source: Cointelegraph/TradingViewCommenting on the prospect of further bond-market interventions in the future, trading resource The Kobeissi Letter suggested that interest-rate cuts — a key potential liquidity driver for crypto markets — were not an option in the current inflation environment.“The reality is that the Fed cannot cut rates in this environment and the Trump Administration knows this. So, direct bond market intervention is the only solution to drive interest rates and yields lower over the short-run,” it wrote in a post on X. “Our view? Don’t fight the Treasury.”As Cointelegraph reported, market consensus calls for an ongoing rate-hike freeze at the Fed’s September meeting, with the odds of this outcome currently at 61.9%, per data from CME Group’s FedWatch Tool.Fed target-rate probabilities for September FOMC meeting (screenshot). Source: CME GroupPCE, Nvidia earnings on the radarDiscussing the immediate macro outlook, trading firm QCP Capital shifted the focus away from the Treasury toward fresh US inflation data and the Fed’s Jackson Hole economic symposium, taking place from Aug. 27-29.Related: First bear-market trend line reclaim since 2025: Five things to know in Bitcoin this weekWednesday will see the July print of the Personal Consumption Expenditures (PCE) index, known as the Fed’s preferred inflation gauge, which saw its first month-on-month decrease since 2020 past June. Tech giant Nvidia, meanwhile, will also report earnings on Wednesday, adding another potential risk-asset volatility catalyst.

Čítaj viac

Bitcoin RSI bullish divergence draws 2022 comparisons as analysis weighs new price trend

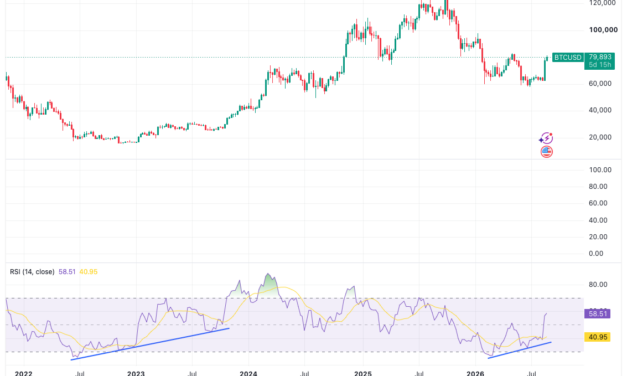
Bitcoin (BTC) price action is offering mixed signals after hitting $80,000 as traders diverge on market trajectory.Key points:Bitcoin weekly relative strength index (RSI) reaches 58.3, repeating a bullish divergence that accompanied the end of the 2022 bear market.Daily RSI values reach their most “overbought” since November 2024 near 83.Stochastic RSI prints a key crossover but avoids copying previous zero-level bear-market lows.Weekly RSI echoes Bitcoin’s 2022 bear-market bottomRelative strength index (RSI) data across daily, weekly and two-month time frames has added to the debate over whether last week’s 25% rebound by Bitcoin will endure.RSI is a classic indicator for trend momentum. It uses an asset’s average gain or loss over a given lookback window, normally 14 days, to determine the strength of its current trend momentum. For Bitcoin, bullish divergences with price, where RSI makes higher highs while BTC/USD makes lower lows, have accompanied the start of major trend inflections. In mid-2022, around six months before the end of Bitcoin’s last bear market, weekly RSI began a bullish divergence, locking in higher lows while BTC/USD saw lower lows. Throughout 2026, a similar pattern emerged, data from TradingView shows.BTC/USD one-week chart with RSI bullish divergences. Source: Cointelegraph/TradingViewWhile short-term RSI signals present a less reliable picture of overall price trends, weekly signals have led some to rethink the status of the current bear market.“Weekly is the timeframe that matters here, that’s where you read the secular trend and the cycle inflection points,” Jamie Coutts, chief crypto analyst at Real Vision, wrote in a post on X on Tuesday.Coutts described weekly bullish divergences as having “real weight,” citing price upside that resulted from previous divergence events.Weekly RSI currently measures 58.3, its highest levels since BTC/USD hit its latest all-time high of $126,200 in October 2025, having broken through a trend of lower highs. On daily time frames, RSI is now in “overbought” territory at 82.93.BTC/USD one-day chart with RSI data. Source: Cointelegraph/TradingViewMarket participants are split over the implications of the daily readings, which are the highest since November 2024. Some see RSI giving a warning sign of an imminent reversal, while others point to the fact that historically, Bitcoin uptrends have been accompanied by multiple “overbought” periods, where RSI is above 70.In his latest analysis, Jonatan Randin, senior market analyst at crypto trading platform PrimeXBT, flagged more similarities to late 2022. At the time, daily RSI increased from 40 to 90 over a single weekly candle.“An extreme move like this usually signals the start of something new,” he told X followers. “It doesn’t necessarily mean that the bear market is over but it is telling us something. I think what it’s trying to tell us is that we are about to enter a new phase of this cycle.”BTC/USD RSI comparison chart. Source: Jonatan Randin on X.comStochastic RSI prints anticipated crossoverPreviously, Cointelegraph reported on expectations that Bitcoin’s two-month stochastic RSI indicator would repeat historical patterns to provide a clear signal over the end of the bear market.Related: First bear-market trend line reclaim since 2025: Five things to know in Bitcoin this weekStochastic RSI privileges more recent price moves, with a crossover of its two constituent trend lines acting as a cue for bullish trend change. This event has now occurred. However, the indicator reached only 4.81, avoiding the macro lows near zero that preceded previous crossovers.BTC/USD two-month chart with stochastic RSI data. Source: Cointelegraph/TradingView

Čítaj viac
Bitcoin price hits $80K as 24-hour crypto short liquidations pass $220M

Bitcoin (BTC) passed $80,000 after Monday’s Wall Street open as bulls built on last week’s snap BTC price rally.Key points:Bitcoin hits $80,000 for the first time since mid-May as bullish momentum gathered pace.BTC price analysis warns that the market still needs to sustain higher levels to challenge the bear-market thesis.Bitcoin returns to $80,000 after 100-day hiatusData from TradingView showed BTC/USD passing the $80,000 for the first time since May 15, up another 3% on the day before pulling back following the European close.Source: TradingViewThe move spurred an uptick in crypto short liquidations, with these passing $220 million over the 24 hours to the time of writing, per data from CoinGlass. A band of bid liquidity centered on $76,700, potentially offering support in the event of a downward BTC price reversal.BTC liquidation heatmap. Source: CoinGlassAnalyst: BTC rebound must prove staying powerBitcoin was up 25% month-to-date, seeing its best August performance since 2017 and increasingly diverging from bear-market norms. Earlier, Cointelegraph reported on concerns among some traders that bearish history could still repeat, with downside reemerging from September onward to spark a final capitulation to new macro lows. Related: BTC price loses 200-week trend line as 2022 repeats: Five things to know in Bitcoin this week“Bitcoin has Weekly Closed at the highs. Now starts the real test,” trader and analyst Rekt Capital wrote in his latest market commentary on X.“If this is a Bear Market Relief Rally, then Bitcoin could pullback as early as this week, or at least over the next few weeks. Now it’s all about Bitcoin proving sustained strength.”Rekt Capital had eyed the 50-week exponential moving average in particular, currently at $77,251, as price achieved its first weekly close above it since November 2025. During Bitcoin’s 2022 bear market, BTC/USD achieved two weekly closes above that trend line before dropping to cycle lows.Magazine: Bitget CEO isn’t buying the Bitcoin rally — She’s waiting for $50KThis article is produced in accordance with Cointelegraph’s Editorial Policy and is intended for informational purposes only. It does not constitute investment advice or recommendations. All investments and trades carry risk; readers are encouraged to conduct independent research.

Čítaj viac

Získaj BONUS 8 € v Bitcoinoch

nakup bitcoin z karty

Registrácia Binance

Burza Binance

Aktuálne kurzy

