Autor Cointelegraph By William Suberg

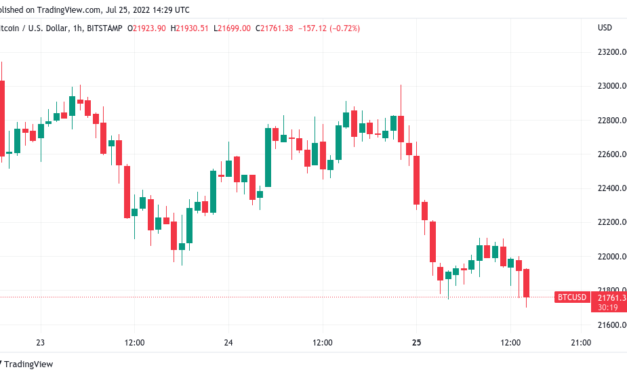
Bitcoin drops below $21.8K realized price as FOMC spooks markets

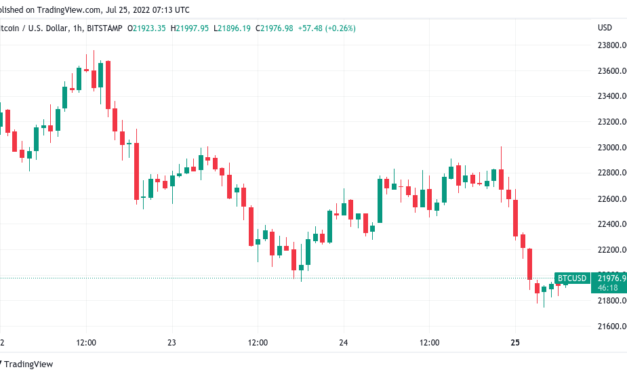
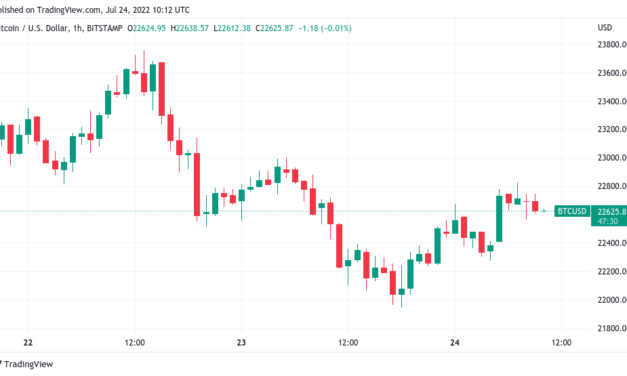
Bitcoin (BTC) stuck to its realized price just below $22,000 on July 25 as Wall Street opened with a flat performance.BTC/USD 1-hour candle chart (Bitstamp). Source: TradingViewBitcoin gives up more key levelsData from Cointelegraph Markets Pro and TradingView tracked BTC/USD as it consolidated after falling from $23,000 overnight.The pair echoed equities in cool trading prior to the July 27 United States Federal Reserve decision on interest rates. Analysts were expecting several days of volatility, and despite buyer interest in Bitcoin being strong below spot price, everything could still change.No guarantee any support holds after Wednesday’s #FED announcement, but for now #FireCharts shows a ladder of #Bitcoin bids around these next technical support levels. https://t.co/Ng2Rqc0Op7 pic.twitter.com/W6veJMS2YJ— Material Indicators (@MI_Algos) July 25, 2022“Big week ahead for the markets,” Umar Ashraf, founder of trading tool TradeZella, forecast. “Tons of big names reporting earnings alongside with the FOMC starting Tuesday followed by the announcement on Wednesday. Big week doesn’t always mean market must see action, it could be a time period for the market to digest info for next move.”With traders primed for reactions, Bitcoin became unsettled by struggling to hold any of its 200-week moving averages (MA), 50-day MAs or realized prices, these lying at $22,700, $22,200 and $21,850, respectively.BTC/USD 1-day candle chart (Bitstamp) with 50, 200-day moving average. Source: TradingViewThe last of these, the price at which the average Bitcoin last moved, had been reclaimed as support just a week prior. Comparing realized price behavior this year to previous bear market years, analyst Root warned that the next step could be another extended dive below the trendline. Cycle comparison: either we find support here or we might get another arch below realized price like in 2014.Macro might indicate the latter.#Bitcoin #onchain pic.twitter.com/zfphUK2mzv— Root (@therationalroot) July 25, 2022

Adopting a more hopeful outlook, meanwhile, PlanB, creator of the stock-to-flow Bitcoin price models, noted that the speed with which Bitcoin bounced above its 200-week MA this month could belie underlying strength absent from similar bear phases.“Normally it takes a lot longer after BTC goes below realized price, for BTC to jump back above 200-week moving average. But it already did,” he explained. “Also, 200-week moving average and realized price already touched (that normally also takes longer).”Bitcoin realized price chart. Source: GlassnodeSmall fish scoop up dumped institutional coinsData, meanwhile, showed the extent of supply migration from larger to smaller investors in recent months. Related: Will the Fed prevent BTC price from reaching $28K? — 5 things to know in Bitcoin this weekIn its latest research, crypto analytics firm Arcane Research calculated the combined selling by institutional sources to be over 236,000 BTC since May 12, the time of the Terra LUNA —now the Terra Classic (LUNC) — blowout.”The 236,237 BTC number is derived from massive institutional blow-ups and other large known selling seen during the market stress in the last two months,” it wrote. “The number does not account for other natural capitulation and hedging activity that usually occurs during crypto bear markets.”Bitcoin institutional sales chart (screenshot). Source: Arcane ResearchMeanwhile, data from fellow on-chain analytics platform Glassnode showed that entities with 1 BTC or less in their possession were increasing faster than ever as an overall proportion of the BTC supply. Entities with less than 1 #bitcoin are accumulating more now than ever pic.twitter.com/0sw56jg0Iq— Documenting Bitcoin (@DocumentingBTC) July 25, 2022

The trend had strengthened sharply in 2022 in particular, the data, uploaded to Twitter by popular  account Documenting Bitcoin showed.The views and opinions expressed here are solely those of the author and do not necessarily reflect the views of Cointelegraph.com. Every investment and trading move involves risk, you should conduct your own research when making a decision.

Čítaj viac

Will the Fed prevent BTC price from reaching $28K? — 5 things to know in Bitcoin this week

Bitcoin (BTC) enters a new week with a question mark over the fate of the market ahead of another key United States monetary policy decision.After sealing a successful weekly close — its highest since mid-June — BTC/USD is much more cautious as the Federal Reserve prepares to hike benchmark interest rates to fight inflation.While many hoped that the pair could exit its recent trading range and continue higher, the weight of the Fed is clearly visible as the week gets underway, adding pressure to an already fragile risk asset scene.That fragility is also showing in Bitcoin’s network fundamentals as miner strain becomes real and the true cost of mining through the bear market shows.At the same time, there are encouraging signs from some on-chain metrics, with long-term investors still refusing to give in.Cointelegraph takes a look at the week’s possible market movers in a tense week for crypto, equities and more.Fed to decide on next rate hike in “another fun” weekThe story of the week, all things being equal, is no doubt the Federal Reserve rate hike. A familiar tale, the Federal Open Markets Committee (FOMC) on July 26-27 will see policy makers decide on the extent of the next interest rate move, this tipped to be either 75 or 100 basis points.U.S. inflation, as in many jurisdictions, is at forty-year highs, the its advance appears to have caught the establishment by surprise as calls for a peak are met with even larger gains.“Should be another fun one,” Blockware lead insights analyst William Clemente summarized on July 25.The interest rate decision is due July 27 at 2pm Eastern time, a diary date which could well be accompanied by increased volatility across risk assets. This has the potential to be exacerbated, one analyst warned, thanks to low summer liquidity and a lack of conviction among buyers.“Entering ECB/FOMC/Tech Earnings amid the lowest liquidity of the year. Market is back to overbought. Bulls, let it ride,” Twitter account Mac10 wrote.A previous post also flagged Q2 earnings reports as potentially contributing to a downwards move in line with previous behavior.Tech Earnings and FOMC have been catalyst for two major crashes in 2022. “This time will be different” pic.twitter.com/XgS1dDOLce— Mac10 (@SuburbanDrone) July 22, 2022“BTC and risk assets have pumped higher on FOMC events this year, only to sell off after, is this time different?” fellow analysis account Tedtalksmacro continued. “June’s FOMC meeting saw the US federal reserve deliver a 75bps hike – the single largest since 1994. More hefty hikes are expected before inflation is ‘normalised.’”The week is already feeling different to last, even before events begin unfolding — Asian markets are flat in comparison to last week’s bullish tone, one which accompanied a resurgence across Bitcoin and altcoins.While one argument says that the Fed cannot raise rates much more without tanking the economy, meanwhile, Tedtalksmacro pointed to the employment market as a target for keeping hikes coming.“Bitcoin will struggle to move past 28k until data deteriorates,” he added.Spot price fails to nail key moving averageBitcoin’s latest weekly close was something of a halfway house for bulls, data from Cointelegraph Markets Pro and TradingView shows. While managing its best performance in over a month, BTC/USD missed out on reclaiming the essential 200-week moving average (MA) at $22,800.BTC/USD 1-hour candle chart (Bitstamp). Source: TradingViewAfter the close, which came in at around $22,500, Bitcoin began falling to the bottom of its latest trading range, still lingering below $22,000 at the time of writing. Good morning legends Range high dump during the overnight session on $ETH and $BTC .. Looking for some relief if we can hold $1460 on $ETH and $21,700 on $BTC Chart updates to come — Crypto Tony (@CryptoTony__) July 25, 2022

“Observing IF we find support at $21,666 horizontal. Patience,” popular trader Anbessa told Twitter followers in his latest update.Fellow account Crypto Chase meanwhile suggested that a return to the 200-week MA would result in further modest upside.“Chopping around the Daily S/R (red box) with an inability to flip 22.8K (Daily resistance) to support. Multiple attempts to do so, but failing so far,” he wrote alongside explanatory charts. “If price pushes above again and finds acceptance, I’ll watch 22.8K to become support for potential long entry to 23.2K.”A later update eyed $21,200 as a potential bearish target, this also forming a support/resistance level on the daily chart.At $21,900, however, Bitcoin still remains around $1,200 higher versus the same point a week ago. BTC/USD 1-week candle chart (Bitstamp) with 200-week MA. Source: TradingViewElsewhere, the latest price action was not enough to change long-term views. For Venturefounder, a contributor at on-chain analytics firm CryptoQuant, a macro bottom was yet to appear, this potentially coming in as low as $14,000.“Inline with the past halving cycles, this is still my most viable forecast for Bitcoin before next halving: BTC will capitulate in the next 6 months & hit cycle bottom (anywhere between $14-21k), then chop around in $28-40k in most of 2023 and be at ~$40k again by next halving,” a retweeted forecast originally from June reiterated.Difficulty returns to March levelsIn a sign that miners’ troubles due to price weakness may only just be beginning, upheaval is now visible across the Bitcoin network.Difficulty, the measure of competition among miners which adjusts itself relative to participation, has been declining since late June and is now back at levels not seen since March.The most recent adjustment was particularly noticeable, knocking 5% off the difficulty total and heralding change in miner activity. That was the largest single drop since May 2021, and the next, due in ten days’ time, is currently estimated to take difficulty down another 2%.As arguably the most important aspect of the Bitcoin network itself, difficulty adjustments also set the scene for recovery by leveling the playing field for miners. The lower the difficulty, the “easier” — or less energy-intensive — it is to mine BTC due to there being less competition overall.For the meantime, however, the need to stay afloat remains a preoccupation, data shows. According to CryptoQuant, miners sent 909 BTC to exchanges on July 24 alone, the most in a day since June 22 and 5% difficulty decrease.A turnaround for miners thus remains out of sight this week.Bitcoin network fundamentals overview (screenshot). Source: BTC.comAs Cointelegraph additionally reported, it is not just the BTC price which is giving miners a hard time under current conditions.Congratulations to the MVRV-Z scoreOne of the hottest on-chain metrics in Bitcoin has just crossed what is arguably its most important level — zero.On July 25, Bitcoin’s MVRV-Z Score returned to negative territory after a brief week above, in so doing falling into the zone typically reserved for macro price bottoms. #Bitcoin $BTC MVRV Z-Score just crossed 0.Before: 0.010 – > Now: -0.000View metric:https://t.co/IBVIM3J84o pic.twitter.com/DRGqIxKW7w— glassnode alerts (@glassnodealerts) July 25, 2022

MVRV-Z shows how overbought or oversold BTC is relative to “fair value” and is popular thanks to its uncanny ability to define price floors.Its return could signal a fresh period of price pressure, as accuracy in catching bottoms has a two-week margin of error.At the beginning of July, Cointelegraph reported on MVRV-Z giving a worst case scenario of $15,600 for BTC/USD this time around.Sentiment cools from four-month highsFor the crypto market, the past week may well have been a brief period of irrational exuberance if sentiment data is to be believed.Related: Top 5 cryptocurrencies to watch this week: BTC, ETH, BCH, AXS, EOSThe latest numbers from the Crypto Fear & Greed Index show a steady decline from what has been the most positive market sentiment since April.As of July 25, the Index stands at 30/100 — still described as “fear” driving the mood overall but still five points above the “extreme fear” bracket in which the market previously spent a record 73 days. Sentiment has nonetheless made quite the comeback since mid-June, when Fear & Greed hit some of its lowest levels on record at just 6/100.Crypto Fear & Greed Index (screenshot). Source: Alternative.meThe views and opinions expressed here are solely those of the author and do not necessarily reflect the views of Cointelegraph.com. Every investment and trading move involves risk, you should conduct your own research when making a decision.

Čítaj viac

Bitcoin must close above $21.9K to avoid fresh BTC price crash — trader

Bitcoin (BTC) found strength at $22,000 into July 24 with bulls still aiming for a solid green weekly close.BTC/USD 1-hour candle chart (Bitstamp). Source: TradingViewClassic levels for end-of-week price focusData from Cointelegraph Markets Pro and TradingView showed BTC/USD halting a weekend drop at $21,900 to return towards the $23,000 on the day.The pair held a trading range closely focused on key long-term trendlines, which analysts had previously described as essential to reclaim.These included the 50-day and 200-week moving averages (MAs), the latter particularly important as support during bear markets but which had acted as resistance since May.“Bullish that we perfectly held the 13d ema + horizontal 21.9k,” popular Twitter trading account CryptoMellany argued in part of her latest update on the day. “I think we’ll hang around 22.5k for today’s weekly close, new week starting with action down to 21-21.6k and then up for the rest of the week, forming a bull flag.”The 50-day and 200-week MAs stood at $22,370 and $22,690, respectively, at the time of writing, with spot price at $22,670.BTC/USD 1-day candle chart (Bitstamp) with 50, 200-day moving average. Source: TradingViewContinuing, fellow trader and analyst Jibon described the upcoming weekly close as “very very important.” An accompanying chart singled out $21,944 and $22,401 as the lines in the sand for a “bad” or “good” close.Earlier in the week, Jibon had warned that such a “bad” result could be the start of a retracement to new macro lows for Bitcoin — as low as $12,000 — which continued strength could fuel a relief rally as high as $40,000.If it were to close at current levels, BTC/USD would seal its highest levels since mid-June.BTC/USD 1-week candle chart (Bitstamp). Source: TradingViewEthereum, Cardano lead altcoins as ETH outlows riseOn altcoins, Ether (ETH) and Cardano (ADA) were the standout weekend performers as both rejected lower levels.Related: Ethereum price ‘cup and handle’ pattern hints at potential breakout versus BitcoinETH/USD 1-hour candle chart (Binance). Source: TradingViewETH/USD returned to $1,600 on the day, while ADA/USD likewise looked to challenge its $0.548 peak from during the week, this marking its best performance since June 12.ADA/USD 1-day candle chart (Binance). Source: TradingViewAnalyzing the current environment, traders noted the significance of Ethereum’s 2018 high of $1,530, a level which became long-term resistance and which returned as resistance again in June.$ETH after spending few weeks below 2017 ATH level #ethereum is trying to close above itstill has 2 days left for the weekly close thoughclose above and this pushes till 2300 imoclose below and this keeps chopping and maybe even make new lows..who knows pic.twitter.com/EGsvpyTB6T— White Walker (@cryptowhitewalk) July 23, 2022As price action strengthened, meanwhile, outflows of ETH from major exchanges intensified. On July 22, according to data from on-chain analytics firm CryptoQuant, those flows totaled 1.87 million coins.ETH outflows chart. Source: CryptoQuantThe views and opinions expressed here are solely those of the author and do not necessarily reflect the views of Cointelegraph.com. Every investment and trading move involves risk, you should conduct your own research when making a decision.

Čítaj viac

Bitcoin wobbles on Wall Street open as Ethereum hits $1.6K in 6-week high

Bitcoin (BTC) took a step back as Wall Street trading began on July 22 after recovering most of its previous losses.BTC/USD 1-hour candle chart (Bitstamp). Source: TradingViewBTC bulls fail to sustain assault on multi-week highData from Cointelegraph Markets Pro and TradingView confirmed BTC/USD encountering fresh resistance near $24,000.The pair had spent the past 24 hours slowly clawing back lost ground after news that Tesla had sold most of its BTC holdings.With the pre-announcement high of $24,280 still in force, bulls saw something of a setback as Wall Street opened on the day, with BTC/USD losing around $400.Analyzing current order book structure on major exchange Binance, on-chain monitoring resource Material Indicators warned that the overall bear market structure remained in control.As you can see a good portion of the bid liquidity we saw yesterday has moved up to get filled. and that helped push #BTC back above $23.5k (for now). That’s short term bullish in a bear market rally. pic.twitter.com/S4oiyj5Rlt— Material Indicators (@MI_Algos) July 22, 2022″Extreme lows and drops usually results in a revert to the mean move, or relief rally. Basically sellers are exhausted and buyers step trying to buy the bottom, causing a relief rally,” popular trader Crypto Tony added, reiterating that “the main trend remains bearish currently.”United States equities were similarly muted on the day, with the S&P 500 and Nasdaq Composite Index seeing modest declines on the open. The U.S. dollar index (DXY), in consolidation during the week, continued its downturn, targeting 106 for the first time since July 5.U.S. dollar index (DXY) 1-day candle chart. Source: TradingViewEthereum runs the show among altcoinsWhile also coming off its local highs, Ether (ETH) still gave analysts plenty to be excited about.Related: Ether price stalls at $1,630 after gaining 50% in under a weekETH/USD hit $1,640 on the day, marking its highest level since June 11 before returning to linger around the $1,600 level at the time of writing.$ETH recover starts to look as V-shaped.Resistances to look @:$1700 which i thing will be destroyed.Stronger $2.5ks, which also is 61.8 fib retracement, if fomo kicks in i’m finally expecting $3.2ks, 78.6% fib.— Wolf (@IamCryptoWolf) July 22, 2022

“Textbook bull flag breakout as Ethereum continues its hot streak,” trading software provider TrendSpider told Twitter followers about the ETH/USD daily chart as the highs entered.Ethereum was once again the leader in terms of daily gains among the top ten cryptocurrencies by market cap. Versus its lows from just ten days prior, ETH/USD was up 62%.ETH/USD 1-day candle chart (Binance). Source: TradingViewThe views and opinions expressed here are solely those of the author and do not necessarily reflect the views of Cointelegraph.com. Every investment and trading move involves risk, you should conduct your own research when making a decision.

Čítaj viac

Bitcoin traders eye levels to hold as ‘decision time’ looms for BTC price

Bitcoin (BTC) recovered above $23,000 into July 22 as attention increasingly focused on the upcoming weekly close.BTC/USD 1-hour candle chart (Bitstamp). Source: TradingViewBTC price needs to preserve at least $22,400Data from Cointelegraph Markets Pro and TradingView showed BTC/USD finding renewed strength after briefly dipping towards $22,000.The pair traded in a critical zone for bulls on the day, with the 50-day and 200-week moving averages (MAs) still yet to flip from resistance to support. Analysts were holding out for the weekly candle close to determine the strength of Bitcoin’s latest uptrend which at one point delivered weekly gains of up to 25%.“To perform a reclaim of the 200-week MA as support, $BTC needs to Weekly Close above $22800,” popular trader and analyst Rekt Capital wrote in part of a recent Twitter update.For fellow trader Jibon, meanwhile, $22,400 was more important as a minimum level to close out the week.“Next Week Decision Time, $BTC will go 30-40K or 12-15K. I Want Weekly Close above $22,401,” he told Twitter followers on the day.While sticking by his forecast of the relief rally going as high as $40,000 before another macro low sets in, Jibon acknowledged that Bitcoin was “still in a bear market” which would last into 2023.“So All bullish trends are temporary moves,” he explained while debating the forecast.In its latest market update released on the day, trading firm QCP Capital voiced reservations about the near-term potential for either Bitcoin or altcoins to rise much higher.“In terms of spot direction, we are not sure if the upside momentum continues in a big way,” researchers wrote. “The speed of this move higher felt positioning-driven (market was caught short) and the market is starting to show some signs of exhaustion.”QCP pointed to the upcoming meeting of the United States Federal Reserve’s Federal Open Markets Committee (FOMC) on July 27 as a major volatility event to come.Markets, it added, were now pricing in a 75-basis-point hike in key interest rates this month, rather than the higher 100-basis-point option feared on the back of the inflation numbers.“Since the high CPI print, the market has been decisively pricing out the probability of a 100bps hike in the July FOMC,” the update read. “Currently, a 20% chance of 100bps is still being priced in but our view is that 75bps is the most the Fed will do. So expect another boost as 100 bps gets completely priced out.”Bets increase on dollar breakdownAs the U.S. dollar index (DXY) consolidated below twenty-year highs, meanwhile, analysts were waiting for a long-term parabolic uptrend to show signs of cracking.Related: Bulls or bears? Both have a fair chance in Friday’s Bitcoin options expiryU.S. dollar index (DXY) vs. BTC/USD 1-day candle chart. Source: TradingViewUSD, as Cointelegraph continues to report, remains distinctly inversely correlated with cryptoasset performance.What happens when the #DXY parabola and #TNX neckline break? One guess only… #Bitcoin pic.twitter.com/fgyCw8r6yB— Proof of Steve ⚡ (@decodejar) July 22, 2022“It will be a good day when this finally breaks,” popular commentator Rickus summarized about the impact of a weaker dollar on risk assets.The views and opinions expressed here are solely those of the author and do not necessarily reflect the views of Cointelegraph.com. Every investment and trading move involves risk, you should conduct your own research when making a decision.

Čítaj viac

Získaj BONUS 8 € v Bitcoinoch

nakup bitcoin z karty

Registrácia Binance

Burza Binance

Aktuálne kurzy