Autor Cointelegraph By William Suberg

Bitcoin miners now hold a record 1.856M BTC — new data

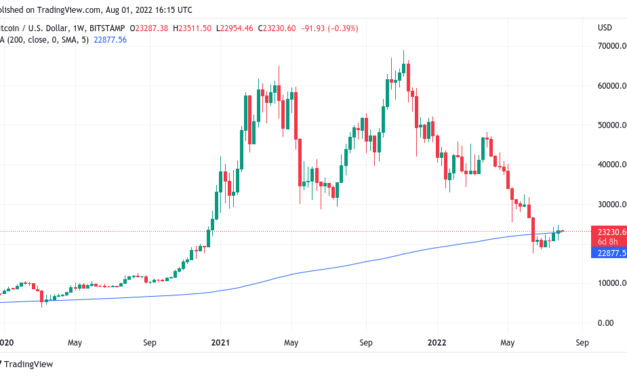
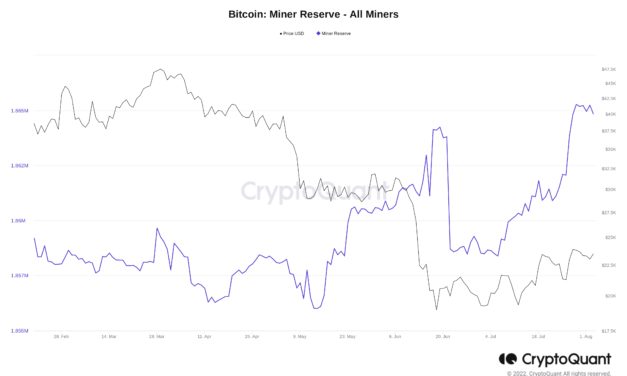
Bitcoin (BTC) miners now own more BTC than at any time in history as the impact of the past months’ turbulence wears off.According to data from on-chain analytics firm CryptoQuant, miners’ BTC holdings increased dramatically in July.Miners keep stacking satsIn the latest sign of miners recovering from recent price weakness, the amount of BTC in their wallets has hit a fresh all-time high.As noted by CryptoQuant contributor and analyst Jan Wuestenfeld, their combined balance totaled 1,865,272 BTC as of July 29. The start of August saw a slight decline, with the total as of Aug. 3 being 1,864,842 BTC.Between July 6, when reserves hit a local low, and the July 29 record, miners’ wallet balance increased by 0.37%, or 6,885 BTC.Bitcoin miner reserve chart. Source: CryptoQuant”Bitcoin miner reserves have fully recovered the outflows/sell-off that happened after the capitulation event in June,” Wuestenfeld commented in one of CryptoQuant’s “Quicktake” updates on the day.  “Bitcoin held in miner wallets is at a new all-time high.”Wuestenfeld was referring to miners’ struggles as BTC/USD fell to its lowest since late 2020, subsequently recovering around 38% from a $17,600 floor.Their problems were clearly visible in network fundamentals, with both hash rate and difficulty declining to reflect decreasing miner participation.As Cointelegraph reported, difficulty will see its first increase in months this week, while Wuestenfeld notes that hash rate has yet to stage a noticeable comeback.”Meanwhile, the hashrate is still in a downward trend, where unprofitable miners appear to be shutting down their equipment after bitcoin’s price declined in mid-June,” he added.”However, this is as it should be and healthy in a free market. So nothing to really worry about in my mind.”Bitcoin network fundamentals overview (screenshot). Source: BTC.comExchanges sales back under 1,000 BTC per dayOther metrics are also pointing to light at the end of the tunnel for miners. Last week, numbers suggested that miners’ “capitulation” phase could be over as soon as August should price action continue to stabilize higher.Related: Will the Bitcoin mining industry collapse? Analysts explain why crisis is really opportunityLast week, numbers suggested that miners’ “capitulation” phase could be over as soon as August should price action continue to stabilize higher.According to CryptoQuant, since the June events, miners have sent a maximum of 927 BTC to exchanges in a day.Bitcoin miner exchange inflows chart. Source: CryptoQuantOn Aug. 2, the latest full day for which data is available, the inflows from miners to exchange wallets totaled just 359 BTC.The views and opinions expressed here are solely those of the author and do not necessarily reflect the views of Cointelegraph.com. Every investment and trading move involves risk, you should conduct your own research when making a decision.

Čítaj viac

Bitcoin price clips $23K on Pelosi Taiwan visit as trading range persists

Bitcoin (BTC) saw volatility after the Aug. 2 Wall Street open amid ongoing market reactions to tensions between the United States and China.BTC price U-turns as Pelosi lands in TaipeiData from Cointelegraph Markets Pro and TradingView showed BTC/USD spiking above $23,000 on the day as news came in that Nancy Pelosi, speaker of the U.S. House of Representatives, had landed in Taipei, Taiwan after warnings of retaliation from Beijing.The visit, which had raised concerns of a major incident occurring, appeared to go without a hitch — something an analyst at major banking giant JPMorgan had previously said would spark a market rally.she made it, pump the markets pic.twitter.com/Os09HTGIoc— Fomocap (@fomocapdao) August 2, 2022Both the S&P 500 and Nasdaq Composite Index were slightly higher at the time of writing, reversing initial losses. Previously, Asian markets had fared worse on the uncertainty, with both the Shanghai Composite Index and Hong Kong’s Hang Seng losing around 2.3% on the day.As traders eyed an end to the recent few days’ calm on BTC, it remained to be seen whether important trendlines nearby would continue to hold after seeing retests overnight.”The next few weeks / months in the Cryptocurrecny space are going to be volatile due to macro events playing a bigger part than ever,” popular trader Crypto Tony forecast.Crypto Tony added that he would add to his allocation should BTC/USD quit the range between $22,000 and $24,000 for lower levels.That range was shared by fellow trader Credible Crypto, who nonetheless acknowledged the potential for a trip to $25,000 as well.No change to this idea- still looking for a move down to GREEN or at least the swing low denoted by the RED X here before continuation to the upside to 25k+ $BTC. https://t.co/P3WKkLRmls pic.twitter.com/u494VRotcd— CrediBULL Crypto (@CredibleCrypto) August 1, 2022

In a potential headwind for Bitcoin and risk assets, the U.S. dollar index (DXY) capitalized on daily strength as events unfolded to aim for the 106 mark once more.The Bloomberg dollar index likewise saw gains as Pelosi became the first U.S. speaker to visit Taiwan in 25 years.U.S. dollar index (DXY) 1-hour candle chart. Source: TradingViewFib levels cap gains and losses for Bitcoin in Q3Discussing the broader picture, meanwhile, trading firm QCP Capital confirmed that it did not expect Bitcoin to retest the 2022 lows of $17,600.Related: Best monthly gains since October 2021 — 5 things to know in Bitcoin this week”We expect BTC price to drift higher from here for most of Q3, with upside rallies capped, but also dips on choppy price action,” analysts wrote in its market summary released Aug. 1.Beyond that timeframe, however, QCP did not rule out a move to “break the lows” to officially end the current bear market. In “extreme” circumstances, it said, this could involve prices as low as $10,000. An interim pivot point, it added, could be a Fibonacci retracement level at $28,700.The views and opinions expressed here are solely those of the author and do not necessarily reflect the views of Cointelegraph.com. Every investment and trading move involves risk, you should conduct your own research when making a decision.

Čítaj viac

Bitcoin traders pinpoint key levels to watch as BTC price tests key trendlines

Bitcoin (BTC) is pressuring newly-won support levels this week as geopolitical uncertainty raises the stakes for risk assets.After an impressive monthly close, momentum appears to be waning for Bitcoin’s latest gains, data from Cointelegraph Markets Pro and TradingView shows, and stock markets are not helping the bulls.Volatility was cool as August began, but angst over a potential showdown between the United States and China over House Speaker Nancy Pelosi’s visit to Taiwan is already showing in Asian trading on Aug. 2.Amid talk of a “bear market rally” being all that can describe the current setup, Cointelegraph takes a look at the crucial support and resistance levels currently facing the market on short timeframes.Traders unconvinced over fate of 200-week moving averageAnalyzing order book data on Binance, the largest exchange globally by volume, pockets of buy and sell interest stand out immediately.At present, BTC/USD is eating through a band of bids just below $23,000. Should all that liquidity be taken, however, there is little more to support price action until closer to $21,000.The strength of buy and sell “walls” on the Binance order book can be deceptive, as large-volume players can quickly move bids or asks from one level to the next.The latest data was uploaded to social media by on-chain analytics resource Material Indicators on Aug. 1. It additionally highlighted the importance of Bitcoin’s 200-week moving average (MA) at just above $22,800.BTC/USD 1-week candle chart (Bitstamp) with 200 MA. Source: TradingViewCertain whales, Material Indicators noted, were attempting to keep the 200-week MA as support but seeing little consensus from other trader groups, something which resulted in a subsequent dip below the trendline.”Doesn’t look they are getting much help from other classes. Not sure how long they can keep this up,” part of accompanying comments read.BTC/USD buy and sell levels (Binance). Source: Material Indicators$26,000 then “new lows”?Despite the Taiwan situation unnerving markets on the day, a short-term move higher for Bitcoin is not off the table, even for some of its most conservative analysts.Related: Best monthly gains since October 2021 — 5 things to know in Bitcoin this weekFor popular Twitter account Il Capo of Crypto, BTC/USD even had the potential to hit $25,000 before returning lower than current levels.Responding, fellow trader Jibon suggested that it could be $26,000 before a bearish pivot enters.$28,056 Sir— Trader_J (@Trader_Jibon) August 2, 2022While they kept quiet on a potential downside target, Venturefounder, a contributor to on-chain analytics platform CryptoQuant, called $22,000 a “good price” to set up a BTC long.Altcoins, including Ether(ETH), looked less appetizing.”I still think most altcoins are too expensive for this part of the cycle, or should I say Bitcoin is too cheap?” he queried on Aug. 1. “$22k is still good price to long BTC for me. Can’t say the same for altcoins, not even $ETH.”ETH/USD traded below $1,600 at the time of writing, down around 4% on the day but still 12% higher than the same time a week ago.”Unless you think ALTs are going to break to their ATH against BTC soon, makes no sense to long,” Venturefounder added.A look at the ETH/BTC chart meanwhile shows the importance of 0.075 resistance for ETH bulls, this failing to crack during the July crypto rally.ETH/BTC 1-day candle chart (Binance). Source: TradingViewThe views and opinions expressed here are solely those of the author and do not necessarily reflect the views of Cointelegraph.com. Every investment and trading move involves risk, you should conduct your own research when making a decision.

Čítaj viac

Bitcoin bulls defend $23K amid warning bear market rally 'alive and well'

Bitcoin (BTC) tested $23,000 as support on the Aug. 1 Wall Street open with key moving averages in focus. BTC/USD 1-hour candle chart (Bitstamp). Source: TradingView200-week moving average gets big attentionData from Cointelegraph Markets Pro and TradingView followed BTC/USD as bulls and bears battled for control amid a tight trading range.Bitcoin had inspired with its highest weekly close since mid-June the day prior, with its monthly candle also producing the biggest gains since before last year’s $69,000 all-time highs.Among analysts and traders, however, it was the market’s ability to remain higher for several more candles that was important.Despite reclaiming important trendlines such as the 200-week moving average (MA) and realized price, Bitcoin would not be out of the woods until it began producing whole weekly candles without retests of those levels.”The Bear Market Rally is still alive and well,” on-chain analytics resource Material Indicators explained on the day.”To call it anything else requires confirmations of valid breakouts above the key MAs. The 200 Week and 50 Month are the first ones to be considered for BTC, but only if we have full candles above the line. A wick below invalidates.”BTC/USD 1-month candle chart (Bitstamp) with 50-month MA. Source: TradingViewAs such, $22,880 and $21,965 were essential lines to hold for bulls and increasingly close to spot price.Fellow trader and analyst Rekt Capital nonetheless forecast that Bitcoin would naturally attempt to retest the 200-week MA as support in the short term.The new #BTC Weekly Close above the 200-week MA means that price will try to retest this MA as new support this weekBTC already held the MA as support last week, as evidenced by the downside wickNow it will try to hold it for a second consecutive week$BTC #Crypto #Bitcoin pic.twitter.com/350VYgi825— Rekt Capital (@rektcapital) August 1, 2022Commenting on price strength, however, he noted that the 200-week MA reclaim was the first such occurrence after an “extended downtrend” since the March 2020 COVID-19 crash.”Bitcoin may be struggling to break above the $24,000 level, but its weekly candle finally closed above the 200-week moving average and it could improve the technical sentiment significantly,” Zain Haider, co-founder of Blockchain Q&A platform Answerly, summarized in the additional commentary.On-chain activity “lackluster at best”With United States stock markets flat on the day, Bitcoin and altcoins had little by way of macro pressure influencing price action.Related: Best monthly gains since October 2021 — 5 things to know in Bitcoin this weekThe situation nonetheless remained somewhat uncertain, researchers at on-chain analytics firm Glassnode warned, thanks to markets still reflecting the bearish mood after months of downtrend.”Both Bitcoin and Ethereum have seen a rebound in prices this week, coming off the back of extremely oversold conditions, and spurred on by risk-on sentiment following the July FOMC meeting,” they concluded in the latest edition of Glassnode’s weekly newsletter, The Week On-Chain.”However, under the surface, on-chain transactional demand remains lacklustre at best, and this rally has not yet seen a convincing follow through in observable demand activity.”Glassnode added that on-chain data still represented “only part of the picture,” and that attention should likewise now be on whether the fledgling signs of change could endure.The views and opinions expressed here are solely those of the author and do not necessarily reflect the views of Cointelegraph.com. Every investment and trading move involves risk, you should conduct your own research when making a decision.

Čítaj viac

Best monthly gains since October 2021 — 5 things to know in Bitcoin this week

Bitcoin (BTC) starts a new week and a new month on a cautiously positive footing after protecting crucial levels.After an intense July in which macro factors provided significant volatility, BTC price action managed to provide both a weekly and monthly candle favoring the bulls.The road to some form of recovery continues, and at some points in recent weeks, it seemed like Bitcoin would suffer even harder on the back of June’s 40% losses.Now, however, there is already a sense of optimism among analysts, but one thing remains clear — this “bear market rally” does not mean the end of the tunnel yet.As Summer 2022 enters its final month, Cointelegraph takes a look at the potential market triggers at play for Bitcoin as it lingers near its highest levels since mid-June.Spot price snatches back bear market trendlinesIn terms of Bitcoin’s July performance, things could have been a lot worse.After June saw losses of nearly 40%, BTC/USD managed to close out last month with respectable 16.8% gains, according to data from analytics resource Coinglass.BTC/USD monthly returns chart (screenshot). Source: CoinglassWhile those gains at one point passed 20%, July’s tally nonetheless remains Bitcoin’s best since October 2021 — before the latest all-time highs of $69,000 hit.With solid foundations in place, the question among analysts is now if and how long the party can continue.Fun day!At the D, W, M close, BTC closed D red. W & M closed green and Trend Precognition fired a new Long on the M. It’s tentative until the candle closes, but the fact that it closed above the 50 Month MA makes it interesting to. Time to chill. Back to charts in the morning. pic.twitter.com/ImWjNcXx91— Material Indicators (@MI_Algos) August 1, 2022“First monthly close in green since March,” popular trader and analyst Josh Rager responded. “After monthly closed above 2017 all-time high from last cycle, price is slowly climbing up. Looks good so far and even if this is a ‘bear market,’ I’m happy to buy dips right now.”Others were more cautious, among them fellow trader and analyst Crypto Tony, who noted that the recent local highs just above $24,000 were still acting as unchallenged resistance on the day.“I am looking for a breakdown of this Bitcoin pattern and remain short while we are below the $24,000 supply zone we rejected off,” he confirmed to Twitter followers.Nonetheless, the weekly and monthly close sealed some important levels as support for Bitcoin. Specifically, the 200-week moving average flipped from resistance on the weekly chart, and BTC/USD retained its realized price, data from Cointelegraph Markets Pro and TradingView shows.In its latest weekly newsletter released last week, Blockchain infrastructure and cryptocurrency mining firm Blockware also noted that a reclaim of the 180-period exponential hull moving average (EHMA) at just under $22,000 on the monthly chart would be “quite bullish.”“Monthly also appears to be reclaiming its 180-week EHMA, a level we’ve talked about over the last few months as a macro accumulation area for BTC. This closes Sunday night EST as well,” lead insights analyst William Clemente wrote. “If it does reclaim, would be quite bullish as failed breakdowns/breakouts are a strong signal.”BTC/USD 1-week candle chart (Bitstamp) with 200-week moving average. Source: TradingViewMacro triggers cool for AugustThe macro picture to begin August is one of relief mixed with a sense of distrust over how the rest of the year could play out. On short timeframes, United States equities survived last month’s Federal Reserve-induced volatility to end July on a high. As Cointelegraph reported, calls for an extended rally in stocks are increasing, something which could only be good news for highly-correlated crypto markets.Analyzing the state of commodities, meanwhile, popular Twitter account Game of Trades predicted that oil would soon lose ground, and that this would have a conspicuous impact on U.S. inflation.Currently at more than forty-year highs, the Consumer Price Index (CPI) is responsible for the Fed rate hikes pressuring risk assets across the board. An about turn in inflation and thus Fed policy could thus swiftly turn the tables.“Big sellers stepped in for oil on Friday,” one post from the weekend read. “Looks like oil is poised for a breakdown, taking the CPI with it.”Brent crude price plunges as West eases efforts to restrict Russian #oil trading w/#inflation and energy risks mount. Plan to shut Moscow out of maritime insurance market delayed. https://t.co/fwQPGft0Uc pic.twitter.com/44Lne5P7qT— Holger Zschaepitz (@Schuldensuehner) August 1, 2022

The global picture when it comes to commodities is not that straightforward, however, with macro analyst Alex Krueger conversely warning that Europe’s energy crisis had not yet played out in market pricing.For Bitcoin, then, the current recovery is more a “bear market rally” than a true return to strength.“Yes this is a bear market rally … for now,” Krueger wrote. “Thing is if inflation comes down fast enough, which is feasible, and Europe’s energy crisis is not exacerbated by a harsh winter, also feasible, this could end up being the beginning of the bull market. Nobody knows as of now.”Krueger added that the status quo should remain until “at least until the end of August” when fresh Fed events impact the market.In order of importance, he listed the September key rate decision, September CPI, the Fed’s Jackson Hole summit on August 25 and the August 10 CPI print for July.Most upcoming important events, in order:#1 Sep22: FOMC#2 Sep13: CPI#3 Aug25: Jackson Hole#4 Aug10: CPIExpect markets to de-risk (sell-off) the days before each event if market running hot into them.Then of course we have the infamous ETH merge around Sep19.— Alex Krüger (@krugermacro) July 30, 2022

Turning to U.S. dollar strength, the U.S. dollar index (DXY) remained at lows not seen for nearly a month on the day, currently below 106.For Game of Trades, the index was more significant than the numbers. After its parabolic uptrend, a clear change of direction was now visible on the DXY daily chart.“DXY has broken its parabola. There is only one way a broken parabola ends,” it commented.U.S. dollar index (DXY) 1-day candle chart. Source: TradingViewRSI raises questions over price bottomTurning to on-chain signals, a rebound in one of Bitcoin’s core fundamentals has not been enough to convince analyst Venturefounder that the BTC price bottom is in.Zooming out to a multi-year view and comparing BTC/USD across market cycles, the popular content creator argued that Bitcoin’s relative strength index (DXY) is still suppressed after its peak in April 2021. RSI measures how overbought or oversold BTC/USD is at a certain price, and since May has seen its lowest readings on record.Despite suggesting that Bitcoin is trading wildly lower than its fair value, RSI has yet to regain the “bullish momentum” that characterized the run past $20,000 and beyond at the end of 2020.In April 2021, Bitcoin hit $58,000 before halving in price by the end of July.“The only way to see the July 2022 low as the cycle bottom is if you were to see the April 2021 high as the cycle top for this cycle,” Venturefounder stated. “Bitcoin and Altcoins RSI and bullish momentum peaked in April 2021 and never recovered for the rest of this cycle. Do you think we bottomed?”Another conspicuous oversold period in RSI came immediately after the March 2020 COVID-19 crash, that event significantly impacting price strength going into the latest block subsidy halving.BTC/USD, of course, never looked back, going on to reclaim its all-time high of the time around six months later.BTC/USD 1-mon candle chart (Bitstamp) with RSI. Source: TradingViewPurpose ETF finally adds to holdingsThings could be looking up for institutional Bitcoin involvement as subtle signs of recovery play out in statistics.The latest such signal comes from the world’s first Bitcoin spot price exchange-traded fund (ETF), the Purpose Bitcoin ETF.After its holdings suddenly declined by 50% in June, the product is finally adding BTC again, suggesting that demand is no longer falling.Purpose added 2,600 BTC, something commentator Jan Wuestenfeld additionally noted ended several weeks of dormancy.“Assets under management still far away from the all-time high, however,” he added.Purpose Bitcoin ETF holdings chart. Source: GlassnodeThe recovery trend is far from omnipresent, however. A look at the Grayscale Bitcoin Trust (GBTC) continues the troublesome trend of lack of demand.The fund’s premium to spot price, long in fact a discount, is now circling record lows of nearly 35%, data from Coinglass confirms.Grayscale continues legal action against U.S. regulators over their refusal to allow a spot Bitcoin ETF to launch on the domestic market. GBTC would convert to such an ETF were conditions to allow.GBTC premium vs. asset holdings vs. BTC/USD chart. Source: CoinglassNew month, new fearIt was a nice ride, but crypto market sentiment is already back in the “fear” zone.Related: Top 5 cryptocurrencies to watch this week: BTC, BNB, UNI, FIL, THETAThe latest readings from the Crypto Fear & Greed Index confirm that “neutral” sentiment could barely last a day, and that despite high prices prevailing, cold feet are hard to shake.The Index measures 33/100 as of Aug. 1, still high compared to recent months but already considerably below the highs of 42/100 seen just days ago.Crypto Fear & Greed Index (screenshot). Source: Alternative.meFor research firm Santiment, however, there remains a cause for optimism. The firm’s proprietary metric governing transaction volume relative to overall network value for Bitcoin ended July in “neutral” territory of its own.The network value to transaction (NVT) token circulation model, after printing bullish divergences in May and June, thus came through at the latest monthly close.“With a neutral signal now as prices have risen and token circulation has declined slightly, August can move either direction,” Santiment summarized in a Twitter update about the latest numbers.Bitcoin NVT model. Source: Santiment/ TwitterThe views and opinions expressed here are solely those of the author and do not necessarily reflect the views of Cointelegraph.com. Every investment and trading move involves risk, you should conduct your own research when making a decision.

Čítaj viac

Získaj BONUS 8 € v Bitcoinoch

nakup bitcoin z karty

Registrácia Binance

Burza Binance

Aktuálne kurzy