Autor Cointelegraph By William Suberg

Bitcoin realized price bands form key resistance as bulls lose $24K

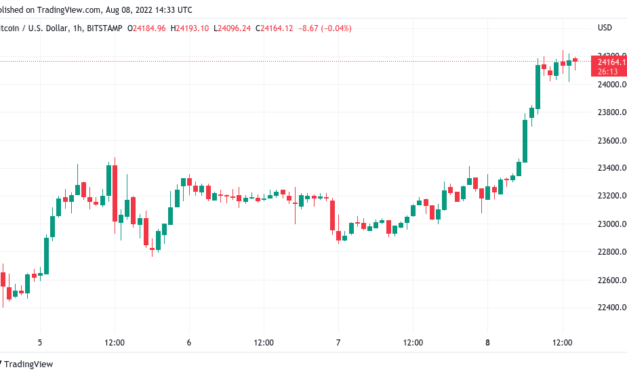
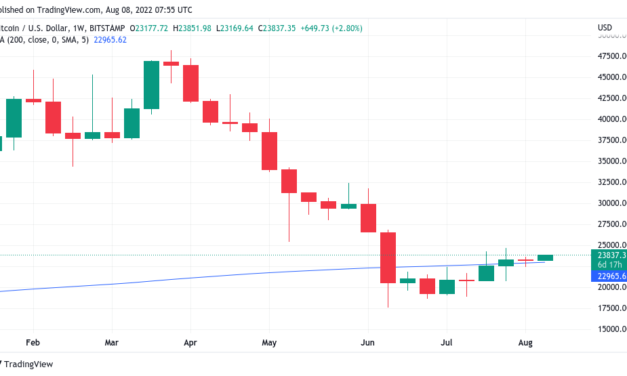
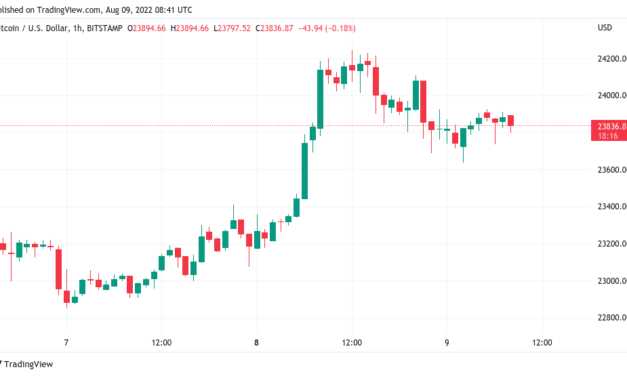
Bitcoin (BTC) consolidated lower on Aug. 9 after familiar resistance preserved a multi-month trading range.BTC/USD 1-hour candle chart (Bitstamp). Source: TradingViewBitcoin navigates whale price ladderData from Cointelegraph Markets Pro and TradingView showed BTC/USD falling under the $24,000 mark overnight after rejecting near $24,200. The pair had seen swift gains to start the week but momentum faded as the top of the trading range in place since mid-June came closer.As such, bulls failed to reclaim new ground or even match the highs seen at the end of July, and the status quo thus continued. At the time of writing, BTC/USD was consolidating near $23,800.For on-chain analytics resource Whalemap, it was realized price that was now forming major levels to overcome.In a Twitter update on Aug. 8, Whalemap, which monitors buys and sells of large-volume players to establish likely solid support and resistance zones, highlighted various prices at which the BTC supply on aggregate last moved.An accompanying chart broke down realized price by wallet size and showed at what price BTC belonging to particular whales last left its wallet.”Realised price bands are the main thing providing resistance for Bitcoin currently,” the Whalemap team wrote in accompanying comments.”Confidently getting above $24,825 and consolidating should be key for a continuation higher.”Bitcoin realized price bands annotated chart. Source: Whalemap/ TwitterAs Cointelegraph reported, other support and resistance levels in play this week include the 100-day and 200-week moving averages (MAs).For popular trader Credible Crypto, a deeper retracement could happen, and may involve as low as $23,360 without disrupting even the low-timeframe trend.Front ran local demand and followed the green path with a break of our red region. That being said, not totally convinced that this ltf corrective structure is complete. Want to see more PA develop. Also will be traveling so won’t be as active for the next few days! $BTC https://t.co/F41n8JAWqO pic.twitter.com/rhZRPpMRsR— CrediBULL Crypto (@CredibleCrypto) August 8, 2022″Looking for that flip into support for one more macro push up to send it,” fellow trader Crypto Tony added in part of a more optimistic take on the range high.Markets unmoved by Wednesday inflation figuresPotential volatility meanwhile remained on the radar, with upcoming United States inflation data, due Aug. 10 high on traders’ list of market triggers to watch.Related: Has US inflation peaked? 5 things to know in Bitcoin this weekU.S. stocks had shown little sign of concern on the first trading day of the week, however, with the S&P 500 ending flat and Nasdaq Composite Index seeing slight gains of 0.4%.I have pointed out in the past that China CSI 300 is possibly frontrunning #crypto and the American stock markets. Be aware that the current crypto rally could retrace a lot since the S&P 500 is now close to resistance ☝️ pic.twitter.com/uv5tUESPNK— BTCfuel (@BTCfuel) August 8, 2022

In fresh analysis on global macro, popular Twitter account BTCfuel nonetheless voiced caution. Losses in China, it warned, could yet precede a U.S. copycat move in what would place fresh pressure on highly-correlated crypto markets.In terms of inflation, opinions were also mixed, Cointelegraph noting that Tesla CEO, Elon Musk, already felt that price increases were slowing alongside declining commodities.The views and opinions expressed here are solely those of the author and do not necessarily reflect the views of Cointelegraph.com. Every investment and trading move involves risk, you should conduct your own research when making a decision.

Čítaj viac

Bitcoin price targets 8-week highs as Ethereum reaches $1.8K

Bitcoin (BTC) looked to target new August highs at the Aug. 8 Wall Street open as upcoming United States inflation data fueled sentiment.BTC/USD 1-hour candle chart (Bitstamp). Source: TradingView$25,000 next major BTC resistanceData from Cointelegraph Markets Pro and TradingView followed BTC/USD as it hit $24,246 on Bitstamp, its best since July 30.The pair was within striking distance of its highest since mid-June at the time of writing, while traders and analysts scanned the charts for signs of resistance.For on-chain monitoring resource Material Indicators, this came in the form of sellers at $25,000 and Bitcoin’s 100-day moving average (MA).“Bear Market Rally is pumping ahead of this week’s CPI report,” it wrote as part of its latest Twitter update. An accompanying chart showed long signals still characterizing the daily chart, with the 100-day MA sitting at around $25,650.Order book data from the largest global exchange Binance reinforced expectations of friction in that area, as sell liquidity was mounting around the $25,000 mark.BTC/USD 1-day candle chart (Bitstamp) with 100-day MA. Source: TradingViewRunning the show on risk assets was the Aug. 10 Consumer Price Index (CPI) print, with markets waiting to see if U.S. inflation had set a peak.While this would notionally allow crypto some breathing space, commentators pointed out that the risk of a major stock market correction remained, with crypto still heavily correlated.Moves by Larry Fink, CEO of the world’s largest asset manager BlackRock, exacerbated concerns that risk assets were simply in the midst of an extended bear market relief rally.After last week’s partnership with U.S. exchange Coinbase, Fink sold a tranche of more than 44,000 BlackRock shares this month, his first major sale since the months before the March 2020 COVID-19 crash. Concerns thus focused on whether Fink now knew something that the majority did not. LARRY FINK CEO OF BLACKROCK WHICH IS THE WORLDS LARGEST ASSET MANAGER WITH OVER 10 TRILLION IN ASSETS SOLD ANOTHER 8% OF HIS OWN STOCK LAST WEEK. THIS IS HIS BIGGEST STOCK SALE AFTER COVID , HIS LAST BIGGEST STOCK SALE WAS RIGHT BEFORE THE COVID CRASH. $BLK pic.twitter.com/5aNwTjLzPM— Gurgavin (@gurgavin) August 8, 2022“I think the one thing that can push prices back down is the stock market having another major pullback,” trader and pundit Max Rager continued on the day. “Outside, hard to see something putting as much selling pressure as we had with both the LUNA/3AC events.”Rager argued that since the majority were expecting a trip to June’s lows or worse, this would no longer be what causes the market “max pain.”Ethereum Merge could be “buy the rumor, sell the news”Out of the top ten cryptocurrencies by market cap, it was not Bitcoin putting in the best daily or even weekly performance.Related: Has US inflation peaked? 5 things to know in Bitcoin this weekMajor tokens were headlined by Ether (ETH), Solana (SOL) and Polkadot (DOT), which delivered 24-hour returns of between 5% and 8.5%.ETH/USD, amid ongoing speculation over the Merge and its consequences, reached $1,817 on Binance, marking its highest since June 9.For on-chain analytics firm Glassnode, the good times could continue until the event itself, expected to be in September.“There is little directional bias evident in Bitcoin derivatives markets. On the Ethereum side, however, traders are clearly holding a long bias, expressed heavily in options contracts centred in September,” it wrote about traders’ plans in the latest edition of its newsletter, “The Week On-Chain,” released on Aug. 8.“Both futures and options market are in backwardation after September, suggesting traders are expecting the Merge to be a ‘buy the rumor, sell the news’ style event, and have positioned accordingly.”ETH/USD 1-day candle chart (Binance). Source: TradingViewThe views and opinions expressed here are solely those of the author and do not necessarily reflect the views of Cointelegraph.com. Every investment and trading move involves risk, you should conduct your own research when making a decision.

Čítaj viac

Has US inflation peaked? 5 things to know in Bitcoin this week

Bitcoin (BTC) goes into another key macro week in the United States with a welcome break to the upside.After avoiding a now-familiar breakdown around the weekly close, BTC/USD is surging higher at the time of writing on Aug. 8 to once more tackle resistance in place for two months.Can the bulls win out? Momentum appears to be strong across crypto, but a host of potential stumbling blocks lie in the way.With fresh U.S. inflation data due, the macro picture could yet upset the status quo, while sellers likewise show no sign of budging to allow reclaim of levels above $25,000.Amid continued claims that Bitcoin is enjoying nothing more than a “bear market rally,” Cointelegraph takes a look at the state of play on the market as the new week begins.These five factors will be worth bearing in mind when considering where Bitcoin price action could be going over the coming days. BTC seals 2nd week above key bear market supportUnlike recent weeks, Bitcoin allowed traders to breathe a sigh of relief at the Aug. 7 weekly close. Instead of declining at or immediately after the candle close, BTC/USD instead began gaining, these gains including an impressive hourly candle, which saw almost $500 added.The close in itself was impressive, constituting Bitcoin’s highest weekly candle close since June — a firm break from the previous weekly downtrend — data from Cointelegraph Markets Pro and TradingView shows.BTC/USD 1-week candle chart (Bitstamp) with 200-week MA. Source: TradingViewIn addition, BTC’s price defended its key 200-week moving average (MA) two closes in a row, cementing the likelihood of that trendline now forming support. This comes despite multiple retests during the week, with the 200-week MA sitting at around $22,900.The market was spared the craziness and #Bitcoin D and W candles closed as the Trend Precognition algos predicted. Bear Market Rally continues. https://t.co/anTpoYD9kK— Material Indicators (@MI_Algos) August 8, 2022Prior to the close, some were already predicting volatility.im surprised the market hasn’t moved yetMaybe will this week#Bitcoin— Kevin Svenson (@KevinSvenson_) August 7, 2022

For popular trading account TraderSZ on Twitter, this would take the form of a “big violent move,” one which ended up being to the upside.“I know it’s hard to convince you that $BTC has touched the Bottom. But you can’t ignore it. Never Break This Line in History,” fellow account Jibon added alongside a weekly chart featuring another MA trendline.Looking at possible targets, anywhere between $25,000 and $28,000, commentators believe, with Cointelegraph already reporting on one trader’s expectations of a $30,000 retest.Seems like a band test is coming the following weeks.25.5k-28k#Bitcoin pic.twitter.com/G1GghvhcSo— Trend Rider (@TrendRidersTR) August 8, 2022

Analyzing separate data governing two exponential moving averages (EMAs), meanwhile, trading resource Stockmoney Lizards agreed with Jibon about a macro bottom already being complete for Bitcoin.“Cycles repeat. Shortly after EMA bands crossing, cycle low is in. From there, the uptrend is close,” it summarized on Aug. 7:“Mid-term target 38k – 40k which be in this descending resistance level area. After this, we’ll see a breakout and another bull run.”$40,000, while lofty by today’s standards, is also not without its adherents — even as part of an extended bear market relief rally.U.S. inflation picture compicated by falling commoditiesThe main macro event in what is otherwise a sleepy summer month is due in the coming days. U.S. inflation will become top of the list of discussion topics in crypto and beyond on Aug. 10 as the Consumer Price Index (CPI) figures for July hit the radar.The schedule is already ingrained in the minds of risk asset traders everywhere — while not indicative of a specific trend in and of themselves, CPI releases are reliably accompanied by market volatility before, during and after the fact.The question on everyone’s lips this time around, however, is whether inflation has peaked. Most anticipated data this week is CPI on Wednesday, estimates are 8.7, IF it comes in above we are back to crashy mode.— Tom (@TradingThomas3) August 6, 2022

The question is complex: Fuel prices began decreasing in July, while CPI components such as rent prices conversely hit all-time highs.The “sharp decline” in gasoline prices will create a “strong drag” on headline #CPI next week.(via Morgan Stanley / Zentner) pic.twitter.com/fuJ0u7rwtO— Carl Quintanilla (@carlquintanilla) August 5, 2022

The decline in commodities is a key cause for optimism for Tesla CEO Elon Musk, as Cointelegraph reported, who used the trend as a basis for suggesting that inflation would be going down from here.“This could change, obviously, but the trend is down, which suggests that we are past peak inflation,” he said during Tesla’s Annual Meeting of Stockholders last week.#Powell knows that Uncle Sam can’t afford rising rates or a perpetually strong #USD.So why the public ruse to “fight” 9% #Inflation” with 2.5% FFR?Simple: The Fed sees a #Recession coming and needs to raise rates today so they’ll have something—anything—to cut tomorrow.— Egon von Greyerz (@GoldSwitzerland) August 7, 2022

After months of key interest rate increases, meanwhile, the Federal Reserve will not make a decision on further monetary policy moves until September. More broadly, the central bank is in a bind, commentators argue, being unable to hike rates much further without unintended side effects.Old hands hodl onAccording to on-chain monitoring resources, hodlers are unmoved by the latest upticks in BTC price action after months of declines.While this is nothing unusual, it remains interesting to see how long-term holders’ resolve will be tested should further gains enter.In automated updates this week, on-chain analytics firm Glassnode noted that the amount of the BTC supply last active in the past 24 hours is declining on average, potentially reflecting a lack of knee-jerk reactions to price moves. #Bitcoin $BTC Amount of Supply Last Active 24h (1d MA) just reached a 1-month low of 147,020.447 BTCPrevious 1-month low of 147,387.149 BTC was observed on 18 July 2022View metric:https://t.co/I2GrIJjJGU pic.twitter.com/NzpGlCKDxa— glassnode alerts (@glassnodealerts) August 8, 2022

Likewise, the seven-day MA of median on-chain transaction volume reached one-month lows of its own on the day, beating its previous lows from Aug. 1.On higher timeframes, the trend is also visibly skewed toward pragmatism. The portion of the BTC supply which has stayed dormant in its wallet for three years or more continues to increase, reaching new all-time highs of 38.426% on the day.Bitcoin % supply last active 3+ years ago chart. Source: Glassnode/ TwitterThe changes are more easily viewed on the HODL Waves metric, which provides an overview of what proportion of the BTC supply has remained dormant for specific lengths of time. 2022, it shows, has seen a marked increase in coins stationary for between one and two years.Bitcoin HODL Waves chart (screenshot). Source: Unchained CapitalCoinbase order book is “dead”On the topic of hodling, current conditions appear to be firmly lackluster for exchanges amid little genuine interest in buying crypto assets.While the world’s largest asset manager, BlackRock, announced a partnership with U.S. exchange Coinbase last week, its order book remains “dead,” one commentator puts it, with retail interest absent this summer.Byzantine General further noted a “crazy imbalance” between bids and asks, indicating that the majority of exchange users are waiting for BTC/USD to match its June lows of $17,600.Here’s another visualisation of this pretty crazy imbalance.From 20k to 10k: ₿12000 in bids From 20k to 30k: ₿2000 in asks pic.twitter.com/6iKW1oXecr— Byzantine General (@ByzGeneral) August 7, 2022

Data from the Binance order book supplied by on-chain monitoring resource Material Indicators likewise highlights gaps in activity much above $24,000.This can change quickly, however, as spot price moves up and down its trading range.BTC/USD buy and sell levels (Binance) as of Aug. 7. Source: Material Indicators/ TwitterSentiment “unironically” marking price bottomsWhen it comes to the bear market rally, sentiment data may offer an unlikely clue as to whether the true bottom is really in.Related: Top 5 cryptocurrencies to watch this week: BTC, FLOW, THETA, QNT, MKRAs noted by research firm Santiment and macro analyst Alex Krueger, mainstream interest in Bitcoin bear markets in fact tends to peak just after, not before, macro asset price bottoms.Lo and behold, the 2022 Bear Market Rally! Historically people googles for “Bear Market Rally” right after the market bottoms (granted, the sample size is just two).h/t @zentrader1254 pic.twitter.com/2v0O82M88h— Alex Krüger (@krugermacro) August 7, 2022

While Kruger contrasted the events of March 2020 with 2009 in the S&P 500, Santiment pointed to social media content relating to Bitcoin around BTC price floors.Even mentions of classic crypto-crowd terms such as “moon” and “Lambo” peak once the worst of the price drawdown is done, it concluded in findings published last week.“During the crypto slide in 2022, the crowd has been calling for moon and lambo in a sarcastic fashion whenever prices drop again,” researchers explained on Twitter:“However, the true irony is that spikes in these words are actually often marking moments when $BTC is about to rise.”Bitcoin social media engagement chart. Source: Santiment/ TwitterAccording to the sentiment gauge, the Crypto Fear & Greed Index, meanwhile, support is building above the market’s “extreme fear” zone, which has been absent since mid-July.The Index measures 30/100 on Aug. 8, unmoved versus the day prior and representative of “fear” being the overall market mood. “Extreme fear” corresponds to a score of less than 25.Crypto Fear & Greed Index (screenshot). Source: Alternative.meThe views and opinions expressed here are solely those of the author and do not necessarily reflect the views of Cointelegraph.com. Every investment and trading move involves risk, you should conduct your own research when making a decision.

Čítaj viac

Elon Musk: US 'past peak inflation' after Tesla sells 90% of Bitcoin

Bitcoin (BTC) is in short supply at Tesla, even as its CEO predicts that United States inflation has already peaked.Speaking at Tesla’s 2022 Annual Meeting of Stockholders on Aug. 5, Elon Musk predicted that an upcoming United States recession would only be “mild to moderate.”Musk on costs: “The trend is down”After recently selling almost all of its $1.5 billion BTC holdings, Tesla is seeing the emergence of exactly the kind of economic landscape in which risk assets thrive.During a Q&A session at the Annual Meeting, Musk revealed that six-month commodities pricing for Tesla parts is already getting cheaper, not more expensive. Commodities, he said, are trending down, providing a hint that inflation has already hit its highest levels. “We sort of have some insight into where prices are headed over time and the interesting thing that we’re seeing now is that most of our commodities, most of the things that go into a Tesla — not all, more than half — the prices are trending down in six months,” he said.“This could change, obviously, but the trend is down, which suggests that we are past peak inflation.” The recovery from an inflationary period with commodities heading downhill provides fertile ground for a recovery in risk assets, including crypto. Theoretically, this comes as a result of lower inflation meaning less tightening by the Federal Reserve, providing favorable conditions for risk-on investments.Should strength return to markets and crypto outperforms, the trend will be an ironic one for Tesla, which divested itself of practically all its BTC exposure — at a profit of just $64 million — last month. At the time, Musk added that BTC could return to the firm’s balance sheet at a later date, and that the decision was not a commentary on Bitcoin per se. The Annual Meeting, meanwhile, produced further optimistic predictions on macro, including a potential U.S. recession being “relatively mild” and lasting approximately eighteen months. Inflation, Musk added, will “drop rapidly.”A race higher in the second half of 2022The irony of Musk’s comments was not lost on crypto commentators, and other voices are already betting on a rebound in stocks being here to stay.Related: Bitcoin price: weekend volatility ‘expected’ with $22K level to holdAmong them is Fundstrat Global Advisors, which this week noted that markets have historically found a bottom half a year before the Fed stops tightening via key interest rate hikes.The second half of 2022, the firm thus predicted, could take the S&P 500 to 4,800 points — a boon for crypto markets still heavily correlated with moves in equities in general.This is important to keep in mind – markets know rates are going up- it’s the “shock” that hurts markets Today’s job report is not a “shock”Get the “first word” at https://t.co/Vsy6WwaIxa @fs_insight https://t.co/HtuTCJANtO— Thomas (Tom) Lee (not the drummer) FSInsight (@fundstrat) August 5, 2022As Cointelegraph reported, further insight into Bitcoin’s potential comeback came from the world’s largest asset manager this week. BlackRock, with over $9 trillion in assets, has partnered with U.S. exchange Coinbase to bring crypto exposure to clients.The views and opinions expressed here are solely those of the author and do not necessarily reflect the views of Cointelegraph.com. Every investment and trading move involves risk, you should conduct your own research when making a decision.

Čítaj viac

Bitcoin price: weekend volatility ‘expected’ with $22K level to hold

Bitcoin (BTC) rose above $23,000 again into Aug. 6 as new analysis predicted a potential surge of 20% or more.BTC/USD 1-hour candle chart (Bitstamp). Source: TradingViewDaily chart gives trader $30,000 targetData from Cointelegraph Markets Pro and TradingView showed BTC/USD climbing overnight to once again sit near the top of its established trading range.After multiple attempts to break out above range resistance at $23,500, the pair appeared still stuck in limbo at the time of writing, but hopes of bullish continuation were already there.“Expecting more volatility over the wknd,” on-chain monitoring resource Material Indicators wrote in part of its latest Twitter update on Aug. 5. “If the Bear Market Rally can push BTC above 25k there isn’t much friction to 26k – 28k range. Losing the trend line would be bad for bullish hopes and dreams.”$28,000 would be over 20% higher than current spot price, and would represent a near two-month high.Material Indicators included a chart showing the trendline mentioned sitting at $22,000 — around Bitcoin’s current realized price.The chart further showed bid support increasing immediately below spot, while major resistance lay at $24,500.BTC/USD buy and sell levels (Binance) with trendline. Source: Material Indicators/ TwitterWeekend trading traditionally sparks more volatile price action thanks to a lack of liquidity on exchange order books, which are dominated by retail traders while institutions and professionals stay away until the new trading week.Analyzing the daily chart, meanwhile, popular trading account CROW entertained even higher levels, revealing plans to take profits only at $30,000 as long as Bitcoin continued making higher highs and higher lows.$BTCKeeping it simpleThe market structure is bullish, and I’ll stay bullish as long as we’re making Higher Lows and Higher Highs.$30k is my main area of interest to take profit.#Bitcoin pic.twitter.com/LGGyW5whB4— CROW (@TheCrowtrades) August 6, 2022″Weekend is all about range trading due to the fake outs,” trader Crypto Tony added. “I like to identify the range and then play accordingly Ranges are effective at identifying true breakouts, or fake outs. You can play both of them.”Monthly RSI hints BTC price comeback is beginningTurning to on-chain data, PlanB, creator of the Stock-to-Flow family of Bitcoin price models, again flagged relative strength index (RSI) performance flipping bullish.Related: ‘Insane evidence’ Bitcoin has capitulated in past 2 months — analysisRSI is a core metric which shows how comparatively overbought or oversold BTC is at a certain price, and in June hit its lowest levels ever.Now rebounding, RSI could even signal an end to the 2022 bear market, PlanB suggested.#bitcoin Relative Strength Index (RSI) bounced back in June. Bear market over? pic.twitter.com/hsb6S6aW0n— PlanB (@100trillionUSD) August 6, 2022

In a previous post on Aug. 3, meanwhile, PlanB acknowledged that BTC/USD was still “far below” the stock-to-flow daily estimate, this being $83,475 for Aug. 6 according to automated calculator S2F Multiple.The views and opinions expressed here are solely those of the author and do not necessarily reflect the views of Cointelegraph.com. Every investment and trading move involves risk, you should conduct your own research when making a decision.

Čítaj viac

Získaj BONUS 8 € v Bitcoinoch

nakup bitcoin z karty

Registrácia Binance

Burza Binance

Aktuálne kurzy