Autor Cointelegraph By William Suberg

BlackRock Bitcoin fund launch sends BTC price towards $25K

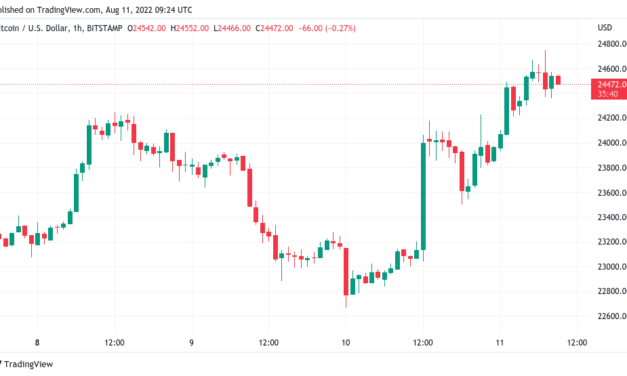
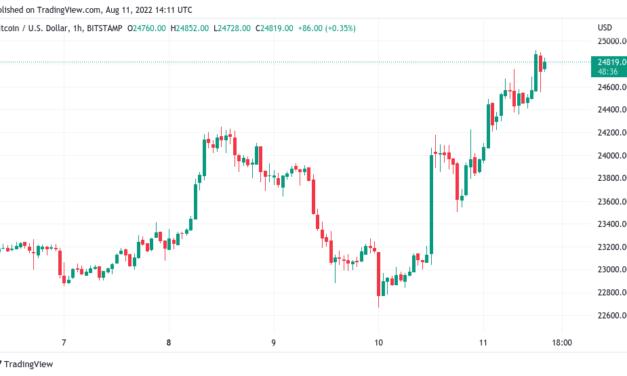
Bitcoin (BTC) continued toward $25,000 on the Aug. 11 Wall Street open amid news that the world’s largest asset manager had launched a BTC product.BTC/USD 1-hour candle chart (Bitstamp). Source: TradingViewSilbert on BlackRock: “Here comes Wall Street”Data from Cointelegraph Markets Pro and TradingView followed BTC/USD as it spike to $24,921 on Bitstamp as United States stocks trading got underway.While going on to consolidate slightly below the highs, the pair inspired confidence in market sentiment, with popular crypto industry figures already seeing positive implications of the BlackRock move.”Here comes Wall Street…,” former Grayscale CEO, Barry Silbert, responded.For Blockware lead insights analyst, William Clemente, however, the news was a landmark event in Bitcoin’s history.”Last comment on the matter: Think the Blackrock news is probably the most bullish news for a long term Bitcoin holder ever,” he told Twitter followers. “Not just the news itself, but that it signals to some the water is fine and to others if they don’t offer their clients BTC they’ll get their lunch ate.”BlackRock’s CEO, Larry Fink, had described Bitcoin just five years earlier as an “index of money laundering.” He had appeared to change his tune by 2020, acknowledging the largest cryptocurrency’s potential to become a “global market.”BlackRock’s offering would take the form of a spot Bitcoin private trust, it confirmed in a statement.”The trust is available to U.S. institutional clients and seeks to track the performance of bitcoin, less expenses and liabilities of the trust,” it read. “Despite the steep downturn in the digital asset market, we are still seeing substantial interest from some institutional clients in how to efficiently and cost-effectively access these assets using our technology and product capabilities.”As Cointelegraph reported, the firm’s initial foray into Bitcoin this month came via a partnership with U.S. exchange Coinbase.June futures gap comes into playTurning to potential short-term price targets, the mood among commentators was thus flexible if still not outright bullish.Related: Bitcoin battles 2-month resistance amid ‘most hated’ stocks rallyFor on-chain monitoring resource Whalemap, potential upside and downside remained considerable, with $20,000 still not safe as a floor.”$BTC is breaking out of an ascending triangle on low volatility meaning we should be expecting a big move soon enough,” the Whalemap team revealed alongside a chart showing relevant levels. “Holding up to the break out is the number one priority where the realistic targets would be 27–29k above or 19k below in case we don’t hold.”Bitcoin levels annotated chart. Source: Whalemap/ TwitterPopular Twitter account Altcoin Bets meanwhile added that “as long as we stay above 24k on daily, we should reach for 28k CME gap,” referring to a void in the CME Bitcoin futures chart, which often acts as a spot price magnet.CME Bitcoin futures 1-day candle chart with nearest “gap” highlighted. Source: TradingViewThe views and opinions expressed here are solely those of the author and do not necessarily reflect the views of Cointelegraph.com. Every investment and trading move involves risk, you should conduct your own research when making a decision.

Čítaj viac

Bitcoin battles 2-month resistance amid ‘most hated’ stocks rally

Bitcoin (BTC) pierced the top of a stubborn trading range on Aug. 11 as a decidedly awkward rally took hold of risk assets.BTC/USD 1-hour candle chart (Bitstamp). Source: TradingViewBitcoin retracement warnings intensify near $25,000Data from Cointelegraph Markets Pro and TradingView showed BTC/USD hitting highs of $24,750 on Bitstamp, marking its best performance since June 13.The pair had attempted several breakouts to the top of the range in prior weeks, these all failing in the face of stiff selling pressure. New United States inflation data released this week formed a long-awaited catalyst for change, however, with Bitcoin and altcoins rising in step with equities as the Consumer Price Index (CPI) print for July suggested that inflation had peaked.On Aug. 10, the day of the release, the S&P 500 and Nasdaq Composite Index gained 2.1% and 1.9% respectively. BTC/USD, on the other hand, saw a daily candle of around $900.Rather than pile on the optimism, however, market commentators were anything but blanket bullish as the dust settled. Sentiment, investor Raoul Pal noted, was treating the post-CPI rally as a black sheep.“Well, this appears to be one of the most hated rallies I’ve seen in quite few years in equities,” he told Twitter followers in a dedicated thread.Pal nonetheless argued that there was a “very decent chance” that equities had seen their lows in June.Forecasting a major change of tune in crypto, meanwhile, popular trader and analyst Il Capo of Crypto stuck by $25,500 as the maximum likely target before a new downtrend began.Almost there. https://t.co/oJFpD5BVz9 pic.twitter.com/2pjpUgw85T— il Capo Of Crypto (@CryptoCapo_) August 11, 2022“$BTC Pumped almost 40%. Huge Possibility, Retrace Coming. Buy The Dip,” fellow account Jibon continued in further Twitter comments.A slightly more hopeful Crypto Tony meanwhile said that hodlers would be “in for a treat” if the range high managed to hold.Eyeing potential similarities between the Bitcoin chart now and in March 2020, BTCfuel added that a further breakout was not off the cards.The #Bitcoin March 2020 bull trap and crash are quite similar to the current setup. Bitcoin looks like breaking out right now pic.twitter.com/WkITQ2G7py— BTCfuel (@BTCfuel) August 10, 2022

Doubts emerge over Ethereum rallyThe impressive performance across altcoins meanwhile put largest altcoin Ether (ETH) firmly in the spotlight after ETH/USD gained over 11%.Related: Bitcoin dominance hits 6-month lows as metric proclaims new ‘alt season’The pair continued its gains on the day, passing $1,900 for the first time since June 6 and now approaching the psychologically significant $2,000 mark.The CPI momentum added to an already excitable Ethereum market, with the Goerli testnet merge — a  key preparatory step for the full Merge event in September — concluding successfully.“Since the start of this bear market rally, in the middle of June, Ethereum is gaining dominance in terms of trading volume relative to Bitcoin. In the latest few days, Ethereum and Bitcoin Dominance has even crossed,” Maartuun, a contributing analyst at on-chain data platform CryptoQuant, wrote in a blog post on Aug. 10.Maartuun cautioned that historical precedent nonetheless did not favor a sustained rally across crypto should this continue to be led by ETH.“It is clear that Ethereum is very populair on exchanges, because of the gaining dominance. That makes sense because of the upcoming 2.0 merge,” he added. However, from my 5-year experience in the cryptomarket, rally’s which are led by Ethereum are usually not the healthiest thing for the market. As you already could read in my previous analysis, I’m very conservative. Especially because Ethereum already made a > 100% move from the lows:”However, from my 5-year experience in the cryptomarket, rally’s which are led by Ethereum are usually not the healthiest thing for the market. As you already could read in my previous analysis, I’m very conservative. Especially because Ethereum already made a > 100% move from the lows.”ETH/USD 1-day candle chart (Binance). Source: TradingViewThe views and opinions expressed here are solely those of the author and do not necessarily reflect the views of Cointelegraph.com. Every investment and trading move involves risk, you should conduct your own research when making a decision.

Čítaj viac

Bitcoin price sees $24K, Ethereum hits 2-month high as US inflation shrinks

Bitcoin (BTC) regained $24,000 but failed to hit new multi-month highs on Aug. 10 as United States inflation appeared to be slowing.BTC/USD 1-hour candle chart (Bitstamp). Source: TradingViewCPI cuts risk assets much-needed slackData from Cointelegraph Markets Pro and TradingView confirmed hourly gains of around $1,000 after U.S. Consumer Price Index (CPI) data for July showed a slowdown versus the previous month.While managing $24,179 on Bitstamp, BTC/USD nonetheless did not attract enough momentum to challenge levels from the day prior.Nonetheless, relief among traders was palpable, as declining inflation should signal to the Federal Reserve that less aggressive interest rate hikes are necessary going forward. This,  in turn, should reduce pressure on risk assets, including crypto.Year-on-year CPI inflation came in at 8.5%, 0.2% below expectations, while month-on-month, the figure was unchanged from June.Over to you Sir Powell, you know what to do. pic.twitter.com/qwMbdtriNm— Arthur Hayes (@CryptoHayes) August 10, 2022″Markets now have a pretty clear run until regional Fed surveys in a weeks or so. I expect those to be significantly weaker,” Raoul Pal, founder of Global Macro Investor, reacted. “Peak inflation gives way to peak growth fear. I do think markets will react positively to weak growth, not negatively, broadly speaking.”Blockware lead insights analyst, William Clemente, was more cautious, describing the rally in risk assets as continuing “short term” on the back of the print.Faith in the Fed cooling its aggressive rate hike cycle meanwhile played out almost immediately, with bets of a 75-basis-point hike in September starkly reduced in favor of 50 basis points.”Jul CPI is bullish especially for tech stocks,” markets commentator Holger Zschaepitz added.Dollar dives in step as Ethereum beats multi-month bestCelebrating the CPI event more than Bitcoin, meanwhile, was Ether (ETH), which capitalized on the mood to post its highest levels since June 7.Related: Bitcoin dominance hits 6-month lows as metric proclaims new ‘alt season’At $1,847, ETH/USD gained 11.5% on the day, fueling hopes that the crypto rally could be more than a fakeout.”Some of you forget that the market can pump and it actually not be a trap. Especially if fundamentally driven,” trader and commentator Josh Rager tweeted.ETH/USD 1-day candle chart (Binance). Source: TradingViewA clear loser on the day, however, was the U.S. dollar, which extended a downtrend in place since mid-July on the CPI print.The U.S. dollar index (DXY) lost 1.3%, now targeting its 100-day moving average, according to popular trader Pierre.$DXY – D1Hard to make it clearer/cleaner, I guess simple TA works too on US ponzi.Until D1 trend reclaimed, I guess D1 100 MA @ 103-104 doable but what do I know. https://t.co/FeGFYBFcdi pic.twitter.com/lhQEcbIxTK— Bierre (@pierre_crypt0) August 10, 2022

Sven Henrich, founder of analytics firm NorthmanTrader, described DXY as “getting crushed.”The views and opinions expressed here are solely those of the author and do not necessarily reflect the views of Cointelegraph.com. Every investment and trading move involves risk, you should conduct your own research when making a decision.

Čítaj viac

Bitcoin braces for US inflation data as CPI nerves halt BTC price gains

Bitcoin (BTC) hit multi-day lows into Aug. 10 as crypto traders braced for impact with fresh United States inflation data. BTC/USD 1-hour candle chart (Bitstamp). Source: TradingViewTrader: Market “could get ugly” if CPI keeps risingData from Cointelegraph Markets Pro and TradingView showed BTC/USD dipping to $22,668 on Bitstamp at the most recent daily close — its lowest since Aug. 5.Bullish momentum had evaporated during the day prior, and the mood among traders was firmly risk-off as markets awaited the latest Consumer Price Index (CPI) readout.Covering July, the data was due at 8.30am Eastern time Aug. 10, with expectations demanding it show that U.S. inflation had already peaked.“CPI prints have been pretty pitoval for BTC price action,” Blockware lead insights analyst William Clemente wrote in part of a tweet about the event, adding that CPI would form a “big day” for crypto.An accompanying chart showed the impact of previous CPI readouts on BTC/USD.BTC/USD annotated chart showing CPI events. Source: William Clemente/ TwitterTrader and analyst Daan Crypto Trades meanwhile gave a CPI reading of 9.1 or above as “bearish” for price action against current expectations of 8.7.CPI Guide for today in my opinion:CPI YoY: BearishCore CPI YoY BearishMore thoughts below — Daan Crypto Trades (@DaanCrypto) August 10, 2022“The market has been pumping on the idea of inflation having likely peaked the past month,” he wrote in a dedicated thread. “If it doesn’t get that confirmation today I think it could get ugly short term as the peak will likely be moved forward another 1-2 months. Which likely means a delayed Fed pivot as well.”Macro analyst Alex Krueger was more dismissive, meanwhile, calling CPI a “little number” while acknowledging its impact on risk asset trends.BTC price still far from bullish pivot zoneBTC price action thus stayed wedged in a familiar range with classic support and resistance levels still in play. Related: Bitcoin dominance hits 6-month lows as metric proclaims new ‘alt season’BTC/USD circled $23,000 at the time of writing after dropping more than $1,000 the day prior.Daan Crypto Trades flagged $24,300 as a crucial level to break and hold for Bitcoin to “fly,” with $21,000 a potential target in the event of a breakdown.$BTC Testing a critical support level here with the 4H 200EMA coming in below it at $22.7K.If we’d get a full on breakdown then the logical target would be low $21Ks.Break and hold above $24.3K and we’ll fly.Those are my levels to watch for the time being. pic.twitter.com/UrDmxuebGf— Daan Crypto Trades (@DaanCrypto) August 9, 2022

On-chain monitoring resource Whalemap meanwhile continued its analysis of whale buy and sell levels. “$BTC is back to the whale accumulation area,” the Whalemap team summarized on Aug. 9. “Prices where whales accumulate usually act as support or resistance for price action of Bitcoin. Question is, will we get a bounce again or go deeper.”Bitcoin whale wallet inflows annotated chart. Source: Whalemap/ TwitterThe views and opinions expressed here are solely those of the author and do not necessarily reflect the views of Cointelegraph.com. Every investment and trading move involves risk, you should conduct your own research when making a decision.

Čítaj viac

Bitcoin dominance hits 6-month lows as metric proclaims new 'alt season'

Bitcoin (BTC) is facing fresh competition from altcoins this month as data shows that — technically — it is already “alt season.”Figures from CoinMarketCap and TradingView show that BTC currently makes up around 41% of the overall crypto market capitalization — its lowest since the start of 2022.Bitcoin sheds market cap prowessAfter suffering at the hands of the Terra LUNA — now renamed Terra Classic (LUNC) — collapse, altcoin markets have rallied considerably in recent months. Alongside Bitcoin’s return from 18-month lows of $17,600 in June, altcoins have enjoyed their own renaissance, one tha is now giving Bitcoin bulls a run for their money. According to CoinMarketCap, Bitcoin’s market cap share is now at its lowest since mid-January, with the largest altcoin Ether (ETH), in particular, stealing the limelight in recent weeks.From lows of 14.3% on June 19, Ethereum’s market cap dominance now stands at 19%.Bitcoin market cap dominance 1-week candle chart. Source: TradingViewThe case for altcoin bets is further bolstered by a dedicated metric tasked with calling “altseason” — a period where altcoins outshine Bitcoin as investments.With a normalized score of 94/100, the Altcoin Season Index is currently flashing its most convincing altseason reading since June 2021. The closer to zero the score is, the more the metric favors Bitcoin over altcoins. Alt season is called once “75% of the Top 50 coins performed better than Bitcoin over the last season,” its description explains, adding that a “season” equates to the past 90 days.Altcoin Season Index (screenshot). Source: Blockchaincenter.Bitfinex ETH long bets crash to May lowsControversy over the upcoming Merge event, meanwhile, meant that ETH performed similarly unconvincingly on short timeframes this week.Related: What the fork? Ethereum’s potential forked ETHW token is trading under $100In the 24 hours to the time of writing on Aug. 9, ETH/USD was down almost 7%, while BTC/USD shed $1,000 in hours on the day.Nerves over the Aug. 10 United States Consumer Price Index (CPI) readout contributed to the downside, analysts including Cointelegraph contributor Michaël van de Poppe argued.Whale closed 300.000 Long positions on BitfinexLet’s find out WHY this is important and WHAT it could mean for the market #Bitcoin #Ethereum #Crypto #Bitfinex #Futures pic.twitter.com/oiAotLM1Ll— Maartunn (@JA_Maartun) August 8, 2022On-chain monitors, meanwhile, noted that a major player on exchange Bitfinex had drastically reduced their long ETH exposure, indicative of a belief that downside was all but guaranteed next.At the time of writing, longs were at the same lows as immediately before May’s Terra incident.ETH/USD longs 1-day candle chart (Bitfinex). Source: TradingViewVan de Poppe nonetheless called for constraint when it came to upcoming ETH price action.”People already flashing targets of $300 or $600 for Ethereum on the first slight correction,” he tweeted. “There’s literally no need for that, despite the fact that people are heavily stuck in their bias. Due to that bias, they won’t be able to watch markets objectively.”ETH/USD 1-hour candle chart (Binance). Source: TradingViewThe views and opinions expressed here are solely those of the author and do not necessarily reflect the views of Cointelegraph.com. Every investment and trading move involves risk, you should conduct your own research when making a decision.

Čítaj viac

Získaj BONUS 8 € v Bitcoinoch

nakup bitcoin z karty

Registrácia Binance

Burza Binance

Aktuálne kurzy