Autor Cointelegraph By William Suberg

Bitcoin price heads above $23.5K after highest EU inflation in history

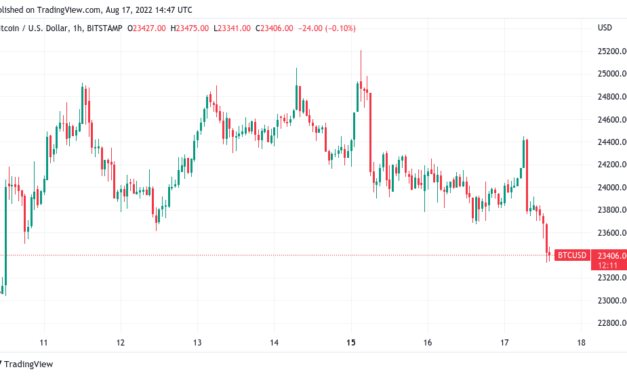
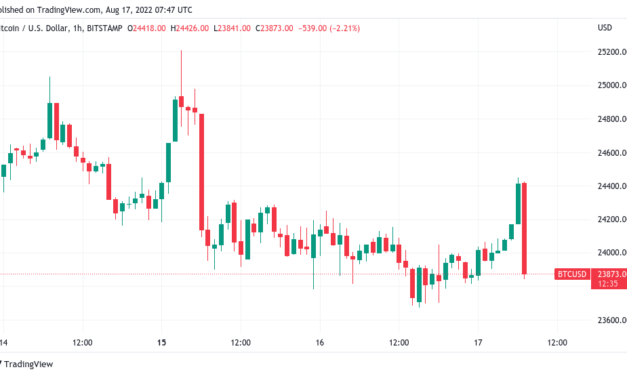
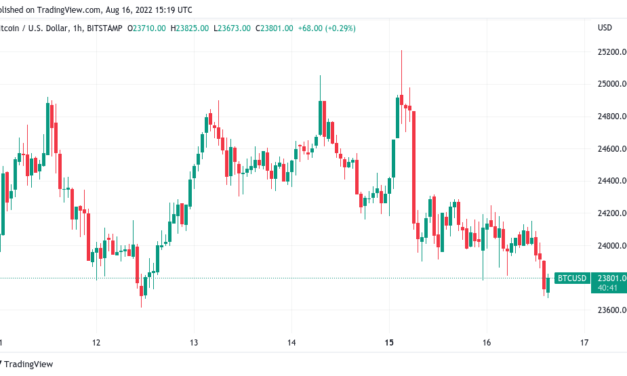
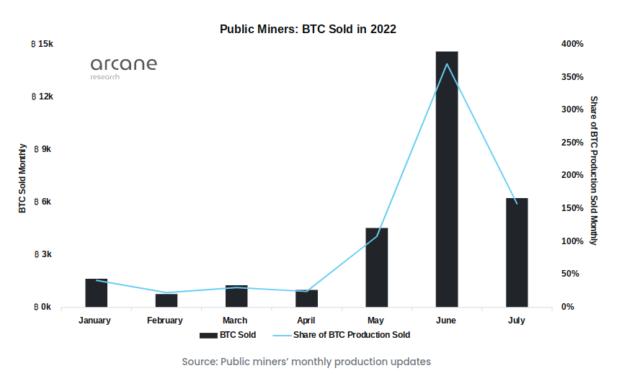
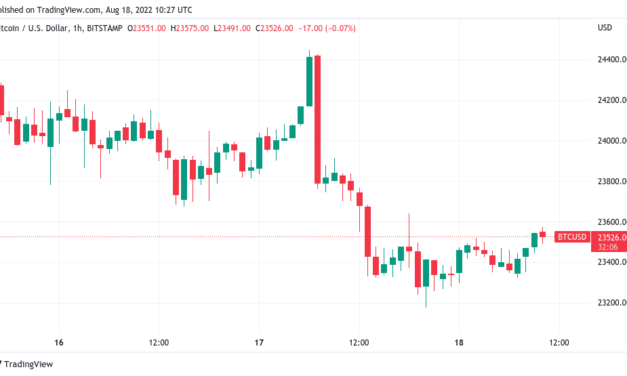
Bitcoin (BTC) shifted higher on Aug. 18 as the latest data confirmed the European Union’s highest ever inflation.BTC/USD 1-hour candle chart (Bitstamp). Source: TradingViewSupport and resistance close in on BTC spot priceData from Cointelegraph Markets Pro and TradingView showed BTC/USD passing $23,500 at the time of writing, having preserved $23,000 as support overnight.Concerns over a deeper risk asset drawdown had become widespread over the week, with Bitcoin and Ether (ETH) notably unable to crack long-term resistance levels.With bulls seemingly on the back foot, the mood among analysts was naturally wary. “BTC did break down from this huge rising channel/wedge everyone seems to be watching,” Daan Crypto Trades wrote in part of his latest Twitter update. “23.8-24K will act as resistance. Break back in and this would be a big bear trap. Bearish rejection and we head down.”Near-term support meanwhile came in the form of whale buy-ins at $22,800 and up, on-chain monitoring resource Whalemap argued. Now just below Bitcoin’s 200-week moving average, the $22,800 zone should be the line in the sand to watch in the event of a market downturn.“Back to square one,” the Whalemap team summarized alongside a chart showing the extent of hodled whale coins by price point. “Whale accumulations at $23,400-$22,800 is still the closest support we have for Bitcoin (if we start falling).”Bitcoin whale wallet inflows annotated chart. Source: Whalemap/ TwitterInflation beats recordsMacro triggers were clearly inflation-skewed on the day, with the EU’s 9.8% July print headlining.Related: Bitcoin miners hodl 27% less BTC after 3 months of major sellingThe figure for July marked the bloc’s highest ever inflation reading, up from 9.6% year-on-year in June. For context, in July 2021, inflation was 2.5%.“The lowest annual rates were registered in France, Malta (both 6.8%) and Finland (8.0%). The highest annual rates were recorded in Estonia (23.2%), Latvia (21.3%) and Lithuania (20.9%),” a report from Eurostat stated. “Compared with June, annual inflation fell in six Member States, remained stable in three and rose in eighteen.”In an interview with Reuters on Aug. 18, Isabel Schnabel, Member of the Executive Board of the European Central Bank (ECB), could not say with confidence that inflation had peaked.“I would not exclude that, in the short run, inflation is going to increase further,” she said. “But any projection is currently subject to high uncertainty. So it’s very difficult to predict when inflation is going to peak.”The EU numbers came a day after the United Kingdom recorded the first double-digit inflation readings since the early 1980s.This month, United States price growth appeared to be slowing, with the next inflation readout due on Sep. 13.The views and opinions expressed here are solely those of the author and do not necessarily reflect the views of Cointelegraph.com. Every investment and trading move involves risk, you should conduct your own research when making a decision.

Čítaj viac

Bitcoin price dives pre-FOMC amid warning $17.6K low was not the bottom

Bitcoin (BTC) dropped to weekly lows at the Aug. 17 Wall Street open as upcoming Federal Reserve comments unsettled risk assets.BTC/USD 1-hour candle chart (Bitstamp). Source: TradingViewDollar climbs as Fed minutes dueData from Cointelegraph Markets Pro and TradingView tracked a more than 2% daily decline on BTC/USD, which hit $23,325 on Bitstamp.Already showing signs of weakness, the pair slid further as United States equities began trading, hours before the Federal Open Markets Committee (FOMC) was due to release minutes from its latest meeting.While not involving a decision on interest rates, the meeting was cued to give an insight into the Fed’s thinking in terms of the next rate tweak due in September.“The important event tonight with the FOMC minutes, through which information can be received whether the FED is going to be hawkish or dovish,” Cointelegraph contributor Michaël van de Poppe summarized in his latest Twitter update. “I don’t think it will have a massive impact, however, crypto tends to give it a ton of value and, therefore, lots of volatility.”Stocks had hit major resistance in line with crypto during the week, leading some concerned sources to continue to predict a further major retracement across the board.Justin Bennett, founder of crypto education platform Crypto Academy, warned that the S&P 500 copying behavior from immediately prior to the 2008 Global Financial Crisis.“This is mind-blowing. The S&P 500 is mimicking the 2008 crash. Even the timing since the ATH is nearly identical,” he commented on a comparative chart. “The bottom is NOT in for stocks or crypto.”A telltale sign on the day came in the form of an advancing U.S. dollar, with the U.S. dollar index (DXY) seeking to attack resistance in place throughout August.“$DXY could be on its way to 112-113 after the fakeout below 105.50. That’s going to weigh on stocks and crypto,” Bennett added.U.S. dollar index (DXY) 1-day candle chart. Source: TradingViewBuyers eye lower bidsOn shorter timeframes, the trend on Bitcoin was also rapidly losing steam as bid support inched down the Binance order book.Related: Bitcoin price sees firm rejection at $24.5K as traders doubt strengthOn-chain monitoring resource Material Indicators captured the action, concluding that “even if we get another pump, still believe the Bear Market Rally is losing momentum.”An upside target could come in the form of the 100-day moving average, a separate post explained, this lying at $24,544 at the time of writing.“Been warning about this breakdown for Bitcoin the past few days,” commentator Matthew Hyland concluded. “Structure has shifted overall weak recently. Market seemed to have its first signs of life just last week. That seems to be short lived.”BTC/USD buy and sell levels (Binance). Source: Material Indicators/ TwitterThe views and opinions expressed here are solely those of the author and do not necessarily reflect the views of Cointelegraph.com. Every investment and trading move involves risk, you should conduct your own research when making a decision.

Čítaj viac

Bitcoin price sees firm rejection at $24.5K as traders doubt strength

Bitcoin (BTC) returned to range resistance on Aug. 17 amid ongoing concerns that a retracement is imminen.BTC/USD 1-hour candle chart (Bitstamp). Source: TradingViewNo success for Bitcoin bullsData from Cointelegraph Markets Pro and TradingView showed BTC/USD hitting $24,448 on Bitstamp, up 3.25% from the previous day’s low before diving $600 in under an hour.Momentum gained speed on the day, but bulls faced familiar resistance at levels keeping them broadly in check since mid-June. The past week’s trips to $25,000 and beyond remained brief breakouts beyond a two-month price ceiling.Analyzing the scenario, veteran trader Peter Brandt eyed a rising wedge setup in progress for Bitcoin with $20,700 as its starting point.On-chain monitoring resource Material Indicators was less convinced about the staying power of the current rally.Uploading a snapshot of the Binance order book on Aug. 16, it captured the resistance now preventing Bitcoin sealing further gains, adding that the setup “resembles prior local tops.”“Bid liquidity is kind of thin, but that tends to change after support is lost,” further comments stated.BTC/USD order book chart (Binance). Source: Material Indicators/ TwitterTrader Il Capo of Crypto meanwhile doubled down on a forecast involving BTC/USD reaching a maximum of $25,500 before heading significantly lower.Fellow trader Crypto Chase flagged underwhelming BTC performance versus stocks, specifically the S&P 500 since July.”$ES has mostly fulfilled my prediction,” he wrote. $BTC on the other hand is truly struggling amidst an up-only S&P500 (ES). Even a bear like me expected much more from BTC. I think this speaks to how weak crypto still is and that big money most certainly prefers S&P500 over crypto atm.BTC/USD vs. S&P 500 mini futures 1-day candle chart. Source: TradingViewEthereum shies away from $2,000On altcoins, Ethereum (ETH) briefly came within $50 of the $2,000 mark once more before reversing lower in step with BTC.Related: Bitcoin traders anticipate new yearly lows after BTC’s $25K rejection — Data disagreesThe largest altcoin by market cap had been outshined by Dogecoin (DOGE) the day prior, DOGE/USD gaining in excess of 11% on the day before cooling.ETH/USD 1-hour candle chart (Binance). Source: TradingViewTrader Wolf nonetheless revealed a bull flag for Ethereum’s moving average convergence/divergence (MACD) indicator on weekly timeframes.“There’s so much disbelief in this reversal that I might raise my target from to 2.5ks to 3.2ks,” he added in a subsequent Twitter post on the day.The views and opinions expressed here are solely those of the author and do not necessarily reflect the views of Cointelegraph.com. Every investment and trading move involves risk, you should conduct your own research when making a decision.

Čítaj viac

Bitcoin price hits multi-day low as data warns of 'overbought' stocks

Bitcoin (BTC) sank to intraday support on Aug. 16 as concerns emerged over the fate of United States stock markets.BTC/USD 1-hour candle chart (Bitstamp). Source: TradingViewU.S. stocks face stiff resistanceData from Cointelegraph Markets Pro and TradingView showed BTC/USD hitting $23,685 on Bitstamp, nearing lows from Aug. 12.After an eerily calm 24 hours, downside set in at the day’s Wall Street open as previous highs in excess of $25,000 looked increasingly like a double top.#BTC is dipping right now as part of a potential technical retest of previous resistance$BTC #Crypto #Bitcoin https://t.co/quL4gaM2nG pic.twitter.com/zrqzIbCvp2— Rekt Capital (@rektcapital) August 16, 2022Analyzing the potential outcomes, a typically conservative Il Capo of Crypto warned that upside was now highly unlikely given Bitcoin’s inability to break out.”Two options, both bearish,” he began a fresh Twitter update on the day by saying.”1) Up to 25400–25500 and then reversal of this medium tf bullish trend, straight to new lows. 2) Straight to new lows from here. Bearish confirmations: below 23500 and below 22500. Bullish continuation: consolidation above 26k.”The argument that BTC/USD would ultimately fail to crack resistance was strengthened by the view that U.S. equities were coming up against long-term ceilings of their own.SPX hitting a long-term level hereCould be some profit taking which is naturally going to impact $BTC and $ETH price with potential pullback pic.twitter.com/kLUgbtfz7d— Rager (@Rager) August 16, 2022

In his own analysis, Jurrien Timmer, director of global macro at asset manager Fidelity Investments, additionally flagged a large proportion of S&P 500 stocks trading above their 50-day moving averages.”The percentage of stocks in the S&P 500 trading above their 50-day moving average—88%—is stunning,” he commented.”Does this signal enough positive momentum to indicate that a new cyclical bull market is underway, or is this merely a bear market rally that is now at an overbought extreme?”A subsequent post added that many stocks had a relative strength index (RSI) of 70 or more, something Timmer said spoke to the “momentum” behind the current rally.Timothy Peterson, investment manager at Cane Island Alternative Advisors, meanwhile had an equally unappealing long-term prognosis for the S&P 500.The expected return for US equity over the next 10 years is 0: the S&P 500 will be ~4,000 in 2032. #Inflation-adjusted, #stocks will lose ~30% of their purchasing power. Oh, and this is a completely different metric than what was posted before.https://t.co/Mz09UVIzT2 pic.twitter.com/L0aOWxz1F3— Timothy Peterson (@nsquaredmacro) August 15, 2022

The index was down 0.3% on the day at the time of writing, while the Nasdaq Composite Index traded down 1%.DOG steals the show on altcoinsOn altcoins, it was Dogecoin (DOGE) leading the gains amid an otherwise flat top ten cryptocurrencies by market cap.Related: Traders flinch after Ethereum price rejects at $2,000DOGE/USD passed $0.09 for the first time since May 18 on the day, marking gains of 86.5% versus the pair’s recent macro bottom in mid-June.DOGE/USD 1-day candle chart (Binance). Source: TradingViewBy contrast, Ether (ETH) was unmoved over the past 24 hours, nonetheless trading under $1,900.ETH/USD 1-day candle chart (Binance). Source: TradingViewJames Stanley, senior strategist at trading firm DailyFX, was nonetheless bullish on ETH/USD versus its own June lows, placing support at $1,818.The views and opinions expressed here are solely those of the author and do not necessarily reflect the views of Cointelegraph.com. Every investment and trading move involves risk, you should conduct your own research when making a decision.

Čítaj viac

Bitcoin miners hodl 27% less BTC after 3 months of major selling

According to a fresh prediction from crypto analysis firm Arcane Research, miners will continue to sell more BTC than they earn.Miners sold nearly 30% of record BTC stash since MayThe trip to $25,000 this month decreased pressure on a Bitcoin mining sector which has struggled throughout 2022.At one point, fears abounded that miners’ production cost was far higher than the Bitcoin spot price, and that heavy sales would result in order for miners to stay in business. Worse still, many may have to retire altogether due to their activities no longer being financially viable.Data from the period since May appeared to confirm that major upheaval was taking place. As Arcane notes, one public miner alone — Core Scientific — sold around 12,000 BTC in the period from May to July.While the trend showed signs of reversing last month, it will take even higher BTC prices to allow even the largest mining operators to hodl again.“Even though the public miners sold less than half the amount in July as in June, we still see that they are draining their holdings if we look at the percentage of the bitcoin production sold,” Arcane analyst Jaran Mellerud explained. “The public miners sold 158% of their bitcoin production in July, making it the third month in a row where they sold more than 100% of production.”Bitcoin public miner sales chart (screenshot). Source: Arcane ResearchFor context, in April 2022, miners’ hodled coins were at an all-time high, thanks to years of saving at least 60% of BTC received via block subsidies each month.After subsequent sales, however, their balance is trending towards 30% lower, and will only head higher until the monthly expense equilibrium is restored. “I expect the selling pressure to continue at between 100% and 150% of production unless something significant happens to the bitcoin price. This is equivalent to between 4,000 and 6,000 BTC per month,” Mellerud added.Bitcoin (BTC) may have increased 36% from its June lows, but for miners, the pain will continue.Light at the end of the tunnelAs Cointelegraph reported, a much-needed return to better days for miners could be closer than it seems.Related: BTC mining stocks double in a month as production rampsRevenue jumped nearly 70% in August, while Proof-of-Work mining in general is increasing in prominence beyond the crypto sphere.Environmental concerns are no longer holding back big money, as evidenced by the world’s largest asset manager, BlackRock, praising the sector this month. Steadily increasing Bitcoin fundamentals meanwhile provide real-time proof that the situation is stabilizing for the backbone of the Bitcoin network. Data from BTC.com estimates that difficulty is set to increase by around 0.7% this week.Bitcoin network fundamentals overview (screenshot). Source: BTC.comThe views and opinions expressed here are solely those of the author and do not necessarily reflect the views of Cointelegraph.com. Every investment and trading move involves risk, you should conduct your own research when making a decision.

Čítaj viac

Získaj BONUS 8 € v Bitcoinoch

nakup bitcoin z karty

Registrácia Binance

Burza Binance

Aktuálne kurzy